
MAP-MATCHING OF RADAR IMAGES AND ELECTRONIC
CHARTS USING THE HAUSDORFF DISTANCE
Tzu C. Shen and Andrés R. Guesalaga
Department of Electrical Engineering, Catholic University of Chile, 4860 Vicuna Mackenna,
Casilla 306-22, Santiago, Chile
Keywords: Map-matching, pattern recognition, radar calibration
Abstract: This paper describes a new method of image pattern recognition based on the Hausdorff Distance. The
technique looks for similarities between a given pattern and its possible representations within an image.
This method performs satisfactorily when confronted to image perturbations or partial occlusions. An
extension of the classical Hausdorff Distance technique chooses the best candidate among multiple sub-
optimal solutions. The search strategy is based on the Branch and Bounds algorithm, where cells with low
probability of containing the optimal solution are pruned, while feasible cells are divided again until the
optimal solution is found. By using this strategy, exhaustive and no-informative searches are avoided among
the possible combinations, reducing the processing time considerably. A case study is presented, where the
proposed method is applied to calibration of surveillance radars using hydrographic charts as models for the
radar echo images.
1 INTRODUCTION
It has been suggested that approximately 8%-10% of
vessels are now fitted with some form of electronic
chart systems (ECS) (Bailey, 2001). Furthermore a
standardization in chart formatting has been
observed in the last decades, where the International
Hydrographic Organisation has played a major role
developing the S57 standard for digital hydrographic
data transfer (IHO, 2000).
The integration of ECS and radar scan images is
becoming a must in navigation consoles and it can
be used for purposes other than navigation. In this
paper, the use of integrated imagery obtained from
navigation radars and ECS is addressed by
proposing an automatic map-matching technique to
estimate biases of radars and remove them from
range and bearing measurements. The aim of such
technique is to improve the accuracy of these
monitoring system, i.e. navigation, target
designation and surveillance among others.
This tool can be particularly useful for track-to-
track association procedures and track fusion (Hall
and Garga, 1999), where multiple sensors
interchange information of radar contacts but each
with deviations caused by factors such as difference
in sampling periods, sensor noise and distortions
caused by biases in range and bearing
measurements. It is mandatory for such systems to
reduce these kind of errors to a minimum, so a
simple technique to perform periodic calibrations of
these biases would be welcomed.
In modern navigation systems, an additional
problem arises due to the vulnerability of GPS to
spoofing or satellite denial. This is a matter of
particular concern in countries that do not conform
the military elite (Taylor, 2003).
Previous work in map-matching has been
reported in the literature, mainly for airborne
systems. In a previous work (Wilson et al, 1995), a
discrete relaxation technique is used for registering
incomplete radar images acquired from synthetic
aperture radars. They use a maximum-likelihood
technique to match Doppler beam sharpened images
to digital maps of rural terrain. Although these
techniques are related to the scope of this paper, they
differ in that the data is a sequence of non-
overlapping radar sweeps interspersed with
substantial dead-regions. Furthermore, the
application does not require precise calibration of
the radar in terms of range and bearing offsets, and
the problem of distorted regions is not an issue. A
novel technique based on the extended Kalman filter
has been recently proposed to estimate these offsets
(Guesalaga, 2003). By defining at least two
corresponding points from the radar image and the
94
Shen T. and Guesalaga A. (2004).
MAP-MATCHING OF RADAR IMAGES AND ELECTRONIC CHARTS USING THE HAUSDORFF DISTANCE.
In Proceedings of the First International Conference on Informatics in Control, Automation and Robotics, pages 94-101
DOI: 10.5220/0001128200940101
Copyright
c
SciTePress
electronic chart, the technique provides a rapid and
accurate calibration in range and bearing, giving also
estimates for the ship’s speed, heading, latitude and
longitude. It does not require GPS nor speed
information from the ship log unit. The method,
however, relies on the operator to detect and select
the corresponding points between the electronic
chart and the radar image. This is a major
disadvantage, since he has to disregard other more
important functions, is prone to introduce significant
errors and his performance can be affected by
fatigue.
The main objective of this work is the
development of a pattern recognition algorithm to
detect similarities between the radar measurements
and the model, represented by the electronic chart.
This will allow to find the corresponding points
between the two sets of data automatically.
The nature of the reference set (electronic charts)
restricts the possible approaches to techniques based
on models. Among them, some well-established
methods are those based on correspondences
(Anandan, 1989), correlation (Brock-Gunn and Ellis,
1992) and exact methods (Fredriksson et al, 2002).
There are other less popular techniques based on
previous knowledge of the domain (Worral et al,
1991), heuristics (Yuille et al, 1992) or contextual
(Prokopowicz, 1994).
Most of these methods do not perform
satisfactorily for the problem stated, because objects
can be totally or partially occluded or they can have
important distortions due to the polar nature of the
measurement (radar scans). Exact techniques or
those that rely on rigid or previously known models
for search, have to be discarded. These restrictions
are liberated in correspondence techniques that are
based on the Hausdorff Distance (Sim and Park,
2001). Furthermore, the problem of semi-occluded
objects and distortions are solved via extensions of
the latter technique, i.e. the so called Partial
Hausdorff Distance (Rucklidge, 1977) and the
extensions to the algorithm proposed in the
following sections.
1.1 The Hausdorff Distance (HD)
This technique is based on an rather “loose”
approach of looking for similar objects, instead of
trying to correlate pair of points in two images. By
taking two sets of points, one being the model and
the other the real image, the HD between them is
small when every point in one of the sets is near to
some point in the other image.
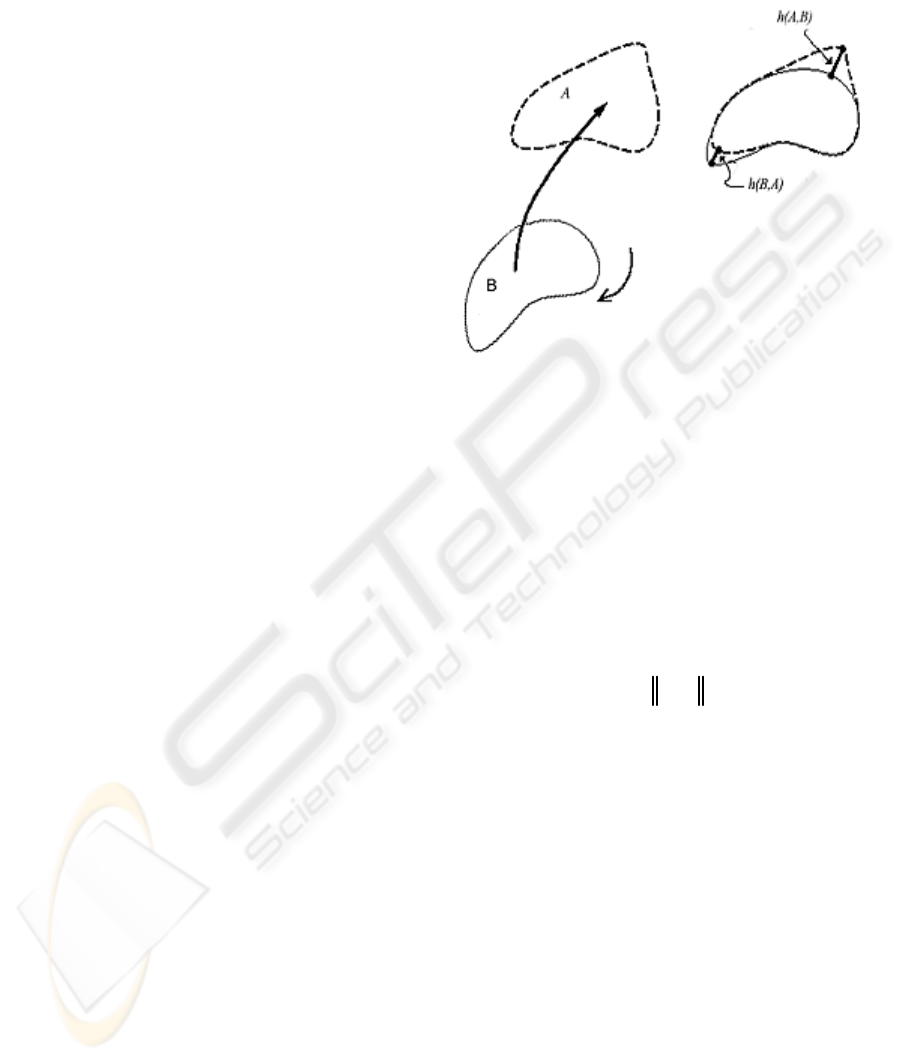
Figure 1 shows a geometric representation of the
HD when used for pattern recognition. Here sets A
and B are the model and real image respectively and
by rotating and translating the model, a satisfactory
matching is obtained.
Figure 1: Geometric representation of the HD, before and
after transformation
Given two sets with a finite number of points,
},...,,{
21 p
aaaA
=
and
},...,,{
21 q
aaaB =
, the
Hausdorff Distance between A and B is:
H(A,B) = max(h(A,B),h(B,A))
(1)
where,
baminmaxBAh
BbAa
−=
∈∈
),(
(2)
h(A,B) is called the standard Hausdorff Distance
between sets A and B. The algorithm sorts the points
in A according to its distance to the nearest point in
B and selects the largest as the result.
For instance, if h(A,B)=h, then every point in A
is at most at a distance h of a point in B, and the
point (with distance h), is the point with the largest
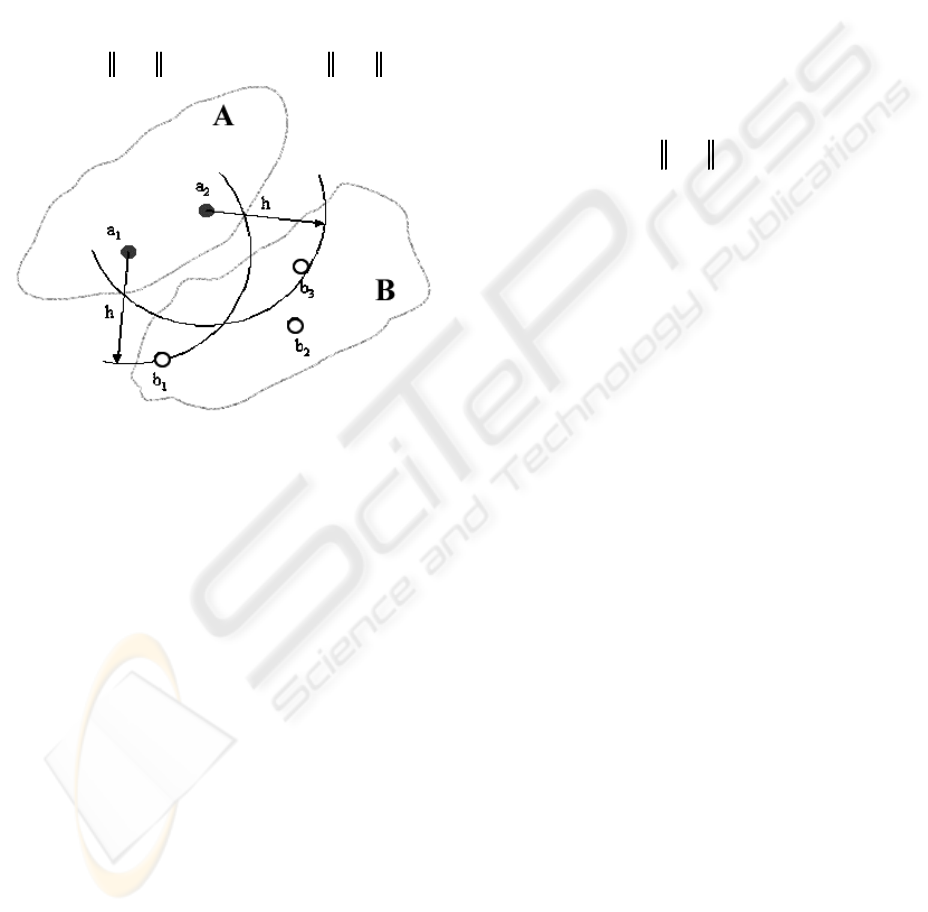
deviation. Figure 2 exemplifies the above concept
for sets A and B, each containing two and three
points respectively. It is important to note that this
index is in most cases asymmetric respect to its
inverse, i.e. h(A,B) ≠ h(B,A).
1.2 Voronoi surface
In practical applications, comparing only two sets of
data is not enough, since although the reference
pattern can be clearly defined, there are multiple
candidates B
i
that can be similar to the model A. In
order to reduce the number of calculations, the
a) before
b) after
MAP-MATCHING OF RADAR IMAGES AND ELECTRONIC CHARTS USING THE HAUSDORFF DISTANCE
95
concept of Distance Transformation (Borgefors,
1986) is introduced. Here, set A is pre-processed to
an intermediate state called the Voronoi matrix V
(Huttenlocher et al, 1992), for a subsequent
matching of the latter matrix with the different
candidates B
i
. By doing so, set A is processed only
once.
From equations (1) and (2), HD can be written as:
)('),(),( bdmaxadmaxmaxBAH
BbAa ∈∈
= (3)
where
axminxdbxminxd
AaBb
−=−=
∈∈
)('and)( (4)
Figure 2: Standard Hausdorff Distance, h(A,B)
The function }|)(,{)(
2
Rxxdxxd ∈= is called
the Voronoi Surface, and allows to perform the
Distance Transformation by filling the points of V
with the value d
max
obtained from matrix A. A
detailed description of the algorithm can be found in
(Rucklidge, 1997).
1.3 Modifications to the algorithm
Some modifications to the previous algorithm had to
be necessary for applications where sets A and B are
not identical. This is normally caused by occlusions,
measurement noise and image distortions caused by
the technique used the image acquisition. The latter
is particularly valid for radar images where the
measured set is obtained in polar co-ordinates, so
errors in range will cause a shrinkage or enlargement
of the objects. Sometimes these differences can be
also introduced in the intermediate stages such as
edge detection, expansion, rotation, translation and
others. To reduce the impact of these error sources,
some further steps are introduced in the method and
they are briefly described in the following
paragraphs.
Partial Hausdorff Distance
The above mentioned sources of error will generate
some false-positive points with a distance
significantly larger that the one of any true-positive
point. In order to eliminate the negative impact of
those points on the HD calculation, the method
chooses the j
th
distance instead of the largest one.
The rejection of the largest values can imply loosing
information, however, the effect is negligible when
considering the whole sets A and B, and the
improvement in the robustness of the method is
significant.
Mathematically:
nKforbaminKBAh
Bb
j
Aa
K
≤≤−=
∈
∈
1,),( (5)
where
j
Aa
K
∈
is the j
th
farthest distance between the
points in
A and those in B, and n is the number of
points in
B.
For convenience, the number of points in the
remaining set is defined in terms of a ratio of the
total set, i.e.
10,* ≤≤
=
kandnkK .
Handling Multiple Solutions
When searching for the candidate that gives the best
HD, several subsets B
i
with similar values may
appear. In these cases, some additional processing
stages must be included in the procedure. These
intermediate stages are:
Inverse Hausdorff Distance (Rucklidge, 1997)
Taking advantage of the asymmetric nature of the
HD, in certain cases it is possible to reject false-
positives by interchanging the roles of A and B, i.e.
h(B,A) is computed. False-positives will tend to give
significantly higher values that that of a real
solution, so they can be identified and eliminated.
Figure 3 shows an example of a false-positive.
The least HD average
When two or more candidates with similar values
for h(A, B
i
) are found, an effective criteria to select
the best set is by looking at their HD average. This
implies that in the set chosen, more points in the
image will resemble the model.
ICINCO 2004 - SIGNAL PROCESSING, SYSTEMS MODELING AND CONTROL
96
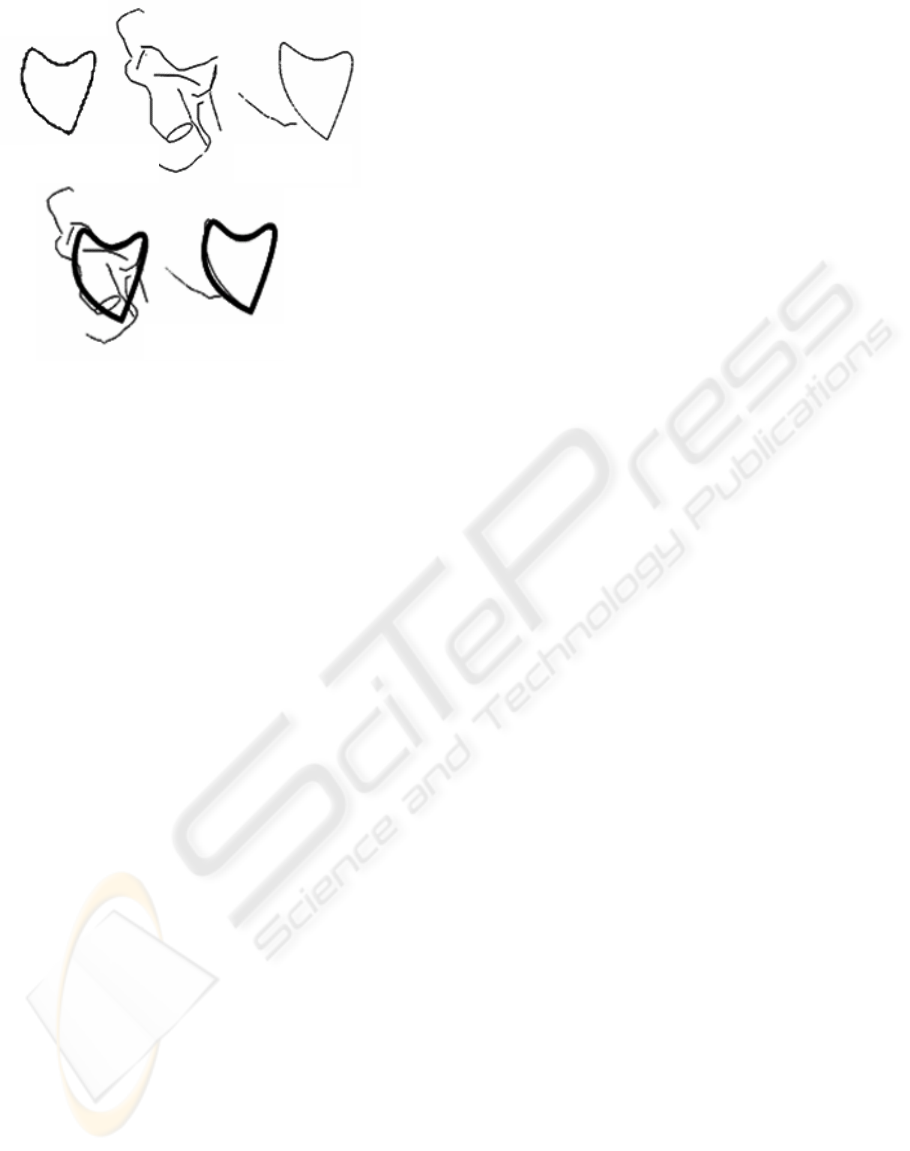
Figure 3: A false-positive case
1.4 The Searching Strategy
The search for the optimal solution is based on the
application of a large number of transformations on
the image. Some possible transformations or at least
those of interest for our application are: translation
(Cartesian displacement), rotation (angle) and
enlargement (radial distance). The optimal solution
would be the result of an image transformation of
the three types of transformations listed above,
applied over one of the sets, which gives the highest
similarity between sets A and B. The number of
transformations required in order to test all possible
combinations would be prohibitive in terms of
processing time if no additional information is
provided to the searching procedure. Although it is
not in the scope of this work, several searching
techniques were tested, and the Branch and Bound
method as described in (Breuel, 2003) was selected.
1.5 Edge Detection
In order to reduce the processing time further,
images are segmented by applying an edge detector.
The method used is the standard Sobel gradient as
described by Gonzales and Woods (1993).
2 APPLICATION TO RADAR
CALIBRATION
The aim of this application is to calibrate a maritime
radar by eliminating biases in bearing and range.
Electronic Chart are used to map-match the radar
images obtained with a navigation radar. The
matching is made by looking for the optimal
combination of basic transformations produced by
translation, rotation and range offset.
Due to the vulnerability of GPS systems and their
induced errors (when selective availability is turned
off), its used is not considered here, so estimation of
Latitude an Longitude is also carried out.
A novel method to estimate and correct these
errors using the Extended Kalman Filter is described
in the literature (Guesalaga, 2003). The method
requires that the search for correspondences between
the model (chart) and image (radar scan) must be
made manually, i.e. the operator has to click over the
corresponding points. This makes the method
unattractive, so the purpose of this work is to
provide a technique to find these correlations
automatically, without the intervention from the
operator.
2.1 Transformation model
Measurement points can be numerous and sparse. In
fact, the larger the number of correspondence points
the better the estimation accuracy. The same occurs
with the separation of these correspondences, i.e.
correspondence pairs covering 360 degrees and
stretching along the full distance range should be
sought. The transformation model used to match sets
A and B is based in a reference system given in polar
co-ordinates (due to the nature of the radar scanning)
and the actual transformations produce non-rigid
displacements of the objects in the image, so their
shape is distorted.
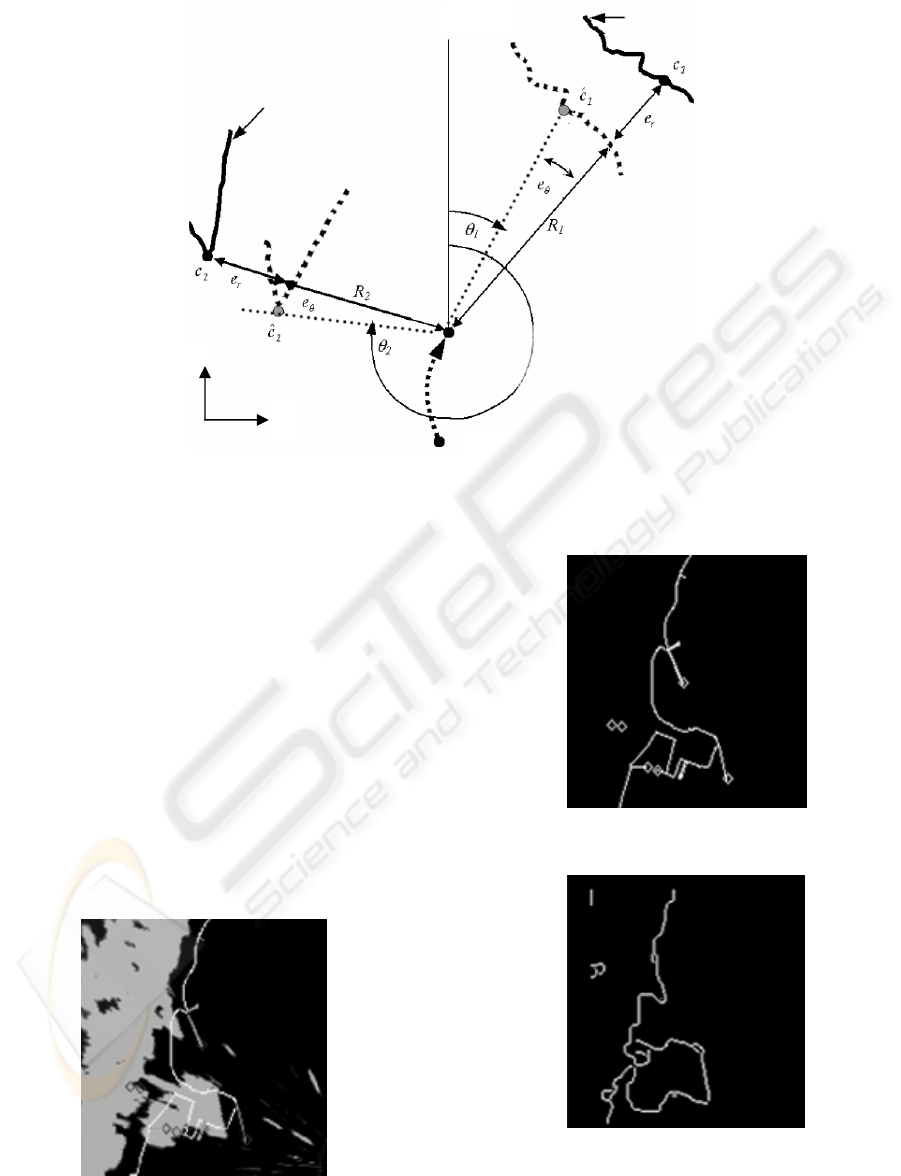
For a given point in the radar image, the
measuring model is:
ppiriip
neeeRc ++
+
+
=
)cos()(
θ
θ
qqiriiq
neesineRc ++++= )()(
θ
θ
(6)
where
i
R and
i
θ
are the polar co-ordinates of the
point c
i
whose origin is given by the ship co-
ordinates e
p
and e
q
. Zero-mean Gaussian noise n
p
and n
q
are added to account for the errors in
measuring correspondences in the radar scan image
and they can be influenced by clutter, occlusions or
broad radar pulses.
As figure 4 shows,
i
R and
i
θ
define each of the
correspondence pairs. Variables
r
e and
θ
e , in turn,
are common to all points selected for matching and
they describe the errors in measurements caused by
biases in range and bearing respectively. The
orientation variable
θ
e describes the rotation that
suffers the radar image due to disturbances such as
misalignments in the position sensors of the antenna
(encoders, synchros, etc.), antenna boresight and the
a) model
b
) image
c) multiple solutions
MAP-MATCHING OF RADAR IMAGES AND ELECTRONIC CHARTS USING THE HAUSDORFF DISTANCE
97
azimuth error generated by the local level reference
frame.
Notice the difference between point
i
c , from the
radar echo and the one from the chart
i
c
ˆ
.
In order to show the behaviour of the HD technique,
an example was carried out with radar data collected
from a navigation console. An area of 163 x 170
pixels is processed (see figure 5.a) where the grey
zone is the radar echo and the brighter lines
correspond to the electronic chart. A notorious miss-
match exists between both sets of data. Figure 5.b
shows the hydrographic data and figure 5.c the
segmented radar image after applying the edge
detector. Finally, figure 5.d shows the matching of
the two sets after applying the optimal
transformation found by the method.
5.a) Zone of interest: radar image and electronic chart
5.b) Electronic chart
5.c) Segmented radar image using edge detector
p
q
translation
(e
p
,e
q
)
initial
p
osition
(
0,0
)
Fi
g
ure 4: Transformation model.
north rada
r
echo
rada
r
echo
ICINCO 2004 - SIGNAL PROCESSING, SYSTEMS MODELING AND CONTROL
98
5.d) Final matching
Figure 5: The different stages in the method
Table 1 contains the values for the optimum
transformation. The value found for the Partial
Hausdorff Distance is 11 pixels for k=90%, i.e.
every point in the radar image considered in the
calculations is at most, at a distance of 11 pixels
from its corresponding point in the electronic chart.
Table 1: Optimum transformation values
r
e 5.0 pixels
θ
e 3.0 degrees
e
p
17.0 pixels
e
q
-2.0 pixels
Table 2 shows the improvements obtained in the
matching. H
o
corresponds to the HD before the
optimum transformation has been applied. H is the
HD when the modified version of the algorithm is
applied. Notice the significant improvement
obtained in the number of points existing in the
range from 0 to 5 pixels (increase of 135%). The HD
is also reduced significantly (38%) and the HD
average drops by 45%.
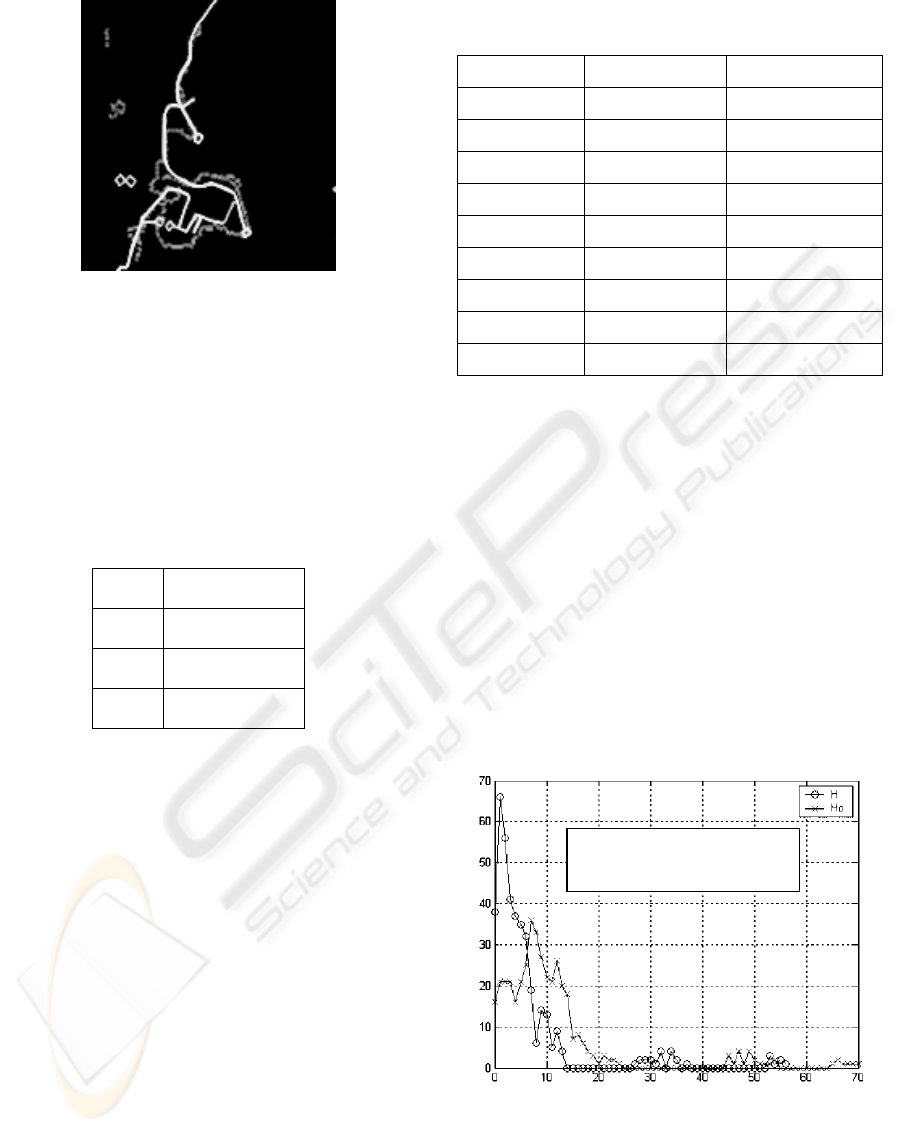
Figure 6 shows a distribution graph for the points
with correspondences. The curve for the initial HD
(H
o
, crosses marks) contains less points in the left
side of the graphic than the modified HD proposed
in this paper (H, circle marks).
Table 2: Comparison of initial situation (H
o
) and after
transformation (H)
Initial (H
o
) Final (H)
d = 0 pixels 16 points 38 points
d = 1 pixel 21 points 66 points
d = 2 pixels 21 points 56 points
d = 3 pixels 21 points 41 points
d = 4 pixels 16 points 37 points
d = 5 pixels 21 points 35 points
d
≤
5 pixels 116 points 273 points
HD (k=90%) 18 pixels 11 pixels
HD average 11.24 pixels 6.10 pixels
The example shown above must be accompanied
by at least one other zone of search for
correspondence in order to achieve observability
when estimating radar biases (Guesalaga, 2003). In
this test, three zones are used.
Figure 7 shows the initial situation for the
complete scan of the radar. A miss-match between
the radar image and chart is clearly caused not only
by linear translations but also by rotation, and a less
evident range deformation. After applying the
estimation technique described in this paper for the
three zones shown in the figure, which in turn feed
the Extended Kalman Filter described in Guesalaga
(2003) for a sequence of 50 radar scans, the
optimum transformation is found and the result is
presented in figure 8.
Figure 6: Hausdorff Distance distribution of corresponding
points
Distribution of
corresponding points
distance [pixels]
MAP-MATCHING OF RADAR IMAGES AND ELECTRONIC CHARTS USING THE HAUSDORFF DISTANCE
99
Figure 7: Initial situation
Figure 8: Final matching after optimum transformation
3 CONCLUSIONS
An extended version of the Hausdorff Distance
algorithm has been successfully applied to map-
matching of radar images and electronic charts.
The method allows to correlate radar images and
hydrographic charts automatically in order to detect
calibration errors in radar surveillance systems and
correct them accordingly.
Several modifications have been introduced to the
standard HD algorithm showing an excellent
performance in terms of reductions in HD and
greater number of corresponding points in the model
being closer to their equivalent points in the image
set. Indices such as the actual HD, its average and
the number of points at distances of less than 5
pixels, showed significant improvements of over
30%, making the proposed technique a very
attractive tool for the problem of radar calibration
and map-matching.
A critical parameter that needs to be tuned is the
k ratio, which shortens the sorted list of points in the
original image in order to reject false-positive
points. This action showed to improve the matching
substantially and the reduction in the total data to be
processed showed no negative impact on the results.
REFERENCES
Anandan P. ,1989. A computational framework and an
algorithm for the measurement of visual motion. Int.
Journal of Computer Vision. 2:283-312.
Bailey T. ,2001. Electronic chart systems - A bonus or a
curse?, The Hydrographic Journal, 102:39-52.
Borgefors, G.,1986. Distances transformations in digital
images. Computer Graphics Images Processing.
34:344-371.
Breuel, T.M. ,2003. Implementation techniques for
geometric branch-and-bound matching methods
Computer Vision and Image Understanding. 90:258-
294.
Brock-Gunn, S., Ellis, T.J.,1992. Using colour templates
for target identification and tracking. Proc. British
Machine Vision. Conf. pp 207-216. Leeds, UK.
Fredriksson, K., Navarro, G. and Ukkonen, E.,2002.
Optimal Exact and Fast Approximate Two
Dimensional Pattern Matching Allowing Rotations.
Proc. of the 13th Annual Symposium on
Combinatorial Pattern Matching. pp 235-248.
Fukuola, Japan.
Gonzales, R., and Woods, R.E.,1993. Digital Image
Processing. Addison-Wesley Publishing Company,
Reading, Massachussets. 2nd. edition
Guesalaga, A.R.,2003. Estimation of Radar Range and
Bearing Biases using Electronic Charts. Proceedings
zone 2
zone 1
zone 3
ICINCO 2004 - SIGNAL PROCESSING, SYSTEMS MODELING AND CONTROL
100

of the SPIE-Aerosense Conference, 5084-19, Orlando,
FL.
Hall D.L., Garga, A.,1999. Pitfalls in data fusion (and how
to avoid them). Proceedings of 2nd Int. Conf. on
Information Fusion, Sunnyvale, CA, July 1999, 1:429-
436.
Huttenlocher, D.P., Kedem, K., and Kleinberg, J.M.,1992.
Dynamic Voronoi diagrams and the minimum
Hausdorff distance for point sets under Euclidean
motion in the plane. Proc. 8th Annu. ACM Sympos.
Comput. Geom. pp 110-120 .
IHO, 2000. Transfer Standard for Digital Hydrographic
Data, Special Publication #57, edition 3.1, Published
by the International Hydrographic Bureau, Monaco.
Prokopowicz, P.N., Swain, M.J. and Kahn, R.E.,1994.
Task and environment-sensitive tracking, Proc.
Workshop on Visual Behaviors. pp 73-78, Seattle,
USA.
Rucklidge, W.J.,1977. Efficient Visual Recognition Using
the Hausdorff Distance. Int. Journal of Computer
Vision. 24:251-270.
Sim, D.G. and Park, R.H.,2001. Two-Dimensional Object
Alignment Based on Robust Oriented Hausdorff
Similarity Meansure. IEEE Transactions on Image
Processing. 10:475-483.
Taylor D.W.,2003. Local area navigation: a tool for GPS-
denied geolocation, Proceedings of the SPIE-
Aerosense Conference, 5084-19, Orlando, FL
Wilson R.C., Evans A.N., Hancock E.R.,1995. Relational
Matching by Discrete Relaxation, Image and Vision
Computing, 13:411-421.
Worrall, R.F., Sullivan, and Baker, K.D.,1991. Model-
based tracking. Proc. British Machine Vision. Conf.
pp 310-318. Glasgow, Scotland.
Yuille, L., Cohen, D.S. and Hallinan P.,1992. Feature
extraction from faces using deformable templates. Int.
Journal of Computer Vision 8:99-112.
MAP-MATCHING OF RADAR IMAGES AND ELECTRONIC CHARTS USING THE HAUSDORFF DISTANCE
101
