
Deep Neural Network for Estimating Value of Quality of Life
in Driving Scenes
Shinji Fukui
1
, Naoki Watanabe
2
, Yuji Iwahori
2
, Pittipol Kantavat
3
, Boonserm Kijsirikul
3
,
Hiroyuki Takeshita
2
, Yoshitsugu Hayashi
2
and Akihiko Okazaki
2
1
Faculty of Education, Aichi University of Education, Hirosawa 1, Igaya, Kariya, Japan
2
Faculty of Engineering, Chubu University, Matsumoto-cho 1200, Kasugai, Japan
3
Faculty of Engineering, Chulalongkorn University, Phayathai Road, Pathumwan, Bangkok 10330, Thailand
pittipol@gmail.com, boonserm.k@chula.ac.th
Keywords:
Quality of Life in Driving Scene, Deep Neural Network, Semantic Segmentation, Multilayer Perceptron.
Abstract:
The purpose of this research is to estimate a value of Quality of Life (QoL) of an image in a driving scene
from only the image. The system suggesting optimal transportation methods and routes from a current place
to a destination has been developed. The QoL value is used for the system. A method to estimate the QoL
value easily is needed. This paper proposes a method for estimating the QoL value of the image. The image
is segmented by a semantic segmentation method based on the Deep Neural Network (DNN). The rates of the
total amount of the object region of each object class to the whole image region are calculated. The rates are
used as indicators for estimating the QoL value. The MultiLayer Perceptron (MLP) learns the relationship
between the QoL value and the rates. The DNN for estimating the QoL value from only the input image is
constructed by connecting the DNN based semantic segmentation model and the MLP. The effectiveness of
the proposed method is demonstrated by the experiments.
1 INTRODUCTION
Thailand has been developing rapidly in recent years.
The country has an idea, called ”Thailand 4.0”, for
growing the country’s economics since 2015. On
the other hand, traffic jam in Bangkok has become
a serious social issue. It wastes time for citizens in
Bangkok. The traffic jam causes problems, such as
global warming and environmental pollution, and de-
grades Quality of Life (QoL). A project (Smart Trans-
port Strategy for Thailand 4.0, 2017) has been being
driven to solve the traffic problem in Thailand. A sys-
tem suggesting optimal transportation methods and
routes from a current place to a destination based on
QoL has been being developed as a part of the project.
QoL of a scene should be quantified to realize such a
system.
Some approaches related to evaluating QoL have
been proposed. Kantavat et al. proposed a method for
extracting the indicators which affect QoL in an im-
age (Kantavat et al., 2019). The method uses the re-
sults of object detection and semantic segmentation.
The method contributes to reducing the cost for col-
lecting data but does not evaluate QoL directly from
the image. Doi et al. advocated the formula for cal-
culating the living QoL (Doi et al., 2008). It used
various indicators for calculating the QoL. It costs to
obtain some indicators. The system suggesting opti-
mal transportation methods and routes needs Indica-
tors that can be obtained easily.
This paper proposes a new method for estimating
the driving QoL value from a car view image. As far
as driving scenes are concerned, the QoL is roughly
determined by the congestion on the road. The pro-
posed method segments the image in the driving scene
by a semantic segmentation method. The rates of the
total amount of the object region of each object class
to the whole image region are obtained and are used
as indicators for estimating the QoL value. The re-
lationship between the indicators and the correspond-
ing QoL values are learned by the MultiLayer Per-
ceptron (MLP). DNN based semantic segmentation
method and the MLP is connected and one DNN for
estimating the QoL value from the input image is con-
structed. The proposed method can obtain the QoL
value of the image from the input image itself. The
transportation suggestion system can use the value
obtained by the proposed method.
616
Fukui, S., Watanabe, N., Iwahori, Y., Kantavat, P., Kijsirikul, B., Takeshita, H., Hayashi, Y. and Okazaki, A.
Deep Neural Network for Estimating Value of Quality of Life in Driving Scenes.
DOI: 10.5220/0010870600003122
In Proceedings of the 11th International Conference on Pattern Recognition Applications and Methods (ICPRAM 2022), pages 616-621
ISBN: 978-989-758-549-4; ISSN: 2184-4313
Copyright
c
2022 by SCITEPRESS – Science and Technology Publications, Lda. All rights reserved

The effectiveness of the proposed method is
demonstrated by experiments using real data.
2 OUTLINE OF PROPOSED
METHOD
The outline of the proposed method is shown as fol-
lows:
Step 1. An input image is segmented by a semantic
segmentation method.
Step 2. The rates of the total amount of the object
region of each object class to the whole image re-
gion is calculated.
Step 3. The QoL value of the image is estimated.
The method assumes the QoL value in a driving
scene depends on on-road objects and objects around
the road. For example, the QoL value goes down
when the traffic is backed up and goes up when the
traffic is low, and the road with good visibility may
increase the QoL value. Based on these facts, it may
be possible to estimate the QoL value if the relation-
ship between the QoL value and objects in the image
is clarified. There are two information of objects in
an image which may be related to the QoL. The one
is the number of objects, and the other is the object
regions. The proposed method tries to relate the QoL
value to the object regions in the image. The rate of
the total amount of the object region to the whole in-
put image region for each object class is calculated.
The proposed method uses them as the indicators of
the relationship between the QoL and the image.
The method segments the input image by a seman-
tic segmentation method at Step 1. At Step 2, the to-
tal amount of object region for each object class is
obtained and the rates of the total amount of object
regions to the whole image region are calculated. Af-
ter that, the QoL value is estimated using the rates at
Step 3.
How to estimate the QoL value of the input image
using the rates is described in the next section.
3 QoL VALUE ESTIMATION BY
RATES OF TOTAL AMOUNT OF
OBJECT REGION FOR EACH
OBJECT CLASS TO WHOLE
IMAGE REGION
The proposed method estimates the QoL value of the
input image by the relationship between the rates of
the total amount of the object region for each object
class and the QoL value. It is possible to estimate the
QoL value from the rates analytically by the multiple
regression analysis. It is assumed that the relationship
between them is not linear. The proposed method uses
the MLP to get better results than those by the multi-
ple regression analysis. MLP can learn the non-linear
relationship and estimate the better QoL value from
the rates than the multiple regression analysis.
The rates are used as the elements of the input vec-
tor to the MLP. The output of the MLP is the QoL
value of the input image. The MLP can learn the re-
lationship using the pairs of such an input vector and
corresponding QoL value. It is needed to determine
the parameters such as the number of nodes of hid-
den layers, optimizer, activation function, and so on.
The proposed method determines them by an empiri-
cal approach.
4 DEEP NEURAL NETWORK
FOR QoL ESTIMATION
Recently, many DNN based semantic segmentation
method with high performance have been proposed.
The DNN to which an image in an urban street scene
is input and its QoL value is output can be constructed
if a semantic segmentation method based on DNN is
used. In this paper, such a DNN is proposed.
The structure of the proposed DNN is shown in
Figure 1.
Semantic Segmentation
Rate Calculation
Input Image
QoL Calculation
QoL Value
Figure 1: Structure of the proposed DNN.
The network consists of three components. The
first component is for semantic segmentation. The
second component is a component for calculating the
rates of the total amount of the object region for each
object class to the whole image region. The third
component is for estimating the QoL value. A DNN
based semantic segmentation method that can seg-
ment an urban street image with high accuracy is used
Deep Neural Network for Estimating Value of Quality of Life in Driving Scenes
617
for the first component. Any segmentation method
which can segment images in urban street scenes with
high accuracy can be used. The semantic segmenta-
tion result is input to the second component and the
rates are output. The second component has a role for
connecting the first component and the third one. The
outputs of the second component are used as the in-
put to the third component. The MLP described in the
previous section is used for the third component.
The image in the driving scene is input to the net-
work and the QoL value of the image is obtained as
the output of the network.
5 EXPERIMENTS
The experiments were done to show the effectiveness
of the proposed method.
The proposed method uses a semantic segmen-
tation method at the first component. Any method
which can obtain results with high accuracy can be
used for the first component. In the experiments,
DeepLabv3+ (Chen et al., 2018) was used because
it can obtain good segmentation results with high
speed. The DeepLabv3+ model pre-trained using the
Cityscapes dataset (Cordts et al., 2016) was used as
the first component of the proposed DNN (Tensor-
Flow, 2021). The Cityscapes dataset is a dataset
of urban street scenes. Thirty object classes can be
trained using the dataset. The model was trained us-
ing nineteen classes in thirty classes. The classes
used for training DeepLabv3+ are shown in Table 1.
The output of DeepLabv3+ for a pixel of an image is
a nineteen-dimensional vector. Each element of the
output vector is the probability that the pixel belongs
to the object class. At the second component of the
proposed DNN, the object class to which each pixel
belongs is decided by obtaining the maximum value
among the elements of the corresponding output vec-
tor from DeepLabv3+, the pixels belonging to each
object class are counted, and the number of pixels for
each object class is divided by the number of pixels of
the input image. The results are used as the elements
of the input vector to the third component.
Table 1: Nineteen object classes used in the experiments.
road poll sky bus
sidewalk traffic light person train
building traffic sign rider motorcycle
wall vegetation car bicycle
fence terrain truck
First of all, a dataset (QoL-Dataset) was con-
structed for the training of the MLP and the evalua-
tion of the results. 355 images in some driving scenes
were collected and the QoL value was given to each
image by a person. The resolution of each image
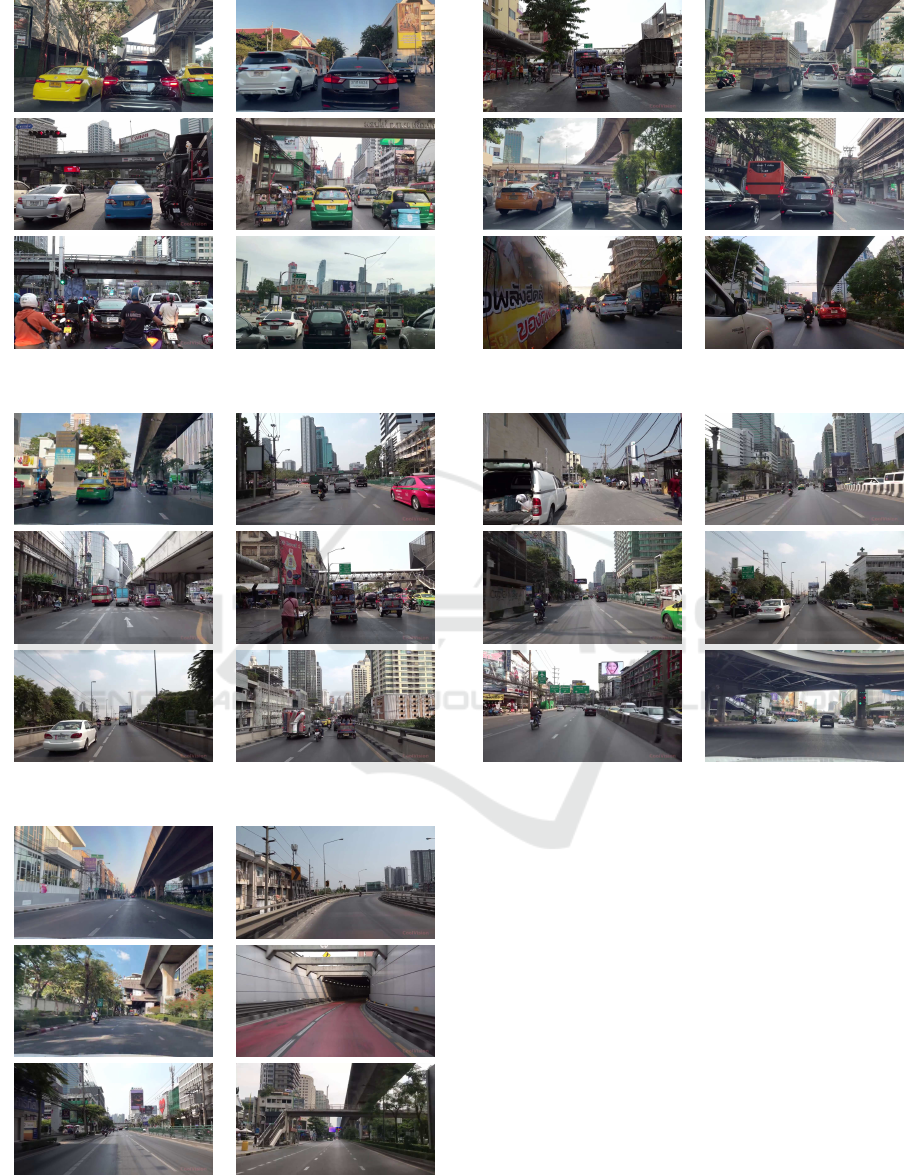
was 1280x720. The examples of images of each QoL
value are shown in Figure 2.
Next, the experiments for obtaining better MLP
used for the third component of the proposed DNN
were done. In the experiments, the number of hid-
den layers, the number of epochs, the batch size and
the loss function were fixed to 3, 100, 4 and the Mean
Squared Error loss function, respectively. Under these
conditions, the best combination of the number of
nodes of each hidden layer, the optimizer and the acti-
vation function was determined. The number of nodes
of each hidden layer was selected in 10, 20, 30, 40 and
50. The optimizer was selected in RMSprop (Tijmen
and Hinton, 2012), Adam (Kingma and Ba, 2015) and
Nadam (Dozat, 2016). The activation function was
selected in ReLU (Nair and Hinton, 2010) and Mish
(Misra, 2019).
The training of the MLPs with different combina-
tions of the number of nodes of each hidden layer,
the optimizer and the activation function was done
using QoL-Dataset. The images of the dataset were
segmented by DeepLabv3+ and the rates of the total
amount of the object region for each object class to the
whole image region were calculated. The results and
the corresponding QoL values were used for training
the MLPs. The accuracy of the MLPs was calculated
by 10 fold cross-validation and the best MLP was ob-
tained. Mean Absolute Error (MAE) is used as the
accuracy indicator.
The results are shown Table 2. The MLP with 40
nodes in each hidden layer, Adam as the optimizer
and ReLU as the activation function obtains the best
result. The MAE was 0.42. The result shows that
the MLP can learn the relationship between the QoL
value and the rates. After obtaining the MLP, the
experiments using the proposed DNN with the MLP
were done using the same data and in the same way. It
is confirmed that the same results could be obtained.
The examples of the results are shown in Figure 3.
The results show that the proposed DNN can obtain
the QoL value from the input image in the driving
scene.
The experiments for estimating the QoL values by
the multiple regression analysis were done to compare
with the results of the proposed method. The average
of MAEs of 10 fold cross-validation was 0.563. The
result shows that the proposed MLP can obtain better
results than the multiple regression analysis.
At last, the experiments using fewer classes than
ICPRAM 2022 - 11th International Conference on Pattern Recognition Applications and Methods
618
(a) (b)
(c) (d)
(e)
Figure 2: Image examples in QoL-Dataset. These are retrieved from (J Utah, 2019; REAL THAILAND 4K, 2021). The QoL
values of the images are as follows: (a) 1, (b) 2, (c) 3, (d) 4, and (e) 5.
Deep Neural Network for Estimating Value of Quality of Life in Driving Scenes
619
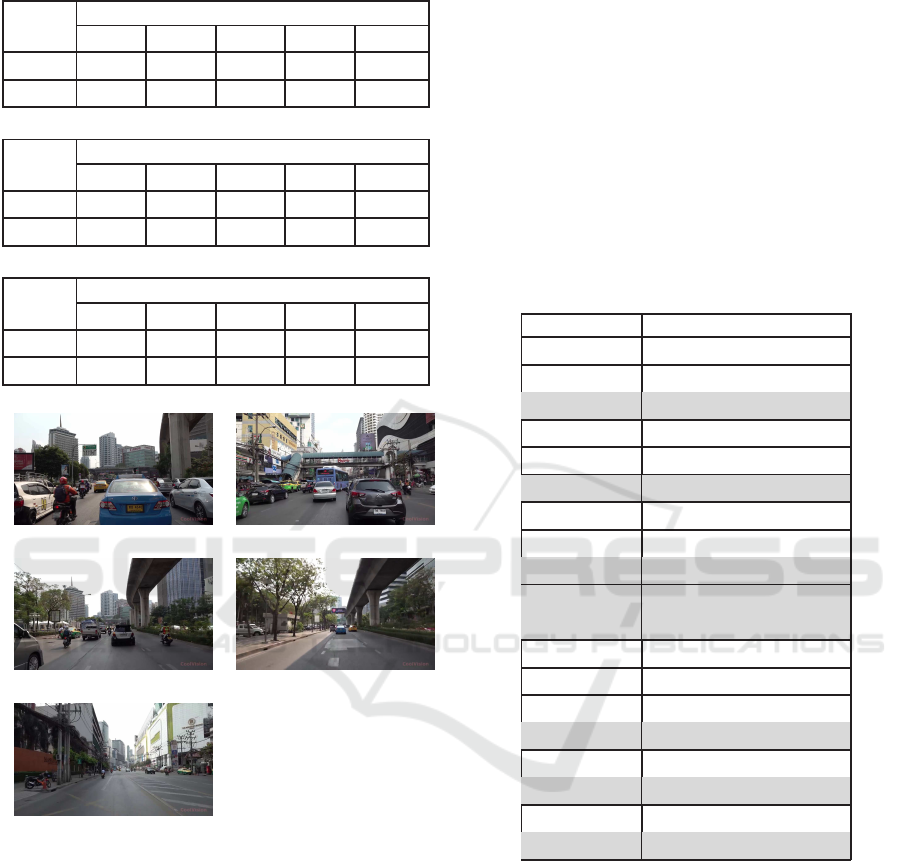
Table 2: Experimental results.
RMSProp
Number of Nodes
10 20 30 40 50
ReLU 0.640 0.540 0.508 0.552 0.536
Mish 0.471 0.490 0.456 0.532 0.513
Adam
Number of Nodes
10 20 30 40 50
ReLU 0.537 0.496 0.465 0.436 0.420
Mish 0.475 0.513 0.494 0.460 0.452
NAdam
Number of Nodes
10 20 30 40 50
ReLU 0.551 0.493 0.478 0.435 0.481
Mish 0.480 0.512 0.505 0.463 0.519
0.994 2.260
3.081 3.983
4.949
Figure 3: Examples of results. The images are retrieved
from (CoolVision, 2019). QoL-Dataset includes the images
from the video, but the training data did not include the im-
ages shown in this figure. The value shown below the each
image means QoL estimated by the proposed DNN.
the nineteen classes were done. It is thought that
some object classes in the dataset affect the QoL
value greatly, but some classes may have little impact
on the QoL. There is some possibility that similar
results may be obtained even though the rates affect-
ing the QoL value little are removed from the input
vector to the MLP. If so, the experiments can show
factors influencing to the QoL value in driving scenes.
The correlation coefficients were used for remov-
ing the elements with little impact on the QoL value
of the input vector. The correlation coefficients be-
tween the QoL value and the rates were calculated us-
ing the learning data. The rates with 0.2 or more cor-
relation coefficients were used as the elements of the
vector input to the third component of the proposed
DNN. The correlation coefficients are shown in Table
3. From the relusts, eleven object classes, which are
road, sidewalk, wall, fence, traffic light, traffic sign,
person, rider, car, bus, and motorcycle, were selected.
Table 3: Correlation coefficients between the QoL value and
the rates of total amount of the object regions of each object
class to the whole image region. The rows for the object
classes which were not used are painted gray.
Class Name
Correlation Coefficient
road 0.797650
sidewalk 0.319872
building -0.074482
wall 0.357613
fence 0.215652
poll 0.107258
traffic light -0.204180
traffic sign -0.226736
vegetation 0.030233
terrain 0.198933
sky 0.149479
person -0.264874
rider -0.330346
car -0.827175
truck -0.101751
bus -0.202952
train -0.013588
motorcycle -0.295283
bicycle -0.078920
The experiments used the same data used in the
above experiments and were done in the same man-
ner as the above experiments. The results of the ex-
periments are shown in Table 4. The table shows that
similar results are obtained eventhough the number of
classes used for estimating the QoL value is reduced.
The results show the factors that influenced the QoL
value of the image in the driving scene significantly.
On the other hand, trucks and trains were not used in
the experiments. It is thought that they affect the QoL
value. The reason may be that QoL-Dataset does not
include those images enough. The number of data in
QoL-Dataset should be increased.
ICPRAM 2022 - 11th International Conference on Pattern Recognition Applications and Methods
620
Table 4: Experimental Results using selected classes.
RMSProp
Number of Nodes
10 20 30 40 50
ReLU 0.575 0.514 0.560 0.538 0.550
Mish 0.458 0.478 0.517 0.536 0.523
Adam
Number of Nodes
10 20 30 40 50
ReLU 0.519 0.455 0.464 0.442 0.468
Mish 0.452 0.451 0.450 0.426 0.450
NAdam
Number of Nodes
10 20 30 40 50
ReLU 0.541 0.497 0.428 0.416 0.417
Mish 0.466 0.487 0.433 0.422 0.429
6 CONCLUSIONS
This paper proposed a new approach for estimating
the QoL value of input images in driving scenes. The
proposed method used the rates of the total amount
of the object region of each object class to the whole
image region as the indicators for estimating the QoL
value. One DNN for obtaining the QoL value was
constructed. An image in a driving scene was input to
the DNN and the DNN output the QoL value of the
image. The effectiveness of the DNN was shown by
the experiments using real data.
In the present situation, the QoL-Dataset is small.
The image data which are taken in the various situ-
ations should be added to the dataset. The accuracy
of the proposed method should be higher. The struc-
ture of the network should be improved to obrain the
higher accuracy. These remain as future work.
ACKNOWLEDGEMENTS
This research is supported by SATREPS Project of
JST and JICA: Smart Transport Strategy for Thailand
4.0 Realizing better quality of life and low-carbon
society, by Japan Society for the Promotion of Sci-
ence (JSPS) Grant-in-Aid for Scientific Research (C)
(20K11873) and by Chubu University Grant.
REFERENCES
Chen, L. C., Zhu, Y., Papandreou, G., Schroff, F., and
Adam, H. (2018). Encoder-decoder with atrous sep-
arable convolution for semantic image segmentation.
In ECCV 2018.
CoolVision (2019). Driving in bangkok thailand 4k. Re-
trieved March 30, 2021, from YouTube:https://www.
youtube.com/watch?v=z
75WCC-2jk.
Cordts, M., Omran, M., Ramos, S., Rehfeld, T., Enzweiler,
M., Benenson, R., Franke, U., Roth, S., and Schiele,
B. (2016). The cityscapes dataset for semantic urban
scene understanding. In Proc. of the IEEE Conference
on Computer Vision and Pattern Recognition (CVPR).
Doi, K., Kii, M., and Nakanishi, H. (2008). An integrated
evaluation method of accessibility, quality of life, and
social interaction. In Environment and Planning B:
Planning and Design 2008, volume 35, pages 1098–
1116.
Dozat, T. (2016). Incorporating nesterov momentum into
adam. In 4th International Conference on Learning
Representations, Workshop Track.
J Utah (2019). Bangkok 4k - driving downtown
- world’s #1 visited city. Retrieved March
30, 2021, from YouTube:https://www.youtube.com/
watch?v=4BmxX6Ipxpo.
Kantavat, P., Kijsirikul, B., Iwahori, Y., Hayashi, Y., Pan-
boonyuen, T., Vateekul, P., and Achariyaviriya, W.
(2019). Transportation mobility factor extraction us-
ing image recognition techniques. In 2019 First In-
ternational Conference on Smart Technology Urban
Development, pages 1–7.
Kingma, D. P. and Ba, J. L. (2015). Adam: a method for
stochastic optimization. In International Conference
on Learning Representations, pages 1–13.
Misra, D. (2019). Mish: A self regularized non-
monotonic activation function. In arXiv preprint
arXiv:1908.08681.
Nair, V. and Hinton, G. (2010). Rectified linear units im-
prove restricted boltzmann machines. In ICML.
REAL THAILAND 4K (2021). (4k)driving in down-
town bangkok thailand (jan.2021). Retrieved March
30, 2021, from YouTube:https://www.youtube.com/
watch?v=EVVdKIKjde8.
Smart Transport Strategy for Thailand 4.0 (2017). Retrieved
October 24, 2021, from https://thailand40.prsvr.net/
en/.
TensorFlow (2021). Deeplabv3+ model. Re-
trieved December 21, 2021, from Tensorflow
web site:http://download.tensorflow.org/models/
deeplabv3
cityscapes train 2018 02 06.tar.gz.
Tijmen, T. and Hinton, G. (2012). Lecture 6.5-rmsprop:
Divide the gradient by a running average of its recent
magnitude.
Deep Neural Network for Estimating Value of Quality of Life in Driving Scenes
621
