
Air Quality Monitoring and Alerting System to Help in Reducing
Asthma Attack in Asthmatic Children
Khawla Alzoubi
1,2
, Manal Al-bzoor
3
, Omar Aljalahma
1
and Mohamed Ali
1
1
Qatar University, Doha, Qatar
2
Community College of Qatar, Doha, Qatar
3
Yarmouk University, Irbid, Jordan
Keywords: Asthma Attack, Air-quality, Alerting Subsystem, Bluetooth, Environmental Factors, Monitoring Subsystem.
Abstract: Asthma attack is one of the most common emergency cases seen in hospitals. It can be dramatically triggered
by environmental factors such as air pollution, temperature and humidity. In this paper, we developed a system
to avoid asthma attacks, especially for children, by informing parents about the air quality conditions. Our
developed prototype system consists of two main subsystems that communicate wirelessly. The first
subsystem is an Air-Quality Sensing Subsystem, and the second subsystem is a mobile phone application.
The Air-Quality Sensing Subsystem (AQSS) collects data from surrounding environment about the air-quality
using different sensors that measure the main environmental factors (temperature, humidity, dust, and Carbon
Monoxide (CO)) that trigger asthma attack in our region (Qatar). This subsystem processes the collected data
and decides whether the air-quality is safe for asthmatic children. The processed data along with alerting
messages are sent to the smart-phone app wirelessly using Bluetooth technology. The Smart-phone app shows
the measured air-quality factors as well as sends a message to inform the parents if the air-quality outside is
safe for their asthmatic children or not. Accordingly, parents can take precautions to protect their asthmatic
children from having asthma attack. This would help in stabilizing the health condition of asthmatic
children/person and avoid costly hospitalization procedures.
1 INTRODUCTION
Asthma is a chronic disease in respiratory system
associated with the airway. Asthma is a Greek word
that refers to the difficulty of breathing. The triggers
of this disease are different in adults, children’s, and
vary in relations to gender. (Guarnieri et al, 2015).
The real causes of asthma are not fully understood.
The causes are combined of both genetic and non-
genetic factors. The causes include chronic obstructive
pulmonary, bronchitis, chronic sinusitis, respiratory
infections and heart disease. According to the Global
Asthma Report 2018, asthma is estimated to affect as
many as 339 million people around the world.
However, deaths of asthma were estimated to be 1000
people per day, most commonly in poor countries.
Asthma attack leads to tightening the muscles
around the airways, causing some dangerous
symptoms to the patient. The known symptoms of
asthma attack are wheezing, dyspnoea, chest
tightness, cough, weak exercising, changes in lung
function, and trouble sleeping (Holgate, 2010). Many
factors affect asthmatic people, and can trigger their
asthma if these factors exceed specific values and
limits. These factors can result from weather
conditions (Humidity, heat, dust, cold), air pollution
(chemical gases), and other sources (pet dander,
pollen and mold, food, and drugs).
Managing asthma is the best way to avoid asthma
attack and its consequences. Asthma has no cure;
hence, the only way to reduce its effects is by following
these steps in sequence: First, controlling asthma with
medications and using the flow meter to prevent the
symptoms by allowing Oxygen to enter the airways
and help maintain good lung function. Second,
working with doctors to treat other diseases that can
trigger asthma attack. Third, avoiding factors that
could trigger asthma attack (Haughney et. al, 2020).
Environmental factors may result from weather
conditions and air-pollution. Air could be poluted by
Ozone (O3), Sulphuric Dioxide (SO2), Carbon
Monoxide (CO), oxides of nitrogen (NO, NO2), and
Carbon Dioxide (CO2) (Diette et. al, 2008). Ozone
gas has a serious effect on asthmatic people. In Qatar
Alzoubi, K., Al-bzoor, M., Aljalahma, O. and Ali, M.
Air Quality Monitoring and Alerting System to Help in Reducing Asthma Attack in Asthmatic Children.
DOI: 10.5220/0009971200910098
In Proceedings of the 14th International Joint Conference on Biomedical Engineering Systems and Technologies (BIOSTEC 2021) - Volume 1: BIODEVICES, pages 91-98
ISBN: 978-989-758-490-9
Copyright
c
2021 by SCITEPRESS – Science and Technology Publications, Lda. All rights reserved
91

specifically, air-pollution with greenhouse gases and
toxic gases emissions generated by vehicles and
factories may have a serious impact on asthmatic
patients. Furthermore, dust and sand in this region
create serious health problems to people with asthma
and respiratory system related diseases. Moreover,
the high levels of temperature and humidity can also
trigger asthma attack as humidity and heat pose a
particular risk as a breeding ground for mold spores,
which contribute to asthma attack (Haughney et. al,
2020).
Asthmatic children, in Qatar, are at a higher risk
from exposure to the aforementioned environmental
factors that trigger asthma attack due to their
immature lung development and their weak and
sensitive bodies. Therefore, this project aims to
develop an air-quality monitoring and alerting system
to monitor the most environmental factors that would
trigger asthma attack in asthmatic children in Qatar
and other regions that have similar circumstances.
This project will equip parents with a mechanism to
check the outdoor air-quality in a specific region and
alert them if any of the environmental factors exceed
the safe standards. These safe standards are decided
based on the reported values and ranges of dangerous
level of the enviromental parameters in previous
studies. These levels will be presented in this work.
Recently, monitoring Air-quality has been
explored by many researchers in the aim to measure
the air-quality in-doors and out-doors for health and
safety issues. A research group in Qatar was designed
and implemented a system to measure the indoor and
outdoor air quality (Alassi et al. , 2016). In their work,
they developed a system to measure and monitor the
environmental harmless gases such as Carbon dioxide
(CO2), nitrous oxide (N2O), and methane (CH4). In
addition, they focused on the nature parameters such
as dust, temperature and humidity. The data was
collected by a sensor node, which communicates
wirelessly using IEEE 802.15.4 protocol with a host
computer that receives the collected measurements,
processes them, and shows them using the LabVIEW
software (Alassi et al. , 2016). In their work, they only
monitored the air-quality without providing a
mechanism for alerts on the air-quality. Their system
was general system that monitors air-quality without
considering asthmatic patients and children.
Another research group (Lal and Kulkarni, 2016)
developed a prototype for a system to monitor air-
quality to measure factors that might trigger asthma
attack. Their system consists of PIC microcontroller
and different sensors such as temperature, humidity
and gas sensor that sense Carbon Monoxide,
Hydrogen, Oxygen and alcohol vapor. The developed
prototype system was capable of showing the
measured gases on an LCD as well as sending these
measurements wirelessly using ZigBee to a database
for further analysis. Their system was capable of
measuring just two quanties, the ozone level and the
dust particles.
Plume Air application (Betts, 2020b) was made
for the people who want to adjust their outdoor
activity according to air quality. The application has
a simple GUI that is easy to use which ensures the
user can do outdoor activates such as exercising. The
screen shows the state of the air quality index.
Furthermore, the application can use statistical data to
inform the user of the best day to go out within a
week. Plume also offers a social image tool, periodic
alerts, and map comparing the air quality in different
areas. This application cannot be used in all regions
as it just provides information about the air-quality in
specific areas. This mobile app and other similar
mobile apps give general information about the air-
quality without considering asthmatic patients and
asthmatic children (AIR MENTOR, 2019).
To address the shortcoming in the previous
reported works, this paper presents the development
of a portable wireless air-quality sensing unit, and a
mobile application to display the air-quality data and
inform the parents of any environmental risk that
would trigger asthma attack for their asthmatic
children.
The rest of this paper is organized into four
sections. Section two discusses the system design.
Section three presents the process of selecting the
usensors and components,and implementing the
system. Section four discusses the whole system
testing and packing. Finaly, section four concludes our
works and discusses the future extension for this work.
2 SYSTEM ANALYSIS AND
DESIGN METHODOLOGY
To develop the proposed solution, a portable air-
quality sensing unit, and a mobile application should
be designed and implemented. As our system should
be portable, thus parents can carry it anywhere and
check the air-quality outdoor before letting their
children to go to that region or area. The system
should be equipped with the sensors that can measure
the riskier environmental factors that would trigger
asthma attack in asthmatic children.
Based on our analysis and studies of the most
environmental factors that would trigger asthma
BIODEVICES 2021 - 14th International Conference on Biomedical Electronics and Devices
92
attack in our region, we have decided to equip the air-
quality sensing unit with the following sensors:
1) Temperature sensor to measure the temperature as
the high level of temperature in Qatar is one of the
main factors that triggers asthma attack in
children.
2) Humidity sensor to measure the level of humidity
as the high level of humidity affects the asthmatic
children. And high level of temperature leads to
increase the humidity level.
3) Carbon Monoxide(CO) sensor to measure CO gas
as it is one of the most common gases that affect
asthmatic children in Qatar.
4) Dust sensor to measure the size of the dust. As
Qatar is located in desert region its location made
the country exposed to frequent dust storms that
are full of dust particles which highly trigger the
asthma attack in asthmatic children.
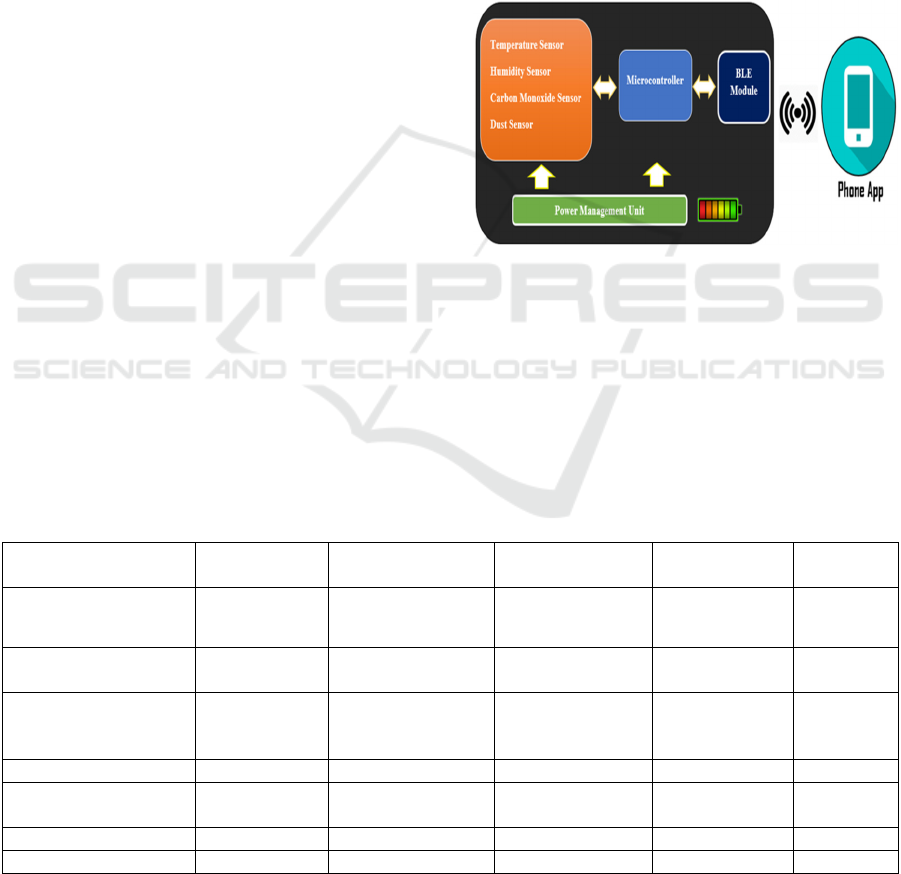
The design of whole system is shown in Figure1.
The Air-Quality Sensing unit consists of the sensors,
Microcontroller unit, power management unit,
Wireless Bluetooth module. Sensors measure the
physical environmental factors from surrounding and
convert them to readable measurements that can be
handled by Microcontroller unit (MCU). The MCU
reads, collects, and manipulates the sensors
measurements to make decision about the air quality
condition. A Power Management Unit(PMU) is used
for charging/discharging the battery that power the
system.
The mobile app is a user friendly app shows the
parents the air-quality of the surrounding, and alarms
them if any of the environmental factors that trigger
asthma exceeds its safety level for asthmatic children.
As everybody has a smart mobile these days, parents
can install this app in their smart-phone and connect
it with Air-quality Sensing unit. To enable parents to
use our system as standalone system, in case if they
do not like to see details information, the air-quality
Sensing unit will be equipped with a RED LED and
GREEN LED. If any of the environmental factors
exceeds its safety level, only the RED LED will turn
The Bluetooth module is used to send wirelessly the
manipulated sensors measurements and decision
about the air-quality to the mobile app.
A Bluetooth Low Energy (BLE) module to save
power.
ON, and if the Air-quality is safe for asthmatic
children the GREEN LED only will turn ON.
Figure 1: System Design. Block Diagram.
The ranges of asthma triggering parameters are
not determined yet in literature. We have searched the
literature and different resources about the ranges of
environmental factors according international health
organizations (‘High and low humidity not good for
asthma - Minimizing Triggers – Asthma, 2019). The
collected data about the safe ranges (low, medium,
high) and danger ranges are summarized in Table 1.
Table 1: Range of Environmental Parameters.
Parameter Low level (safe) Medium level High level
Dangerous level
(alert)
Unit
Temperature (Vann,
Madeline R., et al, 2012)
30 - 34
35 -39
29 - 20
40 – 48
19 - 10
>48 or < 10 Celsius
Humidity (| (Bottrell,
2009)
30 – 40
41 – 49
29– 20
50 – 60
19 – 15
> 60 or < 15 %
Dust (Airveda team,
2017)
PM 1: 0-5
PM 2.5: 0-30
PM 10: 0-50
PM 1: 6-10
PM 2.5: 31-60
PM 10: 51-100
PM 1: 11-21
PM 2.5: 61-90
PM 10: 101-250
PM 1: >21
PM2.5: >91
PM10: >251
µg/m
3
CO (Kidde, 2018) 0 – 50 51 – 100 100 – 400 > 400 PPM
NO
2
(E Instruments,
2018)
0 – 0.1 0.2 – 5 6 – 10 >10 PPM
NO (E Instruments, 2018) 0 – 50 51 – 150 151 – 200 201 – 700 PPM
O
3
(CATA, 2018) 0 – 0.075 0.076 – 0.095 0.096 – 0.374 More than 0.374 PPM
Air Quality Monitoring and Alerting System to Help in Reducing Asthma Attack in Asthmatic Children
93

The ranges in this table are used as the reference
in this work. Thus, our system can decide and inform
the parents if the air quality outside is safe or not for
their asthmatic children. As all the available collected
information about the safety of these factors for
normal person, we would consider in our work that
even late medium and high level as a dangerous level
for asthmatic children as their lung system is more
sensitive and their bodies are weak.
3 SYSTEM IMPLEMENTATIONS
To implement the Air Quality Monitoring and
Alerting System, each subsystem has to be
implemented separately. We started our work by
implementing the Air-Quality Sensing Subsystem,
and then we implemented the Mobile Application
Subsystem. In the following subsections, the
implementation of each subsystem is demonstrated.
3.1 Air-quality Sensing Subsystem
To implement this subsystem, sensors’ modules,
MCU, BLE module, and PMU were selected
carefully considering the system requirements and
constraints. The Mbed LPC1768 MCU is used as it
has many peripherals which enable it to be capable of
reading analogue and digital data, communicate
serially with different modules using serial
communication protocols such as UART, SPI, I2C,
PWM and other peripherals’ circuitry. Furthermore it
is a 32-bit MCU running at 96 MHz and has 512 KB
flash memory and 32KB RAM. In this project, for
prototyping, we used the Mbed development board.
Each sensor module that measure the most
environmental factors (Dust, Carbon Monoxide
Sensor, Temperature and Humidity Sensor) is
selected, studied, and interfaced separately with
Mbed MCU.
Dust Sensor. The selected dust sensor module is
PMS5003. This sensor module can detect the small
particles, which hurt the respiratory system for the
asthmatic children. It can be easily interfaced with a
MCU using UART serial communication protocol
(Yong and Haoxin, 2016).
The circuit connection needs two 10kΩ pull-up
resistors. The resistors are used to control the set
level. High level or suspending is normal working
status, while low level is sleeping mode. The sensor
results should appear after 30 second from the wake-
up state and the fan performance. The sensor
measurements ranges are from (0.3~1.0;1.0~2.5;
2.5~10) with a unit of micrometer (μm/m3). The
output is the number of each particles with different
sizes per unit volume. For this sensor, the default
mode is active the power. In this mode, the sensor
starts to send the data to the microcontroller. For the
active mode, it is grouped into two sub-modes, stable
and fast mode. The sub-mode depends on the change
of the concertation as if it is small it will be stable and
if it is big it will be fast mode. The higher the
concentration, the shorter the interval. The required
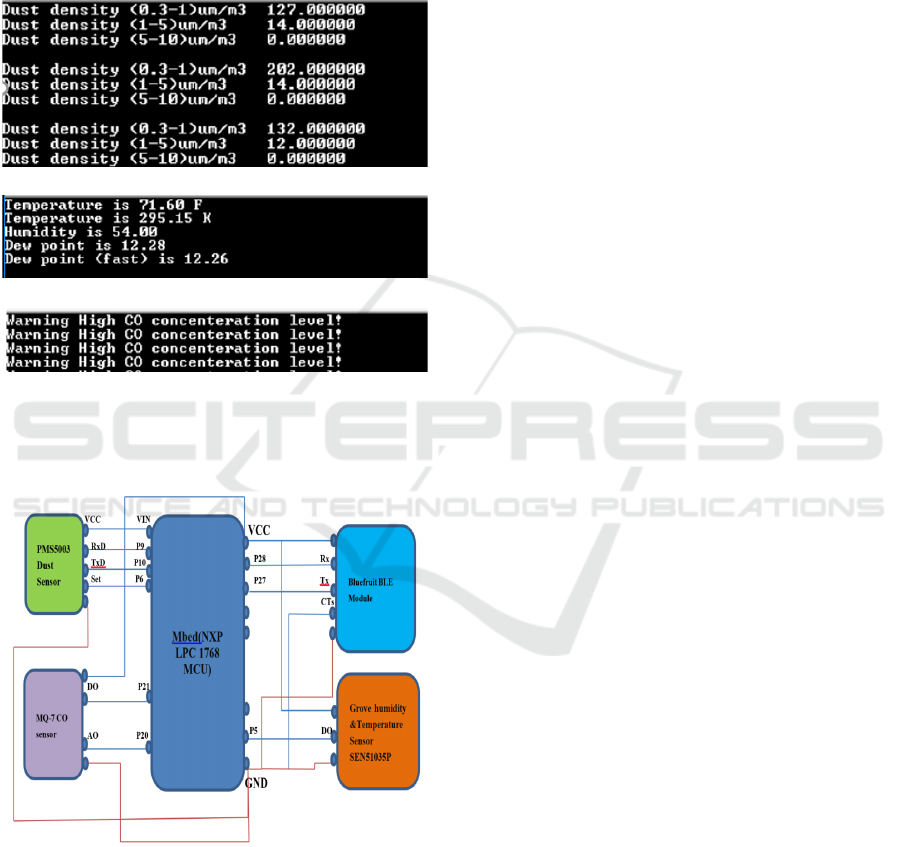
code was written for Mbed MCU to read the sensor
data and test the measurement. The results of testing
the dust sensor shown in Figure 2(a).
Humidity Sensor. The Grove humidity sensor
SEN51035P is used in implementing Air-Quality
Sensing Subsystem. This sensor can measure both
humidity and temperature. It measures humidity in
the percentage range of 20-90% RH, and temperature
in the range of 0-50C degree Celsius. This sensor
provides digital measurements as it has ADC circuity
inside that converts the analogue measurement to
digital data that can be read immediately on a GIOP
pin of MCU. It measures and provides humidity and
temperature values serially over a single wire. This
sensor module is interfaced with Mbed
Microcontroller immediately as it needs just 5V
voltage source and a pull-up resistor that should be
connected with its digital output pin. In Mbed MCU
as its ports are internally connected with pull-up
resistor, this sensor was connected directly without
using external pull-up resistor to streaming the
measurements. The required code was written for
Mbed MCU to read the sensor data and test the
measurements. The results of testing this sensor is
shown in Figure 2(b).
Carbon Monoxide Sensor. The MQ-7 CO sensor
module is used to check if the air is polluted with
Carbon Monoxide or not. This sensor is interfaced
directly with Mbed Microcontroller by connecting the
DO (Digital out pin) to one GIOP port of the Mbed
Microcontroller, and connecting the AO (Analog out
pin) with Analog input port of the Mbed MCU. Two
LEDs are used in this sensor module: Power/
calibration LED and danger LED. When this sensor
is powered and in calibration mode, the first LED
turns ON. During the calibration mode, the user can
adjust the sensitivity of CO sensor using the variable
resistor. In this work, the sensitivity of Carbon
Monoxide sensor was adjusted to exceed the danger
level that would trigger Asthma attack for Children.
When the sensor starts to measure the CO
concentration, and it reaches the adjusted level, the
second LED will turn to indicate that CO
BIODEVICES 2021 - 14th International Conference on Biomedical Electronics and Devices
94
concentration is in the danger level. The sensor can
measure between 20-2000ppm. Thus, this sensor can
detect the danger level that set according to Table1.
The CO sensor was interfaced to the Mbed MCU as
shown in Figure 3. A program for Mbed MCU was
written for calibrating the sensor and streaming its
data. The results of testing this sensor are shown in
Figure 2(c).
(a)
(b)
(c)
Figure 2: Measurements and Testing of a) Dust sensor
PMS5003 b) Grove humidity sensor SEN51035P c) MQ-7
CO Sensor.
Figure 3: Illustrative block diagram for the Air-Quality
Sensor Subsystem.
To enable the Air-Quality Sensing subsystem
(AQSS) to send data wirelessly to the mobile App, a
BLE module is used. The used BLE in this subsystem
is Bluefruit BLE module. This Bluefruit LE is a low
energy and has small footprint size. It can be
interfaced with Mbed MCU using UART serial
communication protocol. The hardware interfacing
between the BLE module and Mbed MCU is
demonstrated in Figure 3. A program for Mbed MCU
was written to test the functionality of the BLE
module.
After interfacing and successfully testing the
functionality of each sensor module and the BLE
module separately, all the modules were interfaced
with Mbed microcontroller as shown in the
illustrative block diagram of Figure 3.
The software part (program) of the AQSS is
developed for Mbed MCU to initialize, calibrate (if
needed), acquire raw data of the sensors, manipulate
data and measurements, make decision, and send
processed data and alarming messages wirelessly
using Bluetooth module to a host computer for
testing. The flowchart for the software part for AQSS
is shown in Figure 4. The program was written using
C++ language in Mbed online development
environment. Thus, this program enables the AQSS
to perform tasks from acquiring sensors’
measurements until sending processed data and
alerting message over the BLE module to the other
subsystem (Mobile App).
3.2 Mobile App Subsystem
To inform parents of asthmatic children about the air-
quality in friendly manner, we designed and
implemented a mobile application that can
communicate with the AQSS using the BLE
technology. App Inventor program for Android was
used to design the application which is an open source
web application provided by Google. The designed
application consists of Graphical User Interface
(GUI) that the user can see, and programming blocks,
which are hidden from the user. The designed GUI
for the App is shown in Figure 5. The background of
the screen was designed to represent the outdoor
environment. To start the application, the user must
click on the scan button that will search for available
BLE devices. The user has to choose the AQSS to
connect with and receive messages from it. After
clicking on Adafruit Bluefruit LE, which is the device
used for this project, the application screen will show
the address of the connected device and a green tick,
indicating the connection is done. A disconnect
option could be used to disconnect the device. Figure
6 shows the GUI of the Mobile App after connecting
with AQSS.
Air Quality Monitoring and Alerting System to Help in Reducing Asthma Attack in Asthmatic Children
95
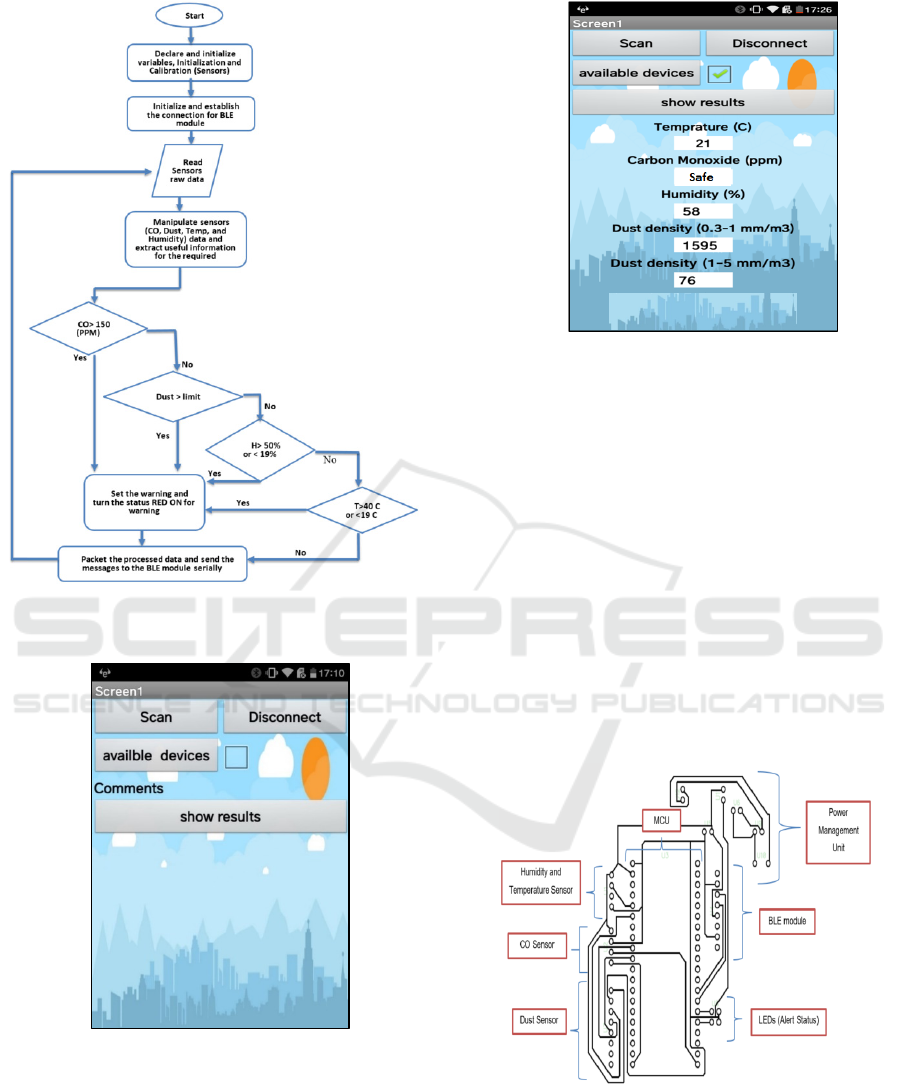
Figure 4: Flowchart for Air-quality Sensing Subsystem
(AQSS).
Figure 5: Start GUI of the mobile App.
Figure 6: GUI of App after connecting with AQSS.
4 SYSTEM INTEGRATION AND
DISCUSSION
For the final presentation, a PCB board was printed,
and all the components of The Air-Quality sensing
subsystem were assembled on it. The PCB for the
sensor’s subsystem was designed using DipTrace
Software. The PCB design is shown in Figure7. In the
designed PCB board, the circuit wiring connections
for PMU were added, and the circuit wiring
connections for two status LEDs (RED and GREEN)
were added. Furthermore, to control turning the Air-
Quality Subsystem ON/OFF, the required wiring
connections were added.
Figure 7: PCB design for the Air-Quality Sensor
Subsystem.
As the AQSS should be portable, the PMU was
interfaced with Mbed MCU and all other modules and
components to manage power the whole AQSS using
rechargeable battery as well as charging the battery.
BIODEVICES 2021 - 14th International Conference on Biomedical Electronics and Devices
96
The battery-life for (AQSS) was also calculated for
different scenarios. It was found that the battery-life
(68000 mAh) is 12 hours if this system works
continuously. To prolong the battery-life of this
system, a switch was added to turn it ON/OFF. Thus,
the system can run for longer time before it needs to
be recharged. Moreover, to make this system capable
of informing the parent if the air-quality is safe or not
for their asthmatic children with using mobile app,
alert status LEDs were added which will turn green
LED on when the air quality is in good level and turn
red LED on when the air quality is dangerous for
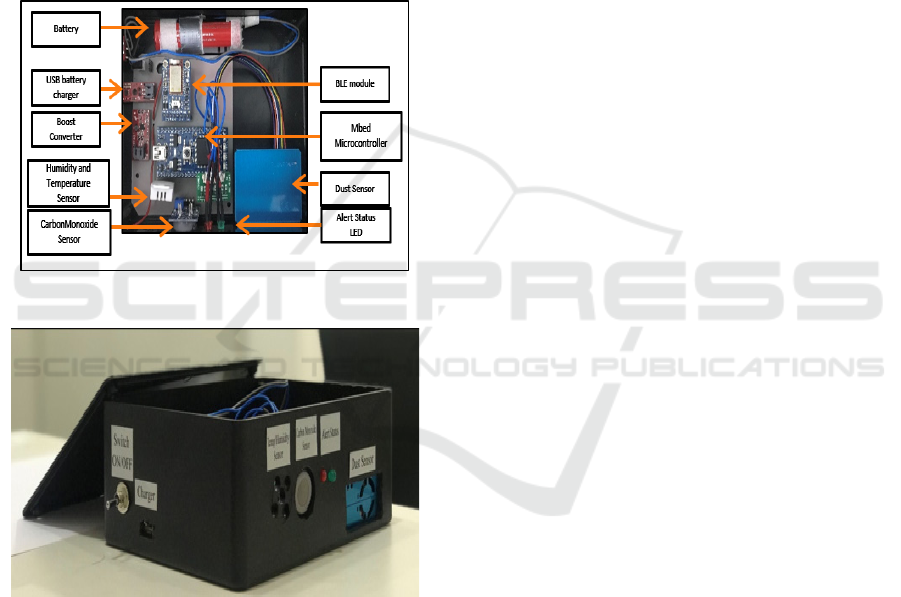
asthmatic children. Furthermore, a 3-D box was also
printed using 3D printer to host nicely this AQSS.
Figure 8: Final assembled prototype for AQSS.
Figure 9: Final packing for the prototype of AQSS.
The final prototype for AQSS was assembled on
the produced PCB board and hosted in the 3D
package as shown in Figure 8 and Figure 9
respectively. The developed app works on android
devices (Mobile phone or tablet). The Air-Quality
Sensing Subsystem and the Mobile App subsystem
were tested together. After turning ON the Air-
Quality Sensing Subsystem, the Mobile App was
opened and connected to AQSS. The sensors’
measurements are shown on the Mobile App as
demonstrated in Figure 6. The final prototype (shown
in Figure 9) was tested with the Mobile application in
different environment settings (dust, heat, and
humidity). To test the whole system in measuring the
CO, the flame of lighter is used in proximity to the
CO sensor of the AQSS. The developed prototype for
the Air Quality monitoring and alerting system works
successfully and shows real time measurements (on
the mobile app) that are received from the Air-quality
sensing subsystem over the BLE. For CO sensor
module, it shows a warning when the concentration
of the CO exceeded the set point. As it was mentioned
previously, the set point can be changed by varying
the variable resistor on the CO sensor. For our system,
the set point was set to the dangerous level for
asthmatic children (150ppm). In Figure 6, there was
no warning message as the system was tested indoor
in a normal environment setting.
5 CONCLUSIONS
The developed prototype system, in this work, can
collect data about environmental factors that trigger
asthma attacks in our region (Qatar). It shows the
collected measurements on mobile app and alert the
user when the out-door air quality degrades to a level
that trigger asthma attacks especially in children who
are more sensitive to asthma trigger factors.
Therefore, the developed system will help in
managing and avoiding asthma attacks for asthmatic
children by informing their parents in a real-time
manner. Thus, the life-quality for asthmatic children
will be improved as well as avoiding un-necessary
costly hospitalization. The developed system is
portable and user friendly. Thus, parents can use it
anywhere to check the surrounding air-quality and
avoid exposure of their asthmatic children to polluted
and unhealthy out-door environment. This work will
be extended by providing each sensing subsystem
with GPS and GSM modules to form IOT
infrastructure. Thus, the sensor subsystem can send
the collected data to the cloud database. The cloud
services can be used to analyze the environmental
sensor measurements data. The Air Quality Sensing
Subsystems(AQSSs) can be distributed in different
locations. All the AQSSs can send their data to the
cloud by utilizing the available IOT infrastructure.
Therefore, parents of asthmatic children can access
the cloud webserver and get updated information
about the air-quality level in a specific location at a
specific time.
Air Quality Monitoring and Alerting System to Help in Reducing Asthma Attack in Asthmatic Children
97

ACKNOWLEDGEMENTS
This work was supported in part by the Qatar
University Student Grant under Grant number
QUST‐1‐CENG‐2019‐12.
REFERENCES
M. Guarnieri, J. R. Balmes, and S. Francisco, ‘Outdoor air
pollution and asthma’, Lancet, vol. 383, no. 9928, pp.
1581–1592, 2015
Holgate, Stephen. (2010). A Brief History of Asthma and
Its Mechanisms to Modern Concepts of Disease
Pathogenesis. Allergy, asthma & immunology research.
2. 165-71. 10.4168/aair.2010.2.3.165.
Haughney, J., Winders, T. A., Holmes, S., Chanez, P., Saul,
H., Menzies-Gow, A., & PRECISION Improve Access
to Better Care Task Force (2020). Global Quality
Standard for Identification and Management of Severe
Asthma. Advances in therapy, 37(9), 3645–3659.
https://doi.org/10.1007/s12325-020-01450-7.
Diette, G. B., McCormack, M. C., Hansel, N. N., Breysse,
P. N., & Matsui, E. C. (2008). Environmental issues in
managing asthma. Respiratory care, 53(5), 602–617.
A. Alassi et al., ‘Development of innovative indoor/outdoor
air quality monitoring for environmental impact
assessment in the State of Qatar’, WIT Trans. Ecol.
Environ., vol. 183, no. April 2016, pp. 103–115, 2014.
A. Lal and G. A. Kulkarni, ‘Detection and Monitoring of
Asthma Trigger Factor using Zigbee’, vol. 3, no. 7, pp.
134–137, 2016.
Betts, A. (2020b, March 23). The 7 Best Apps and Sites to
Check Air Quality Anywhere. MakeUseOf.
https://www.makeuseof.com/tag/check-air-quality-
apps/ [Accessed: 5-Apr-2020].
AIR MENTOR. (2019). Https://Www.Air-Mentor.Com/.
https://www.air-mentor.com/web2017/product/air_
mentor_8096ap [Accessed: 22-Mar-2019].
Bottrell, J. (2009). High and low humidity not good for
asthma - Minimizing Triggers - Asthma. Everyday
Health. https://www.healthcentral.com/article/high-
and-low-humidity-not-good-for-asthma. [Accessed:
04-Nov-2018].
Vann, Madeline R., et al., 2012, Heat, Humidity, and
Asthma Symptoms: Everyday Health.”
EverydayHealth.com,
www.everydayhealth.com/asthma/heat-humidity-and-
asthma-ymptoms.aspx. [Accessed: 04-Nov-2018].
Airveda team. (2017). Measuring Data - Understanding
Particulate Matter and How It Impacts Our Health.
Https://Www.Airveda.Com.
https://www.airveda.com/blog/Understanding-
Particulate-Matter-and-Its-Associated-Health-Impact.
[Accessed: 22-Apr-2019].
Kidde. (2018). ‘Carbon monoxide Levels that Sound the
Alarm. Https://Www.Kidde.Com.
https://www.kidde.com/home-
safety/en/us/support/help-center/browse-
articles/articles/what_are_the_carbon_monoxide_level
s_that_will_sound_the_alarm_.html [Accessed: 04-
Nov-2018].
E Instruments. (2018, April 27). Health Effects of Nitrogen
Dioxide (NO2) in Homes. E Instruments | E-Inst.Com.
https://www.e-inst.com/applications/adverse-effects-
of-elevated-no2/ [Accessed: 04-Nov-2018].
CATA. (2018). Ozone Action Season | Clean Commute |
Rider Information | CATA. Www.Cata.Org.
https://www.cata.org/Rider-Information/Clean-
Commute-Options/Ozone-Action-Season [Accessed:
04-Nov-2018].
Z. Yong and Z. Haoxin, ‘Digital universal particle
concentration sensor PMS5003 series data manual’,
2016.
O.US EPA, ‘NAAQS Table’. [Online]. Available:
https://www.epa.gov/criteria-air-pollutants/naaqs-table.
[Accessed: 04-Dec-2018].
BIODEVICES 2021 - 14th International Conference on Biomedical Electronics and Devices
98
