
Impact of Educational Standards on the Sustainable Development of
the Labor Market
Vyacheslav Yu. Babyshev
a
International Scientific and Educational Laboratory of Technologies for Improving the Well-being of the Elderly, National
Research Tomsk Polytechnic University, Lenin Avenue, Tomsk, Russia
Keywords: Labor Market, Competition, Employment, Education, Educational Mismatch, Research Area Mismatch,
Qualification Mismatch.
Abstract: This article examines two aspects of the impact of education on the sustainable development of the labor
market: the impact of education on the level of employment and the educational mismatch between the
knowledge and skills acquired in educational institutions and required at the workplace. Based on a theoretical
review of the literature, it was concluded that there is no unanimous opinion among the authors on the impact
of education on the level of employment. It was also concluded that employers consider people's skills
insufficient for practical work, and scientists believe that educational skills of people are underutilized due to
insufficient rates of scientific and technological progress. Based on the analysis of statistics, it was concluded
that an increase in the level of education has a positive effect on the level of employment of the labor force in
almost all countries in all the years under consideration in general and for both sexes in particular. The
educational mismatch as a whole showed an increase in both under-qualification and over-qualification. It
was also concluded that in more developed countries there is more often a qualification gap and a lack of
knowledge and skills, while in less developed countries there is more often work outside the specialty and an
excess of knowledge and skills. If work outside the specialty is considered in the context of the educational
gap, then in general, there is an excess of knowledge in the framework of work outside the specialty and a
lack of knowledge in the framework of work in the specialty.
1 INTRODUCTION
The modern labor market is characterized by a
constant increase in the share of intellectual and
creative processes, combined with a decrease in the
share of routine and physical operations. In turn, the
institution of mentoring for training within the
production process, which functioned in Soviet times,
has practically ceased to exist in modern market
conditions. Therefore, for the smooth functioning of
the economy, it is important for employers to match
the professional knowledge and skills acquired in the
course of education and required in practice. In turn,
for employees, the issue of this compliance is relevant
in terms of reducing the possible risk of
unemployment and increasing their competitiveness
in the labor market.
The shift in technological paradigms leads to a
change in the qualifications and skills of the
a
https://orcid.org/0000-0003-2523-0542
workforce on the part of employers. And although
technological changes usually go hand in hand with
an increase in the educational and qualification level
of the labor force, recently, their inconsistency has
increased. This phenomenon has received in the
scientific literature the name of educational
inconsistency or educational mismatch (Guillaume,
Benoît and François, 2014).
Educational mismatch is understood as the gap
between the acquired educational skills and the
professional skills required in the labor market.
Educational mismatch worsens both quantitative
(total share of the employed) and qualitative
(correspondence of the place of work to educational
qualifications) indicators of the nature of
employment. In addition to the deterioration of
employment parameters, educational mismatch
negatively affects the level of wages and, through it,
Babyshev, V.
Impact of Educational Standards on the Sustainable Development of the Labor Market.
DOI: 10.5220/0010595706690677
In Proceedings of the International Scientific and Practical Conference on Sustainable Development of Regional Infrastructure (ISSDRI 2021), pages 669-677
ISBN: 978-989-758-519-7
Copyright
c
2021 by SCITEPRESS – Science and Technology Publications, Lda. All rights reserved
669

the quality of life. Also, educational mismatch leads
to a waste of human capital.
Distinguish between vertical and horizontal
educational discrepancy. Vertical discrepancy is
understood as the work of people with higher
education in low-skilled jobs. Horizontal is the
discrepancy between work and education or
education and profession.
Of particular interest for the study of educational
mismatch is Russia, where a high educational level of
the majority of the population was combined with a
sharp economic failure after the collapse of the
communist system. According to a study by V.
Rudakov, H. Figueiredo, P. Teixeira and S. Roshchin,
in Russia 32% according to the self-assessment
criterion and 40% according to the statistical method
of graduates do not work in their specialty. At the
same time, the greatest discrepancy is in areas with
general human capital (social sciences, business, law,
services) or low wages (agriculture). At the same
time, in certain areas with specific human capital (for
example, medicine), educational mismatch is weaker.
In other words, in areas where skills are easily
transferable to other types of jobs, educational
mismatch is more of areas with specific skills. In
other words, the educational mismatch in Russia is
more related to labor mobility than to the imbalance
between the educational and required labor skills
(Rudakov et al., 2019).
In Russia, there is a gap between the needs of the
market and the training of graduates by profession
and the number of people. As a result, there are socio-
economic costs in the form of increased
unemployment and unskilled labor in the workplace
(Fedolyak, 2018).
According to research by consulting firm
McKinsey, the US labor market is not experiencing a
labor shortage, but a skill deficit. According to 45%
of employers in the world, it is the lack of necessary
skills that makes it difficult to fill entry-level
vacancies. At the same time, 72% of heads of higher
education and only 42% of employers believe that
graduates are prepared for work (Bersin, 2013).
According to K. Marsikova and V. Urbanek,
education increases the demand for labor in the labor
market and allows you to find more interesting and
highly paid jobs. However, according to their
research, in developed countries there is an
educational gap between the needs of employers and
the individual desires of graduates, and most often
there is an excess of education for jobs (15.5% for
incomplete education and 28.6% for excess
education) (Marsikova, Urbanek, 2015).
According to E. Varshavskaya, having a
professional education increases the chances of
finding a job (Varshavskaya, 2016).
However, A. Manuilova received the opposite
data, that it is more difficult for people with higher
education to find a job in comparison with people
with secondary and specialized secondary education
(Manuilova, 2017).
In turn, E. Ghignoni and A. Verashchagina
believe that the most important role in overcoming
educational imbalance lies on the side of
technological progress, which favors highly educated
workers and reduces the need for retraining.
However, in countries with a low level of
technological development, the factor of supply of
labor with an excess of education for the labor market
becomes more important (Ghignoni and
Verashchagina, 2014).
K. Tijdens, M. Beblavý and A. Thum-Thysen
come to the conclusion that a quarter of the
professions are in excess demand, and a third of the
professions have an excess supply of labor. At the
same time, the level of education of personnel is on
average higher than the skills required for the
workplace (Tijdens, Beblavý and Thum-Thysen,
2018).
R. Muñoz de Bustillo Llorente, S. Sarkar, R.
Sebastian and A. Jose-Ignacio agree that over-
education is more common in the modern world, but
according to their research, the level of over-
education is gradually decreasing (Rafael Muñoz de
Bustillo, Sudipa, Raquel, Jose-Ignacio, 2018).
Based on the analysis of the literature, it can be
concluded that there are disagreements among the
authors on the impact of education on employment.
In terms of the educational gap, a more interesting
picture is emerging: experts more or less unanimously
speak of an excessive education of the workforce and
insufficient rates of scientific and technological
progress, while employers say the main problems are
the lack of necessary skills and the lack of readiness
of graduates for practical work.
2 RESEARCH METHODOLOGY
The research methodology consists in a statistical
comparison of the unemployment rate for large
groups of countries depending on the level of
education: basic and advanced according to the
method of the World Bank and the first, second and
third degrees of education according to the method of
the OECD.
ISSDRI 2021 - International Scientific and Practical Conference on Sustainable Development of Regional Infrastructure
670
The study of the educational gap between the
skills and competencies acquired and required at
work consists in a statistical comparison of dissimilar
countries depending on the nature of the gap:
insufficient, sufficient and excessive qualifications of
workers for their jobs according to the ILO
methodology and inconsistency in the field of study
and qualifications inconsistency according to the
OECD methodology. In turn, the qualification
mismatch is divided into insufficient and excessive.
3 RESULTS OF THE STUDY
3.1 Unemployment and Education
First, let's check the impact of education on the
unemployment rate.
The World Bank classifies education into two
levels (basic and advanced), and also conducts
statistical analysis on gender differences
(Unemployment with advanced education, The
World Bank).
Table 1: Unemployment among the workforce with basic
education.
Group
of
countri
es
Total number
(in%)
men (in%) women (in%)
1999 2018 1999 2018 1999
2018
Highly
develo
ped
countri
es
13,2 12,0 12,7 11,0 15,3
13,8
EEC 14,3 14,7 13,7 13,7 16,6
16,6
USA 9,3 5,9 8,2 5,2 11,3
7,1
Table 2: Unemployment Among the Advanced Workforce.
Group
of
countri
es
Total number
(in%)
men (in%) women (in%)
19
99
2018 1999 2018 1999 2018
Highly
develo
ped
countri
es
5,1 4,6 4,1 4,0 6,6 5,4
EEC 6,0 5,6 4,6 4,7 8,0 6,5
USA 2,1 2,5 2,1 2,4 2,1 2,5
The OECD Statistics Division introduces three
levels of education: lower secondary, upper
secondary and tertiary (Employment by education
level, OECD Data).
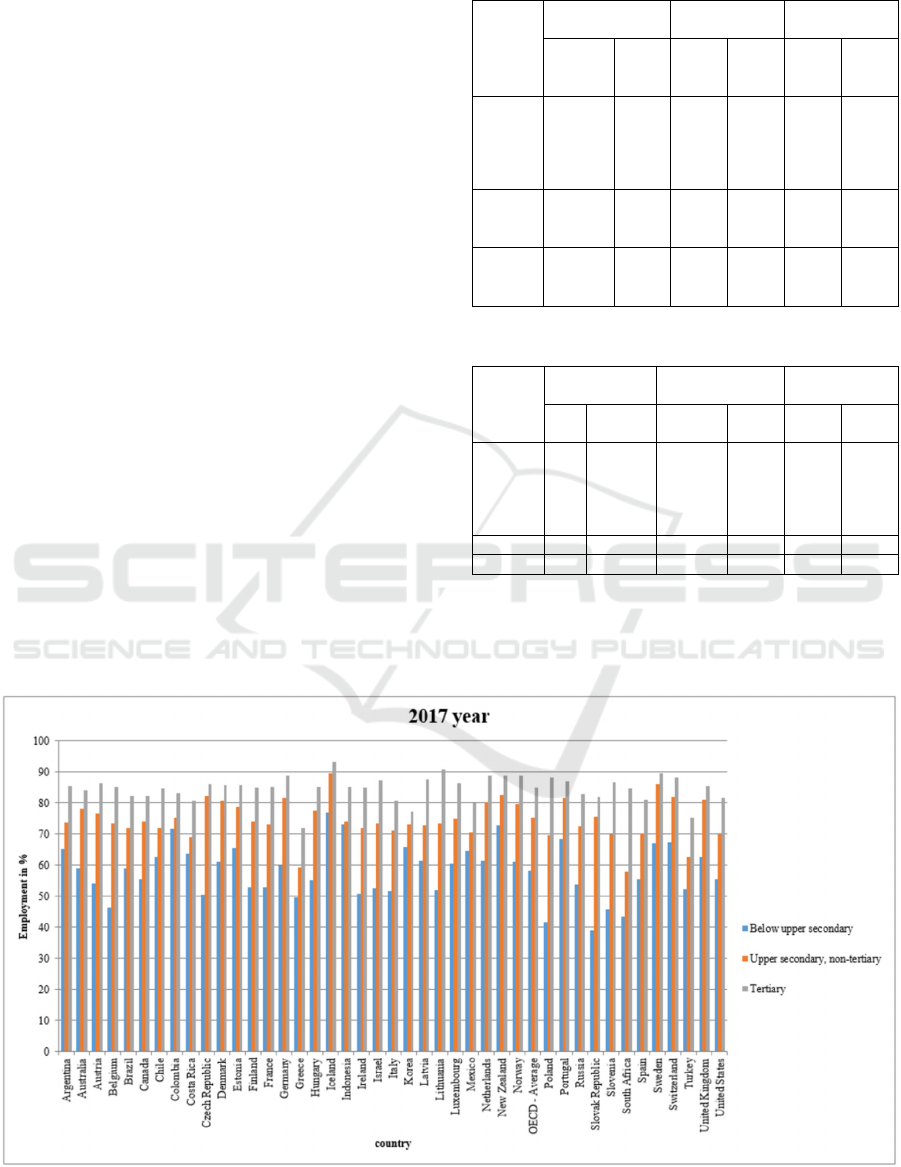
Figure 1: Labor force participation by education level by country.
Impact of Educational Standards on the Sustainable Development of the Labor Market
671
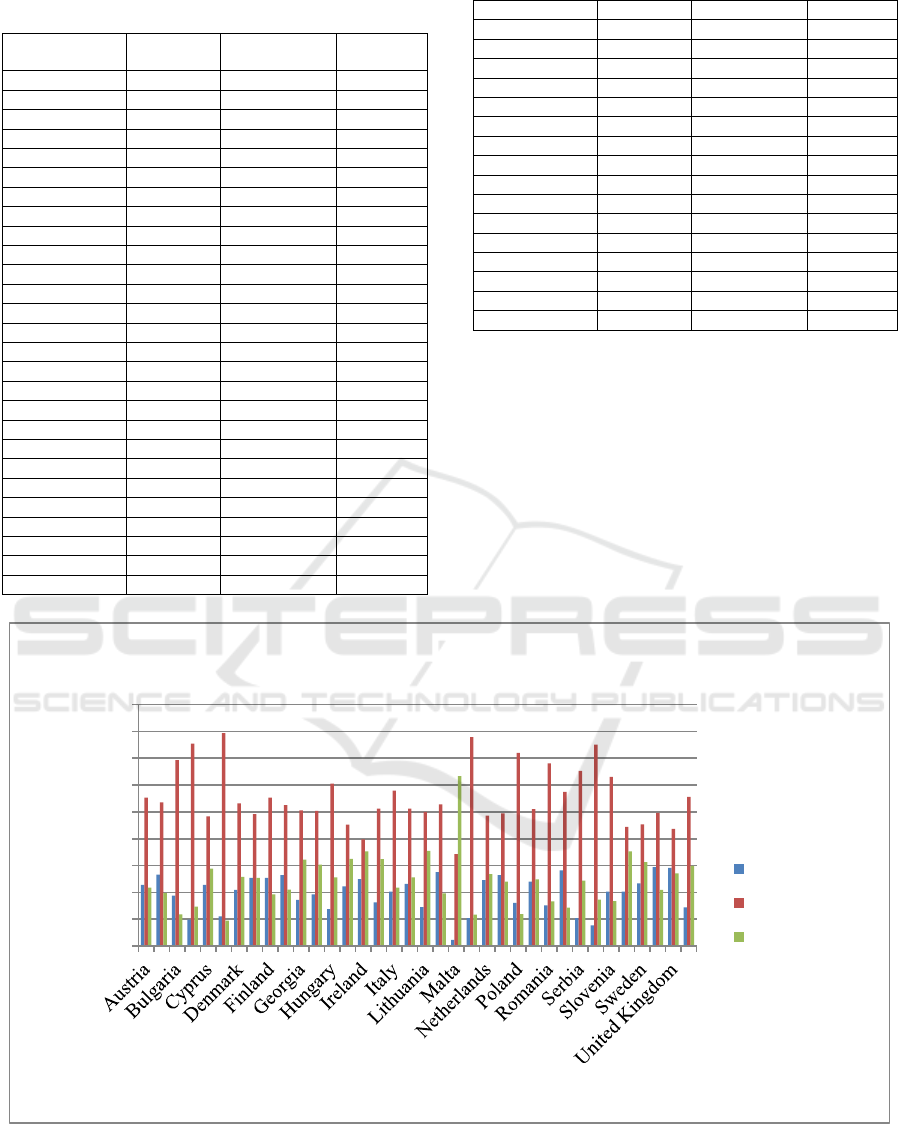
Table 3: Employment of people by education level.
Country Below the
average
Completed
secondary
Tertiary
Argentina 65,9 73,0 86,0
Australia 60,8 78,0 83,0
Austria 54,3 75,4 85,1
Belgium 48,2 73,8 84,6
Brazil 65,3 74,8 84,6
Canada 55,2 74,6 82,2
Chile 60,6 70,9 84,0
Colombia 71,4 75,6 82,8
Costa Rica 61,9 71,1 81,3
Czech Republic 46,5 77,8 86,3
Denmark 62,0 80,3 87,1
Estonia 52,1 74,4 83,2
Finlan
d
56,0 74,8 84,6
France 56,2 75,2 83,7
Germany 53,3 74,2 85,4
Greece 55,5 63,3 78,7
Hungary 41,3 71,5 82,0
Iceland 78,3 87,2 92,1
Indonesia 72,6 72,2 81,4
Ireland 51,6 70,9 83,7
Israel 46,5 70,7 84,1
Italy 51,0 72,0 80,9
Korea 66,5 70,6 77,0
Latvia 51,1 70,6 84,1
Lithuania 44,3 71,2 88,6
Luxembourg 61,3 72,3 85,0
Mexico 63,0 70,7 81,6
Netherlands 58,7 78,4 86,5
New Zealand 67,1 80,9 83,8
Norway 63,3 81,3 89,6
OECD 56,3 74,3 83,9
Polan
d
41,9 66,5 85,3
Portugal 69,0 80,2 86,8
Russia 50,2 72,0 81,9
Saudi Arabia 60,8 64,9 74,7
Slovakia 32,4 72,5 83,9
Slovenia 51,5 73,0 86,6
South Africa 44,1 59,9 86,3
Spain 53,2 70,3 79,6
Sweden 69,1 83,7 88,7
Switzerland 67,5 80,8 89,4
Turkey 52,0 62,8 77,2
Great Britain 62,2 80,3 86,2
USA 54,9 72,2 83,4
3.2 Educational Discrepancy
Let us test the hypothesis described above about a
significant level of educational mismatch between the
properties of the labor force and the nature of jobs.
The ILO considers the nature of employment in
three areas: insufficient, sufficient and over-
qualification of workers for the workplace they
occupy(Employment distribution by sex and
'educational mismatch', ILOStat).
Figure 2: Educational mismatch for selected countries for 2018.
0,0
10,0
20,0
30,0
40,0
50,0
60,0
70,0
80,0
90,0
Sufficiency of qualifications for the position
held
country
Educational mismatch
Undereducated
Matched
Overeducated
ISSDRI 2021 - International Scientific and Practical Conference on Sustainable Development of Regional Infrastructure
672
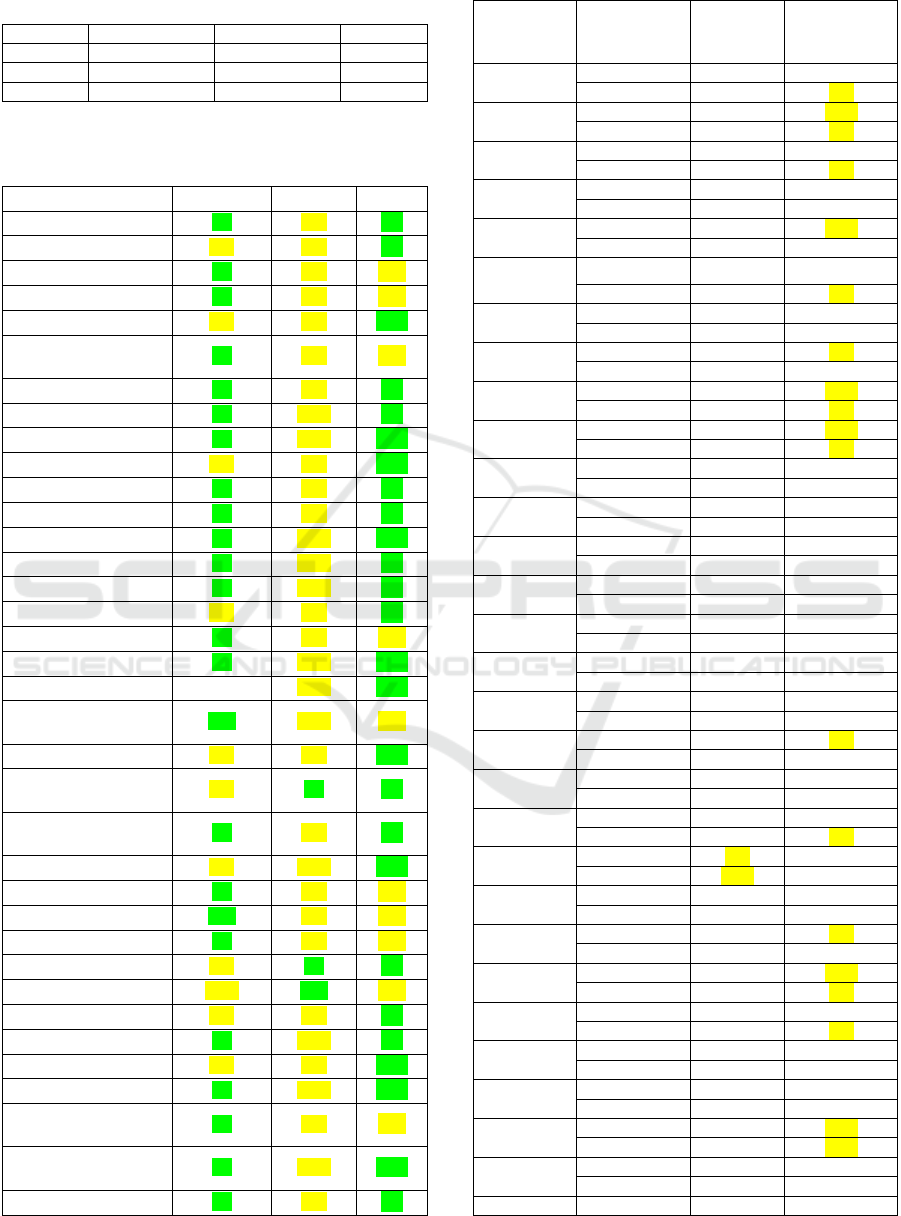
Table 4: Distribution of employment by educational
mismatch, 36 countries.
indicato
r
Inadequate Sufficient Excess
minimal 2,3 34,3 9,0
maximum 31,4 83,1 63,4
average 18,7 59,2 22,0
Table 5: Trends in educational mismatch across 36
countries over a known period.
36 countries Inadequate Sufficient
Excess
Austria (2010-2018) 5,8 -6,8
1,0
Belgium (2011-2018) -1,1 -4,6
5,6
Bulgaria (2010-2018) 6,4 -4,8
-1,6
Croatia (2010-2018) 0,7 -0,4
-0,3
Cyprus (2010-2018) -3,3 -9,7
12,9
Czech Republic
(2010-2018)
4,0 -3,7
-0,2
Denmark (2010-2018) 2,9 -7,5
4,6
Estonia (2010-2018) 5,9 -14,8
8,9
Finland (2010-2018) 0,5 -10,4
10,0
France (2010-2018) -4,9 -5,6
10,5
Georgia (2010-2019) 4,8 -6,4
1,6
Greece (2010-2018) 1,2 -4,5
3,4
Hungary (2010-2018) 1,1 -13,4
12,3
Iceland (2010-2018) 7,2 -11,2
4,1
Ireland (2010-2018) 2,6 -10,8
8,2
Israel (2012-2017) -1,5 -1,3
2,7
Italy (2010-2018) 2,3 -1,0
-1,3
Latvia (2010-2018) 3,9 -15,0
11,1
Lithuania (2010-2018) 0,0 -12,3
12,3
Luxembourg (2010-
2018)
15,3 -14,0
-1,3
Malta (2010-2018) -4,4 -9,5
13,9
Montenegro (2011-
2018)
-0,8 0,4
0,4
Netherlands (2010-
2018)
1,2 -6,8
5,6
Norway (2010-2018) -1,0 -14,1
15,0
Poland (2010-2018) 4,6 -2,8
-1,8
Portugal (2010-2018) 11,5 -5,3
-6,2
Romania (2010-2018) 2,4 -1,6
-0,8
Russia (2010-2019) -1,4 0,5
1,0
Serbia (2011-2019) -10,1 12,4
-2,4
Slovakia (2010-2018) -0,2 -7,3
7,5
Slovenia (2010-2018) 6,5 -11,2
4,7
Spain (2010-2017) -6,4 -6,5
12,9
Sweden (2010-2018) 4,8 -18,7
13,9
Switzerland (2010-
2018)
7,7 -7,2
-0,5
Great Britain (2010-
2018)
7,5 -21,5
14,0
USA (2010-2019) 0,8 -3,2
2,4
Table 6: Relative educational mismatch across 36 countries.
Correspondin
g minus
insufficient
Correspon
ding minus
excess
Excessive
minus
insufficient
Austria 45,2 41,3 3,8
32,5 33,5 -1,0
Belgium 30,4 44,0 -13,6
26,9 33,8 -6,9
Bulgaria 61,7 60,6 1,0
50,5 57,5 -6,9
Croatia 66,6 60,8 5,8
65,5 60,8 4,8
Cyprus 32,0 42,1 -10,1
25,6 19,5 6,1
Czech
Republic
75,9 73,3 2,6
68,2 69,8 -1,6
Denmark 42,7 39,6 3,1
32,2 27,4 4,8
Estonia 44,4 47,4 -3,0
23,8 23,7 0,0
Finland 40,8 56,5 -15,7
29,9 36,0 -6,2
France 26,8 47,6 -20,8
26,0 31,5 -5,4
Georgia 44,5 26,3 18,2
33,3 18,3 15,0
Greece 36,7 27,9 8,8
31,1 20,0 11,0
Hungary 61,4 60,7 0,7
46,8 34,9 11,8
Iceland 41,4 28,1 13,3
23,0 12,8 10,2
Ireland 28,2 23,4 4,8
14,8 4,4 10,4
Israel 34,8 22,9 11,8
34,9 18,9 16,0
Italy 41,1 35,9 5,1
37,7 36,2 1,5
Latvia 46,9 51,7 -4,8
28,1 25,7 2,4
Lithuania 47,9 39,1 8,8
35,6 14,6 21,0
Luxembour
g
54,5 45,9 8,6
25,2 33,2 -8,0
Malta 37,1 -5,7 42,8
31,9 -29,1 61,1
Montenegro 66,4 66,3 0,1
67,5 66,2 1,3
Netherlands 32,0 34,3 -2,2
24,0 21,8 2,2
Norway 36,2 54,5 -18,4
23,1 25,4 -2,3
Poland 63,3 61,0 2,3
55,9 60,0 -4,1
Portugal 43,8 25,3 18,5
27,1 26,2 0,8
Romania 56,9 52,2 4,7
52,9 51,4 1,5
Russia 27,3 43,6 -16,3
29,2 43,2 -13,9
Serbia 32,4 26,1 6,3
54,9 40,9 14,0
Slovakia 74,5 72,6 1,9
Impact of Educational Standards on the Sustainable Development of the Labor Market
673
67,4 57,8 9,6
Slovenia 60,5 62,3 -1,8
42,7 46,3 -3,6
Spain 24,2 28,5 -4,3
24,1 9,1 15,0
Sweden 45,4 46,6 -1,2
21,9 14,0 7,9
Switzerland 35,2 35,4 -0,3
20,3 28,7 -8,4
Great
Britain
43,6 52,1 -8,4
14,6 16,6 -2,0
USA 45,2 31,3 13,8
45,2 25,7 15,5
The OECD is making a more thorough
classification(Skills for Jobs. Mismatch – National
statistics OECD. Stat).
At first, she divides the educational mismatch into
vertical (when people work in a field other than the
education they received) and horizontal (when the
skills acquired during the educational process do not
fully meet the requirements of the workplace). And
already within the horizontal educational mismatch,
the OECD highlights inadequate and excessive
qualifications.
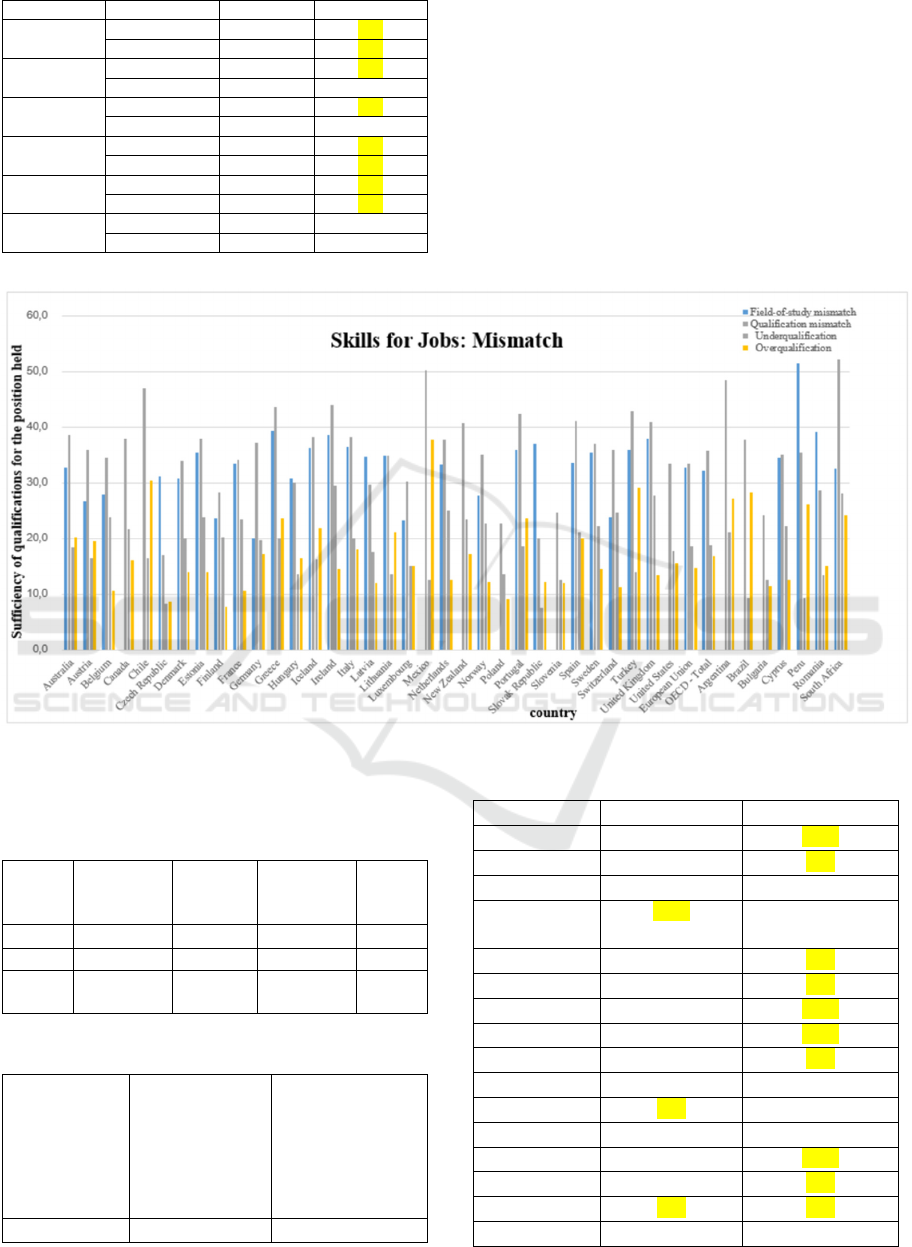
Figure 3: Educational mismatch for selected countries for 2016.
Table 7: Distribution of employment by educational
mismatch, 42 countries.
indicat
or
Research
area
mismatch
Qualifica
tion
mismatch
Insufficient
qualificatio
ns
Overqu
alificati
on
min 20,1 17,1 7,6 7,8
max 51,5 52,2 29,5 37,7
averag
e
33,1 35,9 18,5 17,4
Table 8: Relative educational disparity across 42 countries.
42 countries Excess
mismatch of
qualifications
and mismatch of
the field of
study
Excess over
qualification over
insufficient
qualification
Australia 6,0 1,7
Austria 9,4 2,9
Belgium 6,5 -13,2
Canada - -5,5
Chile - 14,0
Czech
Republic
-14,0 0,3
Denmark 3,2 -6,0
Estonia 2,5 -9,7
Finland 4,5 -12,5
France 0,8 -12,9
Germany 17,1 -2,5
Greece 4,3 3,7
Hungary -0,6 2,9
Iceland 1,8 5,5
Ireland 5,3 -14,9
Italy 1,7 -1,8
Latvia -5,0 -5,5
Lithuania 0,0 7,6
ISSDRI 2021 - International Scientific and Practical Conference on Sustainable Development of Regional Infrastructure
674
Luxembourg 6,9 0,0
Mexico - 25,1
Netherlands 4,5 -12,5
New Zealand - -6,3
Norway 7,3 -10,4
Poland - -4,4
Portugal 6,5 4,9
Slovakia -17,0 4,7
Slovenia - -0,6
Spain 7,5 -1,2
Sweden 1,6 -7,7
Switzerland 12,2 -13,4
Turkey 7,0 15,1
Great Britain 3,0 -14,2
USA - -2,1
EEC 0,7 -4,0
OECD 3,5 -2,1
Argentina - 6,0
Brazil - 18,8
Bulgaria - -1,0
Cyprus 0,5 -9,6
Peru -16,0 16,9
Romania -10,6 1,6
South Africa 19,7 -3,9
4 THE DISCUSSION OF THE
RESULTS
4.1 Unemployment and Education
As we can see from the WB table, in highly developed
countries and the United States, unemployment
among people with basic education has decreased,
while in the EEC, on the contrary, it has slightly
increased both in general and for both sexes. At the
same time, the unemployment rate of women with
basic education was higher than that of men.
As we can see from the WB table, unemployment
among people with advanced education is noticeably
lower than the unemployment of people with basic
education, both in general and for both sexes in
particular.
At the same time, in highly developed countries
and the EEC, unemployment among people with
advanced education has decreased, while in the
United States, on the contrary, it has increased both
in general and for both sexes. At the same time, the
unemployment rate of women with advanced
education was higher than male indicators.
As we can see from the OECD chart, employment
of people with completed secondary education in
almost all cases was higher than employment of
people with lower secondary education, and
employment of people with tertiary education, in turn,
was always higher than the same indicator for people
with completed secondary education.
An analysis of data for 44 countries for 39 years
from 1981 to 2019 showed that the employment rate
of people with lower secondary education averaged
57%, people with completed secondary education
74%, and those with tertiary education 84% of the
number of people of working age. Thus, completed
secondary education increases employment by
16.7%, and tertiary education by 10.4%.
Comparative analysis for the entire period from
1981 to 2019 showed that with an increase in the level
of education, the employment of people of working
age is steadily increasing (the only exception: the
employment of people with tertiary education in
Australia in 1989 was lower than that of people with
completed secondary education).
4.2 Educational Discrepancy
The ILO graph shows that for 36 countries except
Malta, most jobs correspond to the skills of the labor
force, and there is a contradictory trend in the share
of underskills and overskills.
Thus, we can conclude that although the majority
of employed people fit their jobs, more than 40%
demonstrate inadequacy. At the same time, the level
of underutilization exceeds the indicator of
insufficient knowledge and skills.
For 1 column "lack of knowledge and skills" the
following picture is observed: in 11 cases there is a
decrease, 1 case has not changed, and 24 examples
showed an increase. The growth was mainly observed
(66.7%).
The following picture is observed for column 2
“sufficiency of knowledge and skills”: in 33 cases
there is a decrease and 3 examples of growth. The
decline was mainly observed (91.7%).
For column 3 "redundancy of knowledge and
skills" the following picture is observed: in 10 cases,
a decrease and in 26 cases, an increase. The growth
was mainly observed (72.2%).
In general, it can be concluded that the level of
insufficient qualifications showed an upward trend,
the level of qualification matching - a fall, and the
level of overqualifications also increased.
Most jobs are qualified everywhere, except Malta
(which has the most overskilled people).
Impact of Educational Standards on the Sustainable Development of the Labor Market
675

Out of 72 examples, in 44 cases, excess education
is greater than insufficient, in 1 case they are equal,
and in 27 examples, insufficient education exceeds
excess.
In general, the world does not see a clear
relationship between the nature of the educational gap
and the level of socio-economic development.
In general, according to the OECD chart, it can be
said that the mismatch of qualifications, on average,
occurs more often than the mismatch of the field of
study, and the lack and excess of qualifications shows
a contradictory trend. At the same time, the opposite
trend, when work outside the specialty exceeds the
qualification gap, occurs only in some countries of
Eastern Europe and Latin America. At the same time,
there is a general trend in the OECD, EEC, Great
Britain and France.
Thus, about a third of people do not work in their
specialty, and the discrepancy between the qualities
of the workforce and the nature of the workplace
reaches 36%. At the same time, insufficient
qualifications exceed the indicator of redundancy of
knowledge and skills. At the same time, this
preponderance is more often observed in the countries
of Northern and Western Europe, while the
preponderance of excess over insufficient
qualifications is more often observed in the countries
of Southern, Eastern Europe and Latin America. This
phenomenon is also confirmed by the preponderance
of insufficient over excess qualifications in the
OECD, EEC, USA, Great Britain and France.
In terms of the ratio of work outside the specialty
and the qualification gap, the following picture is
observed: in 25 cases the qualification gap exceeded
the work outside the specialty, in 1 case it was equal
and in 6 cases the work outside the specialty exceeded
the qualification gap. Data for 10 countries is
unknown.
In terms of the ratio of sufficient and insufficient
qualifications, the following picture was observed: in
16 cases overqualification prevailed, in 1 case it was
equal, and in 25 cases inadequate qualifications
prevailed.
5 COPYRIGHT FORM
I, Vyacheslav Yuryevich Babyshev, provide a formal
written consent for the written consent to the
publication and transfer of copyright to the article
"The Impact of Educational Standards on the
Competitiveness of the Labor Force" to the
organizing committee of the International Scientific
and Practical Conference on Sustainable
Development of Regional Infrastructure (ISSDRI
2021).
6 CONCLUSIONS
6.1 Unemployment and Education
Based on the impact of education on employment, it
can be unambiguously concluded that an increase in
the level of education increases the employment of
the working-age population both in general and for
both sexes in particular (although the gender gap still
persists).
6.2 Educational Discrepancy
In terms of educational discrepancy, the picture is less
rosy. Although for the majority of jobs there is a
correspondence between the acquired and required
knowledge and skills, a significant proportion is
occupied by jobs with educational discrepancy.
At the same time, the discrepancy between
qualifications is more common in comparison with
work outside the specialty.
As the information technology paradigm
develops, the working-age population, on average, is
more likely to get a job in a specialty, but at the same
time the qualification gap grows.
Insufficient qualifications are more common than
redundant ones; however, as the information
technology paradigm develops, a comparative excess
of knowledge and qualifications is replaced by its
deficit.
At the same time, taking into account work
outside the specialty, on average in the world there is
an excess of knowledge and skills, i.e. there is an
increased percentage of overqualified people in the
research area mismatch. In other words, for those
working not in their specialty there is an excess of
knowledge and skills, but for those working in their
specialty, on the contrary, there is a deficit of
knowledge and skills. Thus, the economy not only
underutilizes the excess knowledge and skills of
people in this field of activity, but also provides them
with employment outside their specialty.
Based on the results obtained, two
recommendations can be made. First, it is necessary
to carry out more active work on the employment of
graduates in the specialty. Secondly, it is necessary to
adjust the existing educational programs in the
direction of taking into account the practical needs of
employers.
ISSDRI 2021 - International Scientific and Practical Conference on Sustainable Development of Regional Infrastructure
676

ACKNOWLEDGMENTS
The study was carried out with the financial support
of the Russian Foundation for Basic Research within
the framework of the research project
"Transformation of the quality of life and
characteristics of employment in the context of
technological and demographic challenges", project
No. 19-310-90050.
The reported study was funded by RFBR, project
number 19-310-90050.
REFERENCES
Varshavskaya, E. (2016). Success of the "study-work"
transition: for whom is the road easier? Sociological
research, 2 (382): 39-46.
Manuilova, А. (2017). You can't buy a job with a diploma.
Kommersant, 76: 2.
Fedolyak, V. (2018). Inconsistency of the educational
services market with the labor market requirements:
reasons and ways to overcome. Professional
orientation, 2: 49-53.
Bersin, J. (2013). The Educational Mismatch. Chief
Learning officer.
Employment by education level, % of 25-64 year-olds.
OECD Data. https://data.oecd.org/emp/employment-
by-education-level.htm#indicator-chart.
Employment distribution by sex and 'educational
mismatch', Statistical approach (%), Annual. ILOStat.
https://ilostat.ilo.org/topics/employment/
Ghignoni, E. and Verashchagina, A. (2014). Educational
qualifications mismatch in Europe. Is it demand or
supply driven? Journal of comparative economics, 42
(3): 670-692.
Guillaume, V., Benoît, M. and François, R., 2014.
Educational Mismatch and productivity. Dynamiques
regionals, 1(1): 17-26.
Marsikova, K. and Urbanek, V. (2015). A comparison of
educational mismatches across Europe. Ekonomie a
management, 18 (4): 24-38.
Muñoz de Bustillo Llorente, R., Sarkar, S., Sebastian, R.,
Antón, J.-I. (2018). Educational mismatch in Europe at
the turn of the century: Measurement, intensity and
evolution. International Journal of Manpower, 39(8):
977-995.
11. Rudakov, V., Figueiredo, H., Teixeira P. and Roshchin,
S. (2019). The Impact of Horizontal Job-Education
Mismatches on the Earnings of Recent University
Graduates in Russia. Discussion Paper. IZA DP.
Institute for the Study of Labor, 12407.
Skills for Jobs. Mismatch – National statistics. OECD. Stat.
https://stats.oecd.org/Index.aspx?DataSetCode=LAB_
REG_VAC
Tijdens, K., Beblavý, M. and Thum-Thysen, A. (2018).
Skill mismatch comparing educational requirements vs
attainments by occupation. International Journal of
Manpower, 39(8): 996-1009.
Unemployment with advanced education, female (% of
female labor force with advanced education. The World
Bank.
https://data.worldbank.org/indicator/SL.UEM.ADVN.
FE.ZS.
Impact of Educational Standards on the Sustainable Development of the Labor Market
677
