
Fast-growing Tech Companies as a Driver of Regional and National
Sustainable Economic Development
Irina B. Dzyubenko
a
Institute of Economics and Industrial Engineering SB RAS, Academician Lavrentyev Avenue 17, Novosibirsk, Russia
Keywords: High-Tech Business, High-Growth Firms (HGFs), Fast-Growing Companies (FGCs), Exponential
Technologies and Organizations, Entrepreneurial Ecosystem, Sustainable Development.
Abstract: The article deals with the analysis of the fast-growing tech companies which are proved to be a key factor in
structural changes and sustainable economic growth. The intended purpose of this paper is to identify the
particular traits of fast-growing tech companies and to reveal the factors which determine the extent of their
development (both spatial and intensive) in various regions and countries. The paper employs multivariate
analysis methods in the evaluation of the data for 29 countries in order to achieve the purpose mentioned
above. A set of factors affecting the launch and growth of tech companies has been determined. The
relationship between the development of fast-growing high-tech companies and the following variables was
tested: the level and the dynamics of country's wealth, population’s welfare, as well as the share of R&7D
expenditures in GDP. Based on cluster analysis 4 groups of countries have been defined depending on the
indicators of fast-growing tech companies’ development and the characteristics of entrepreneurial ecosystem
there. The value of this paper is to provide practical tools for enhancing technology entrepreneurship. The
results of the research can be used in the development and implementation of support measures for fast-
growing companies.
1 INTRODUCTION
The unprecedented economic crises caused by the
coronavirus pandemic highlighted the urgency of
sustainable economic growth at the macro and micro
economy levels. Given the ability of High-Growth
Firms (HGFs) to generate sustainable and rapid
growth through the use of new technologies and
business models, it is fair to identify them as drivers
of regional and national sustainable economic
development. (Coad et al., 2014). It is believed that
HGFs create more than 40% of new workplaces,
although in some countries the share of such
companies is approximately 5% (Bravo-Boscia et al.,
2013). Moreover, FGCs might enhance the level of
productivity (Autio, 2009), perform as a benchmark
for potential entrepreneurs (Bosma et al. 2012),
promote the diffusion of innovations (Coad, 2009),
generate new knowledge (Colombelli et al. 2014),
support export orientation (Mason and Brown, 2010)
and stimulate industry growth (Du and Temouri,
a
https://orcid.org/0000–0002–7748–5486
2015). Furthermore, HGFs activities can have
multiplier effects (Moreno and Coad, 2015).
HGFs are particularly well represented in high-tech
industries, they are ubiquitous, but unevenly
distributed in different countries and regions.
According to Eurostat data, the number of high-tech
companies in the EU increased by 30% between 2014
and 2017, which is much higher than the 9% growth
rate of all active company’s in the EU business
economy. As a result, they accounted for about 11%
of all entities in the business economy (European
Commission, 2019). This fact demonstrates the
importance of high-tech companies in the business
dynamics of European countries.
The volatility of the conditions in which
companies operate, as well as their macroeconomic
and institutional environment, imply that HGFs -
friendly policies must be tailored to the specifics of the
region (Bosma and Stam, 2012). This makes the cross-
country analysis of FGC differences relevant (Coad et
al., 2014; Teruel and De Wit, 2011), as it takes into
account both economic conjuncture and institutional
540
Dzyubenko, I.
Fast-growing Tech Companies as a Driver of Regional and National Sustainable Economic Development.
DOI: 10.5220/0010593605400548
In Proceedings of the International Scientific and Practical Conference on Sustainable Development of Regional Infrastructure (ISSDRI 2021), pages 540-548
ISBN: 978-989-758-519-7
Copyright
c
2021 by SCITEPRESS – Science and Technology Publications, Lda. All rights reserved

environment, and other characteristics of the
entrepreneurial ecosystem.
Despite the relevance of the problem under study
and increased attention to the issue (Teruel and De Vit,
2011), inequalities remain in the ability to initiate and
manage the creation and growth of FGCs, meanwhile
the available knowledge is limited. (Nightingale and
Coad, 2014). To fill this gap in the scientific literature,
we examine the institutional and macroeconomic
environment as well as the components of the
entrepreneurial ecosystem that shape cross-country
differences in the methods of HGFs development.
We focus on a specific type of HGFs - the fastest-
growing companies (FGCs) showing exceptional
growth (Lia et al., 2016). The number of such
companies is rather small and is associated with high
risks as they create and use new exponential
technologies (Ismail et al., 2017) and new untested
business models. This topic is still uncovered in the
economic literature. The growth of such companies
has a positive recycling dynamic and does not depend
on the size of the economy and the dynamics of its
development. In contrast, there is a correlation
between the dynamics of economic development and
the presence and growth rates of tech FGCs.
The results of this study show that the operating
environment of fast-growing tech companies differ
significantly in various countries and regions. The size
of а country's economy, the capacity of the domestic
market and the volume of domestic R&D expenditures
are not the determining factors in the development of
tech FGCs. These companies are concentrated in
countries with a high level of technological
development and population’s welfare, a well-
developed infrastructure, a low level of undue
influence and corruption, with the available latest
technologies and venture capital as well as with
favorable conditions for talents and entrepreneurship
development. The development of such companies
(spatial and intensive) is determined by the
institutional framework and the quality of the
entrepreneurial ecosystem. Tech FGCs, in turn, have
significant influence on them.
2 MATERIALS AND METHODS
The methodological basis of the study is the general
theory of economic growth and systems analysis. The
research is based on the data from the Deloitte 2016
Technology Fast 500 ™ EMEA rankings, which
covers the largest number of countries (Deloitte, 2016)
and companies' websites. The Deloitte Technology
Fast 500™ EMEA program is focused on the
technology ecosystems. It recognizes technology
companies that have achieved the fastest rates of
revenue growth in Europe, the Middle East, and Africa
(EMEA) during the past four years. In order to
participate in the ranking, a company must meet the
following eligibility criteria: be in business not less
than of four years, be headquartered within EMEA,
have base-year operating revenues of € 50 000 and a
current year operating revenue of at least € 800 000,
own proprietary intellectual property or proprietary
technology, sold to customers in products that
contribute to a majority of the company's operating
revenues.
A wide range of indicators characterizing the
macroeconomics and institutional environment and
other framework conditions conducive to the
development of tech FGCs are also used in the
analysis. FGCs indicator framework aims to capture
the most important factors that determine the overall
quality of tech FGCs ecosystem. Priority lies with
indicators that are tailored to tech FGCs and with
regional-level indicators since the FGCs ecosystem is
often determined by specific local circumstances
More than 90 indicators were analyzed to identify
factors that explain the significant differences in the
development of tech FGCs in different countries. In
order to determine the variables which would have
statistically significant influence on the FGCs
development for the relationship analyses both
correlation and regression methods were
implemented.
Through the cluster analysis method 4 groups of
countries have been identified, which differ in terms
of concentration and growth rates of the fast-growing
tech companies and in terms of characteristics of the
entrepreneurial ecosystem. Cluster analysis was
conducted using the k-means method. Transformation
of variables and clustering was carried out using the
maximum distance method. To perform calculations,
processing and evaluation of the data under study the
following software products were used: Excel, IBM
SPSS Statistica. The results obtained at this stage of
the research are presented below.
3 RESULTS AND DISCUSSION
3.1 Characteristics of the
Fastest-growing Tech Companies
Technology Fast 500™ EMEA list, a ranking of the
500 fastest-growing innovation technology media,
telecommunications, life sciences and energy tech
companies (see Figure 1).
Fast-growing Tech Companies as a Driver of Regional and National Sustainable Economic Development
541
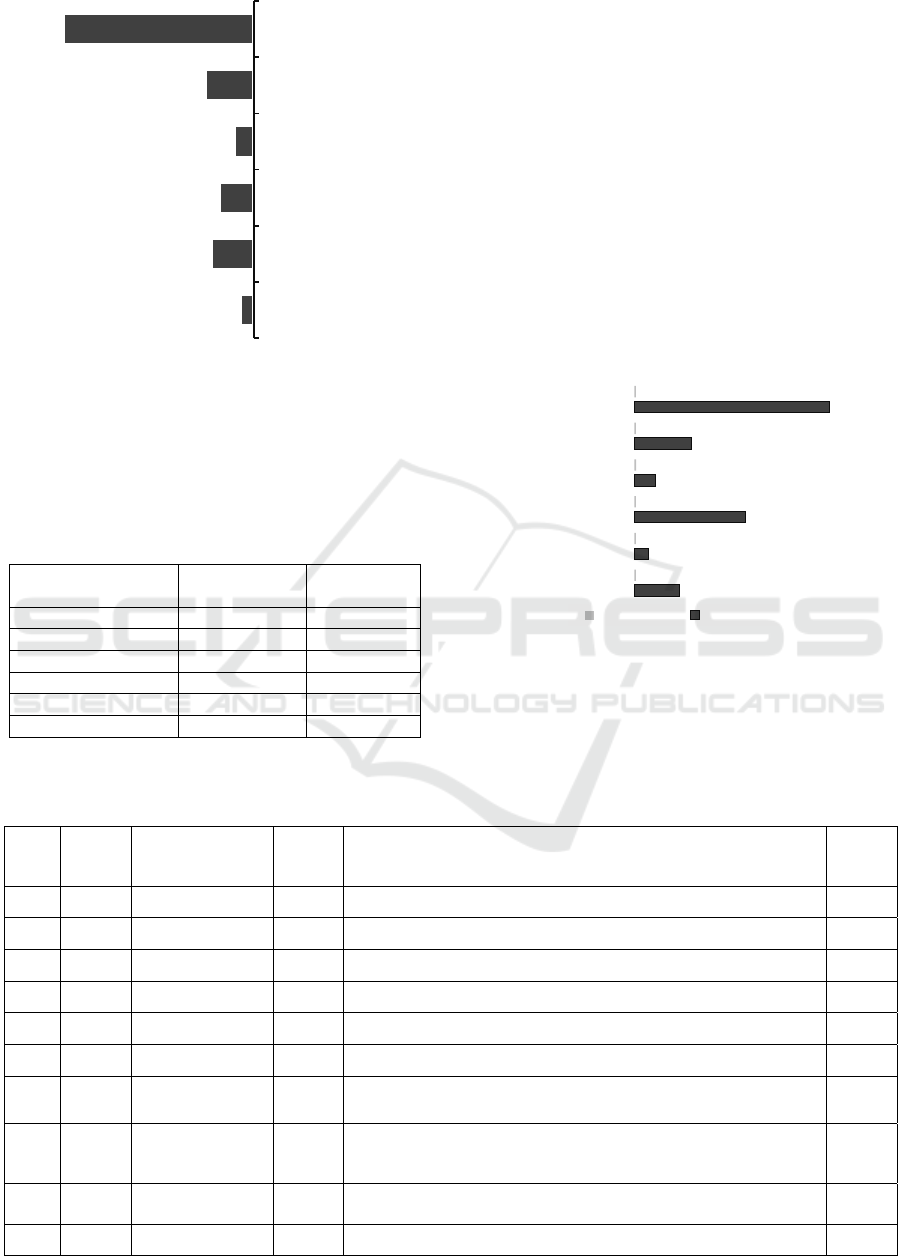
Figure 1: Sector structure of the Ranking.
The majority of fast-growing companies operates
in the software industry. However, these companies
demonstrate relatively low growth rates - 362% (see
Table 1).
Table 1: Number and growth rates of companies in various
sectors.
Sector
Number of
companies
Average
growth, %
Clean Technolo
gy
20 471
Communication 61 345
Hardware 49 962
Life Sciences 29 347
Media 70 644
Software 271 362
The leaders in terms of growth rates are hardware
companies (962%) whose share in the rating is less
than 10%.
The second place in terms of the number of
companies and their growth rates is followed is
followed by the media. The share of companies in this
sector is one and a half times larger than that in the
hardware, but the growth rates, in contras one and a
half times lower. Average growth rate of 29
companies related to the life sciences sector is equal
to 347%. The clean technology FGCs with 471%
revenue growth rate have the least presence in the
ranking.
Between 2012 and 2015, the companies achieved
revenue growth of 212% to 28,126% (see Figure 2).
The median revenue growth is equal to 967%.
Figure 2: Four-year revenue growth.
The top-ten-ranked companies are featured below by
company, country, industry sector and four-year
growth percentage (see Table 2). Top companies in
the ranking show extraordinary growth.
Table 2: Top-10 Technology Fast 500 ™ EMEA Ranking.
Rating Country Company name
Revenue
increase,
%
Activity type / product Sector
1 Sweden Fingerprint Cards 28 126 User friendly fingerprint biometric solutions Software
2 Turkey Bilgikent 16 015 IT system and infrastructure provider and integrator Hardware
3 Poland Codewise 13 052 Online marketing tools Software
4 Norway Auka 11 487 Mobile payment platforms Software
5 France Horizontal Software 8 339 SaaS-based HR software Software
6 UK Brain Labs Digital 8 255 Media agency and provider of automated marketing solutions Media
7 Israel Magisto 8 119 User-friendly tools for making short videos and taking photos Media
8 France Chauffeur-Privé 7 020
Ride-sharing application enabling licensed drivers to offer rides to
clients.
Software
9 Austria
Wikifolio Financial
Technologies
7 001
Social investment platform for entrusting funds with registered
traders, based on their performance
Software
10 UK GoCardless 6 661 Application for direct debit management in enterprises Software
4%
12%
10%
6%
14%
54%
Clean Technology
Communications
Hardware
Life Sciences
Media
Software
6 548
1 967
16 015
3 039
8 255
28 126
213
213
214
229
216
212
Clean Technology
Communications
Hardware
Life sciences
Media
Software
Minimum Maximum
ISSDRI 2021 - International Scientific and Practical Conference on Sustainable Development of Regional Infrastructure
542

The average annual revenue growth of the
companies amounts to 445% (from 128,8% to 655%).
Thus, all tech FGCs show exponential growth. These
companies meet the criteria of an exponential
organization (ExO) (Ismail et al., 2017; Dzyubenko
and Dzyubenko, 2018) and use this business scaling
model. These companies generate high growth and
take leading positions in their fields. The most
important factors in their development are the
creation and use of fast-paced disruptive technologies
capable of providing exponential growth and
exponential cost as well as new business processes.
By linking their products to exponential growth and
lowering costs through new technologies, ExOs offer
products that are better, cheaper and more
personalized at the same time, for all customers. They
actively set up their own business platforms, which
allow them serve almost unlimited number of direct
connections with partners and customers. Platforms
are becoming fertile ground for the creation and
development of technology and business ecosystems
based on collective production and consumption
practices that blur the lines between supply chains,
performers, partners, customers and the general
public. Technology ecosystems create Such
environment and relationships which help high-tech
companies to grow and develop faster. Expanding the
technological framework allows companies to pool
resources and efforts, to foster exponential
innovation, and to amplify the impact on cost-
effectiveness. Technology, innovation and the
external environment form an entrepreneurial
ecosystem that is simultaneously influenced by high-
tech companies and affects their growth.
3.2 Development of Fast-Growing Tech
Companies in Different Countries
The Technology Fast 500 for EMEA 2016 list
includes the countries of Europe and the Middle East:
Austria, Belgium, United Kingdom, Germany, Israel,
Ireland, Netherlands, Iceland, Norway, Finland,
Sweden, Spain, Italy, Lithuania, Portugal, Slovenia,
Turkey, Czech Republic, Bulgaria, Bosnia and
Herzegovina, Hungary, Greece, Poland, Russia,
Romania, Serbia, Slovakia and Croatia.
High-tech FGCs operate in the entire business
economy of the region, although with varying
concentrations. The regional structure of the rating is
shown in Figure 3.
Figure 3: Regional structure of the Ranking.
France became the leader in terms of the number
of companies (94 companies), followed by the United
Kingdom (70), the Netherlands (54), Norway (50)
and Sweden (50) (see Figure 4). More than 60% of
FGCs is concentrated in the five leading countries.
Figure 4: Ranking of countries by the number of FGCs.
The concentration of tech FGCs in countries was
estimated in terms of their density (the number of
FGCs per million population). As for the FGCs
density, the ranking based on this indicator (Figure 5)
54%
6%
25%
4%
10%
WesternEurope
EasternEurope
NorthernEurope
SouthernEurope
MiddleEast
94
70
54
50
50
27
23
23
22
21
15
10
7
6
4
3
3
3
3
3
2
1
1
1
1
1
1
1
1
FRA
GBR
NLD
NOR
SWE
ISR
DEU
FIN
BEL
TUR
POL
ITA
IRL
CZE
SVK
HUN
ISL
PT
ROU
HRV
AUT
BGR
BIH
GRC
ESP
LTU
RUS
SRB
SVN
Fast-growing Tech Companies as a Driver of Regional and National Sustainable Economic Development
543
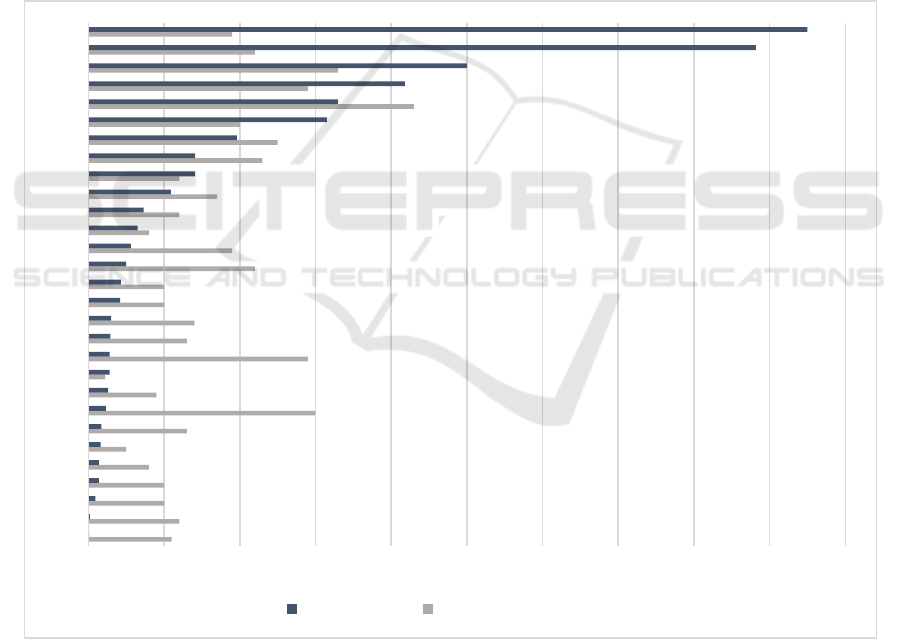
deviates a lot from the previous one. In the countries,
leading in terms of their number of FGCs, the
concentration of FGCs was lower than in the sparsely
populated countries with relatively small territory.
For instance, France ranks first in terms of the number
of FGCs and the ninth - in terms of their density. In
contrast, Iceland is 17th in terms of the number of
FGCs, but the second in terms of FGCs density. The
largest number of fast-growing companies per 1
million population is in Norway, Iceland, Sweden,
Finland and Israel. Despite well-developed economy
Germany takes the 19th place under this indicator.
Despite well-developed economy Germany takes the
19th place under this indicator.
Most tech FGCs are concentrated in countries
with a high level of economic development and the
most favorable framework conditions.
Austria's tech FGCs are leading in terms of the
average revenue growth in the country (4135%), their
growth is almost 15 times higher than that of Spain
(277%), which takes the last place. Austria is
followed by Portugal; whose FGCs grew on average
7.3 times faster than the Spanish ones. Turkey took
the third place with a small margin. United Kingdom,
Germany, France and Norway are middle-ranking.
Such results might be explained by the large number
and Norway are middle-ranking of companies in
these countries represented in the ranking and the
wide range of values of their growth indicators. Thus,
in the countries of the region, there is not only an
uneven distribution, but also an uneven growth of
tech FGCs.
Figure 5: FGCs density and R&D expenditure in different countries.
012345678910
RUS
GRC
SRB
ITA
TUR
DEU
HUN
POL
CZE
SVK
IRL
BEL
ISR
SWE
NOR
HGFsdensity R&Dexpenditure,%GDP
ISSDRI 2021 - International Scientific and Practical Conference on Sustainable Development of Regional Infrastructure
544
3.3 Relationship between the
Development of Fast-growing Tech
Companies and the Level and
Dynamics of the Country's Wealth,
Population's Welfare
The growth in the number and the development of
high-tech companies is undoubtedly a positive factor
for the economy of each country. However, it is
necessary to estimate, on the one hand, how the
economic environment contributes to the formation
and development of these companies and, on the other
hand, to find out if there is statistically significant
relationship between the number and growth rates of
high-tech companies, the country's wealth and the
level of population’s welfare.
Correlation analysis showed a moderate
relationship between the number of technological
FGCs and a country's wealth level as measured by
GDP (PPP). The correlation of the number of
technological FGCs with the welfare of the
population, measured by GDP (PPP) per capita, is
low (Table 3).
Table 3: Correlation table entrepreneurial ecosystem elements and output.
GDP (PPP) GDP (PPP)
per capita
GDP
growth rate
GDP growth rate
per capita
R&D expenditure
Number of FGCs 0,6 0,57 -0,18 -0,03 0,42
FGCs density -0,11 0,75 0,07 0,1 0,44
FGCs growth -0,02 -0,04 0,07 -0,19 0,08
Population welfare level in the sample, in general,
has greater influence on the FGCs density.
Correlation between FGCs density and GDP (PPP) is
low. However, the picture differs significantly across
groups of countries, depending on the level of their
economic development. Correlation coefficients
between the number of techs FGCs and the size of the
economy range from 0.98 for developed economies
to 0,12 for countries with economies in transition,
most of which are represented by one company. In the
group of developed economies with a high
concentration of FGC, their density correlates with
the level of population’s welfare (correlation
coefficient 0.85), and in the group of developing
countries, it does not (the correlation coefficient
0.14). Moreover, groups of countries with a high level
of economic development are also heterogeneous in
terms of the analyzed relationship. For instance, in
economically developed countries with a relatively
low concentration of FGC, the relationship between
the density of FGCs and the level of the country's
wealth and the population’s welfare is negative
(correlation coefficients -0.5 and -0.3, respectively).
In general, the presence of tech FGCs in most
countries does not depend on the size of the economy,
domestic R&D costs, correlates with the level of
population’s welfare and is determined by other
factors related to the specifics of the business
environment of each country, the technological and
entrepreneurial ecosystem. It can also be associated
with the episodic and rather uncertain and
unpredictable nature of high growth in companies.
The analysis showed that there was no linear
relationship between the growth rates of tech FGCs
and the level of the country's wealth, population's
welfare. In high-wealth countries (excluding
Austria), tech FGCs grow at a lower rate than in
relatively low-wealth countries, and vice versa. In the
group of countries with the highest level of
population’s welfare (Norway, Ireland, Iceland,
Sweden), the average growth rates of FGCs are the
lowest. The correlation between the growth rates of
companies' revenue and GDP (PPP) is weak positive,
and between the growth rates of FGCs and GDP per
capita it is weak negative (correlation coefficients are
0.07 and -0.19, respectively).
In practice there is no connection between the
indicators of FGCs development and gross domestic
expenditures on R&D. In countries with a high FGCs
density, indicators of domestic R&D expenditures %
GDP are relatively low, and vice versa (Figure 5). The
analysis shows a low correlation between these
indicators (see Table 3).
However, here, too, the picture is not uniform and
ambiguous. Countries leading in terms of GDP (Italy,
Russia, Turkey) are not experiencing fast growth of
FGCs. High-tech companies develop and grow better
in countries with a high level of GDP and
population’s welfare - Germany, United Kingdom,
Sweden. In some countries, not only high-tech
companies are growing rapidly, but also the country's
wealth and the population’s welfare. The growth rate
of tech FGCs is simultaneously an organic
consequence of the country's economic development
Fast-growing Tech Companies as a Driver of Regional and National Sustainable Economic Development
545
and at the same time actively affects the dynamics of
economic growth but is largely determined by the
internal factors of companies and the characteristics
of the entrepreneurial ecosystem.3.4
Relationship between the Development of
Fast-Growing Tech Companies and Entrepreneurial
Ecosystem
To identify the factors explaining the varying
levels of tech HGFs development in different
countries, a cluster analysis was carried out. HGFs
indicator framework are covers HGFs demographics
and key factors that broadly support or obstruct the
development of HGEs. It supports deriving country-
specific insights related to framework conditions
conducive to the development of HGEs, based on the
findings in the academic literature. Due to the limited
sample, ten indicators were used in the cluster
analysis. Therefore, the indicators do not cover every
single relevant framework condition but relies on
highly correlated indicators: HGFs density, GDP
(PPP) per capita, ICT infrastructure, degree of
customer orientation, technological adoption, country
capacity to retain talent, availability of latest
technologies, venture capital availability,
geographical concentration, undue influence and
corruption. The higher the value of the latter
indicator, the lower the level of corruption in the
country. The cluster analysis results are shown in
Table. 4, graphic visualization in Figure 6.
Table 4: Results of cluster analysis.
Cluster 1
(9 countries)
Cluster 2
(8 countries)
Bulgaria
Greece
Hungary
Poland
Russia
Romania
Serbia
Croatia
Bosnia and
Herzegovina
Spain
Italy
Lithuania
Portugal
Slovenia
Turkey
Slovakia
Czech Republic
Cluster 3
(7 countries)
Cluster 4
(5 countries)
Austria
Belgium
United Kingdom
Germany
Ireland
Netherlands
France
Iceland
Norway
Finland
Sweden
Israel
Cluster
1 2 3 4
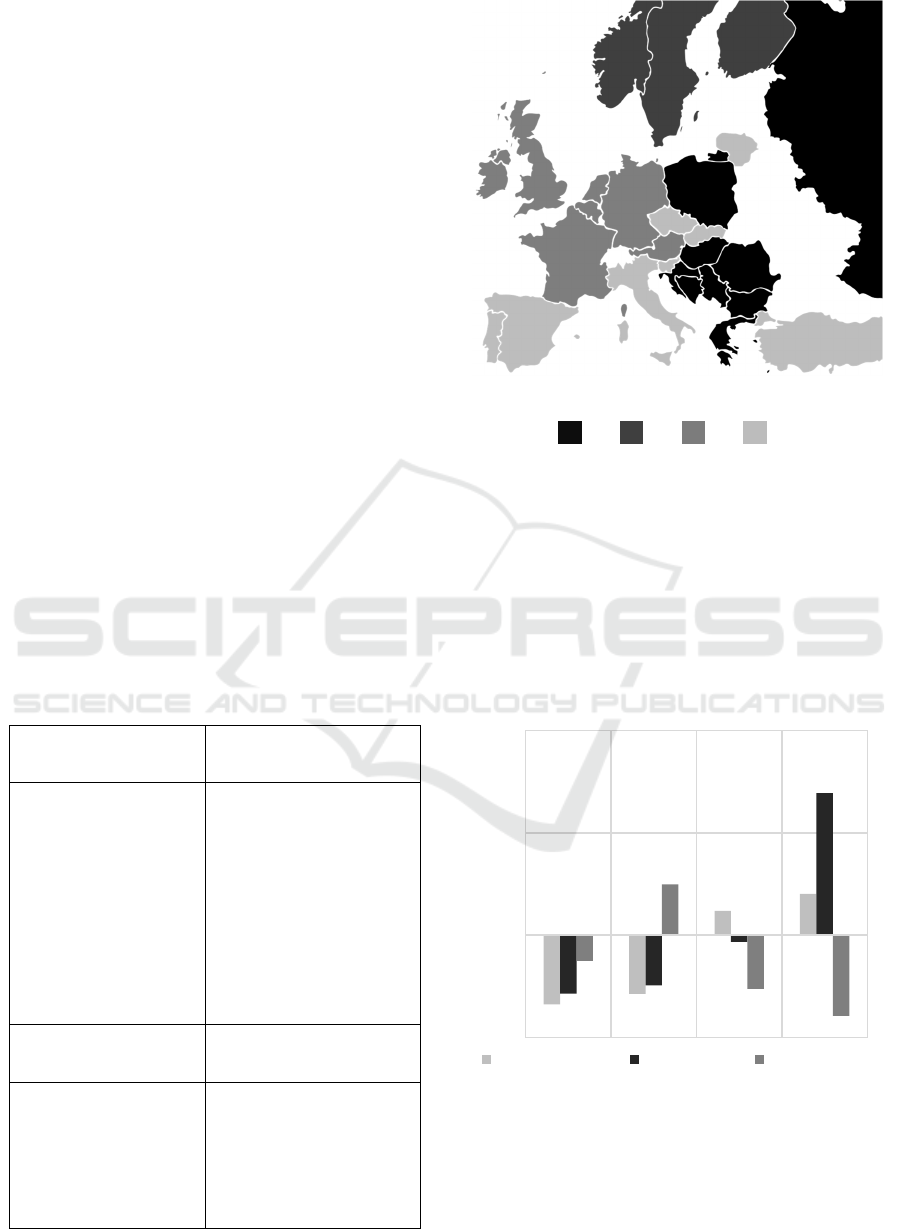
Figure 6: Countries distribution by clusters.
Clusters represent the positions of countries in
terms of the level and dynamics of technological and
economic development, institutional environment
and regulations, infrastructure, efficiency of resource
markets and, as a result, the prevalence and dynamics
of FGCs growth. Figure 7 shows the medians of the
development indicators of FGC in a normalized, way
which permits cross-country comparison.
Figure 7: Development indicators of FGC by clusters.
The curves of the standardized average values of the
indicators included in the analysis for the obtained
clusters are shown in Figure 8.
-1
0
1
2
Cluster 1 Cluster 2 Cluster 3 Cluster 4
Number of HGFs HGFs densit
y
Avera
g
e
g
rowth
ISSDRI 2021 - International Scientific and Practical Conference on Sustainable Development of Regional Infrastructure
546

Cluster
1 2 3 4
Figure 8: Standardized average values of the studied
indicators by clusters.
Clusters 3 and 4 take similar positions. The leader
is cluster 4, which includes the Israel and Nordic
countries with a high level of economic development
and an institutional environment favorable for FGCs
development. The number of technological FGCs and
their density in this cluster is the highest. Cluster 3
leaves the leading position in terms of the analyzed
indicators, with the exception of infrastructure,
geographic concentration and degree of customer
orientation. This cluster joins well developed
countries of Central Europe, which have the highest
rates of economic growth, but the lowest average
annual R&D expenditures. As it was mentioned
above, the gap in growth rates between companies in
clusters 3 and 4 is explained by the large number of
ranking companies from these countries and a wide
range of values of their growth indicators. TOP 10
companies
operate
in the countries included in the 3rd
and 4th clusters.
Clusters 1 and 2, which represent the countries of
Southern, Eastern Europe and Turkey, differ
significantly in all analyzed indicators. In cluster 2,
the values of all indicators are lower than the average
values for the sample - the GDP per capita is one and
a half times lower, the FGCs density is five times
lower. The countries of this cluster have the lowest
share of R&D expenditures in GDP, the lowest value
of population’s welfare and the highest inflation rate.
The level of corruption is raising concerns. The
lowest positions of all indicators are in cluster 1. GDP
indicators are two times lower than the average for
the sample, the level of population’s welfare is almost
three times lower and, as a result, the number and
density of technological FGCs is more than 5 times
lower.
With a high level of technological development
and the population’s welfare, a well-established
infrastructure, a low level of undue influence and
corruption, with the available latest technologies and
venture capital as well as with favorable conditions
for talents and entrepreneurship development. Thus,
the differences in the prevalence and growth
dynamics of tech FGCs in different countries are
explained by the conditions of the institutional
environment and the characteristics of the
entrepreneurial ecosystem.
4 CONCLUSIONS
Tech HGEs bring together a unique group of
characteristics and circumstances and so require a
particular set of framework conditions to support their
development.
A cross-country analysis of the fast-growing tech
companies have shown that such companies are more
prevalent in countries with favorable economic and
institutional conditions than in countries that are
competitive in terms of GDP.
Such companies grow faster in countries with
high rates of economic growth, but there is an
interdependence: higher GDP growth leads to more
growth opportunities for companies and vice versa,
higher growth rates of companies contribute to higher
GDP growth, which confirms the findings of previous
studies (Bosma at al., 2012).
Different groups of countries perform above or
below the sample average; the correlation between
indicators differs significantly across groups of
countries. Certain natural and socio-economic
conditions favor the emergence of fast-growing
companies, but the size of the economy, the level of
the country's wealth, domestic R&D costs, and the
dynamics of the country's economic development are
not the determining factors for the emergence and
growth of tech FGCs. In contrast, there is a link
between the dynamics of the high-tech companies’
growth and the dynamics of the country's wealth
growth, measured by the rate of GDP growth. This
may lead to the conclusion that the growth rate of high
technologies and companies that create and distribute
them, on the one hand, is an organic consequence of
the economic state of the region, on the other hand, it
actively influences economic.
HGFsDensity
GDP(PPP)per
capita
UndueInfluence
andcorruption
ICT
Infrastructure
Technological
adoption
Degreeof
customer
orientation
Country
capacityto
retaintalent
VentureCapital
availability
Availabilityof
latest
technologies
Geographical
concentration
Fast-growing Tech Companies as a Driver of Regional and National Sustainable Economic Development
547

The results of the cluster analysis confirmed the
conclusions mentioned above. The conclusions
mentioned above environmental factors such as
macroeconomic stability, the quality of institutions,
the degree of trust in politicians, ethics and
corruption, infrastructure development, innovation
potential, and the ability of countries to maintain
favorable environment for talents have a significant
impact on the development of the fast-growing tech
companies.
The presented analysis shows the exceptional
importance of tech fast-growing companies, their role
as a dynamic element of the economy. The level of
FGCs development, on the one hand, corresponds to
the local economic environment and the level of
economic well-being and, on the other hand, the
intensity of FGCs actions reflects the dynamics of
economic growth. Tech FGCs are the drivers of
regional and national sustainable economic
development. The underdevelopment (both spatial
and intensive) of these companies means the weak
development of the regional economy.
5 FUNDING
The research was carried out according to IEIE SB
RAS research plan, project 5.6.1.5. (0260-2021-
0003) "Theory and methodology of researching
sustainable development of high-tech and
knowledge-intensive sectors of the economy in the
context of global challenges of the external
environment, technological, organizational and
institutional shifts."
REFERENCES
Coad, A., Daunfeldt, S., Hoelzly, W., Johansson, D.,
Nightingale (2014) High-growth firms: introduction to
the special section. Industrial and Corporate Change,
23 (1): 91–112. https://doi.org/10.1093/icc/dtt052
Bravo-Boscia, A., Criscuolo, C. and Menon, C. (2013).
What drives the dynamics of business growth? OECD
science, technology and industry, paper 1, Nesta, Р. 90.
https://doi.org/10.1787/5k486qtttq46-en
Autio, E. (2009). The Finnish paradox: The curious absence
of high-growth entrepreneurship in Finland. Discussion
Papers, 1197.
Colombelli, A., Krafft, J. and Quartaro, F. (2014). High-
growth firms and technological knowledge: Do gazelles
follow exploration or exploitation strategies? Industrial
and Corporate Change, 23(1): 261–291.
https://doi.org/10.1093/icc/dtt053
Mason, C. and Brown, R. (2010). High growth firms in
Scotland. Research report, Glasgow: Scottish
Enterprise, p. 67
Du, J. and Temouri, Y. (2015). High-growth firms and
productivity: Evidence from the United Kingdom.
Small Business Economics, 44(1): 123–143. DOI:
10.1007/s11187-014-9584-2
Moreno, F. and Coad, A. (2015). High-Growth Firms:
Stylized Facts and Conflicting Results. SWPS 2015-05.
http://dx.doi.org/10.2139/ssrn.2743181
European Commission, 2019 Eurostat - High-tech industry
and knowledge - intensive services (htec).
Luxembourg.
Bosma, N. and Stam, E. (2012). Local Policies for High-
Employment Growth Enterprises. OECD Report High-
growth firms: local determinants. Copenhagen, p. 27.
Teruel, M. and De Wit, G. (2011). Determinants of high-
growth firms: Why have some countries more high-
growth firms than others? Working Papers
2072/179670, p. 24 DOI:
10.4337/9781783472666.00010
Nightingale, P. and Coad, A. (2014). Muppets and gazelles:
Political and methodological biases in entrepreneurship
research. Industrial and Corporate Change, 23(1): 113-
143. https://doi.org/10.1093/icc/dtt057
Lia, М., Goetzb, S., Partridgec, M. and Fleming, D. (2016).
Location Determinants of High-Growth Firms.
Entrepreneurship and Regional Development, 28(1-2):
97-125.
https://doi.org/10.1080/08985626.2015.1109003
Ismail, S, Malone, М., Yuri van Geest and Diamandis, P.
(2017). Exponential Organizations: Why New
Organizations Are Ten Times Better, Faster, Cheaper
Than Yours (and What to Do About It). Moscow:
Alpina Pablisher, p. 393.
Deloitte, 2016 Technology Fast 500™ Meet the growth-
makers. Annual ranking of the fastest-growing
technology companies in Europe, Middle East and
Africa (EMEA). URL:
https://www2.deloitte.com/content/dam/Deloitte/globa
l/Documents/About-Deloitte/central-
europe/Deloitte%20Tech%20Fast%20500%20EMEA
%202016%20Ranking.pdf
Dzyubenko, I.B. and Dzyubenko, A.S. (2018). New models
of high-tech business: exponential organizations.
Moscow Economic Journal, 5: 188-211. DOI:
10.24411/2413-046Х-2018-15042
ISSDRI 2021 - International Scientific and Practical Conference on Sustainable Development of Regional Infrastructure
548
