
Sustainable Development and Investment Policy
(on the Example of the USA)
Boris Lavrovskii
1,2 a
1
Novosibirsk State Technical University, Novosibirsk, Russia
2
The Institute of Economics and Industrial Engineering within the Siberian Branch of the Russian Academy of Sciences
Novosibirsk, Russia
Keywords: Investment Policy, Macroeconomic Dynamics, Fixed Assets, Special Period, Labor Productivity, USA.
Abstract: It is well known that the overwhelming number of countries with a developed market in the period from the
early to mid-1970s to the present is characterized by a tendency towards a reduction in the cumulative average
annual growth rate of per capita GDP. However, no earlier than the mid-1980s and no later than the mid-
2000s, a specific (special) period of time with a gentle line of cumulative dynamics emerged. As for the United
States and only for this period, the article also provides an illustration of the predominant growth of GDP in
relation to fixed capital. After the end of the special period, the dynamics everywhere again sharply weakens.
The article is devoted to the study of the phenomenon of a special period on the example of the United States.
It is shown that the stabilization of the growth rate of labor productivity in the considered period of time is
associated with the dynamics of specific capital requirements. In turn, it was revealed that the factor
influencing the amount of capital requirements, and, thereby, the dynamics of productivity is the intellectual
component of investment. Thus, the nature of the special period, the predominant growth of the product
relative to fixed capital in the United States during approximately 1980-1990s, is to a certain extent clarified.
1 INTRODUCTION. STATEMENT
OF A QUESTION
As is known, since the late 1960s and early 1970s,
practically in all developed countries there has been a
clear tendency towards a weakening of economic
dynamics. The downtrend is not, however,
monotonous. At a certain stage (not earlier than the
mid-1980s and not later than the mid-2000s), the
indicated trend is interrupted, the cumulative (with a
base, for example, 1970), average annual GDP
growth rates stabilize or even slightly increase.
This period can be considered "special". This
article attempts to investigate its nature using the
example of the United States.
2 SPECIAL PERIOD
The period of time with a relatively stable dynamics
of per capita GDP between phases with a declining
a
https://orcid.org/0000-0001-9452-5649
trend, we called a special period. It turned out that the
presence of such a period is characteristic of most
developed countries (Table 1).
Table 1. Cumulative average annual growth rates of GDP
per capita by periods in developed market countries (GDP
per capita, constant 2010 US$)*
Austria
(1995-2008)
Netherlands
(1991-2009)
1971-
1994
1971-
2008
1971-
2019
1971-
1990
1971-
2009
1971-
2019
2,5
2,4
2,0 1,9
1,9
1,7
Luxembourg
(1990-2007)
Norway
(1992-2001)
1971-
1989
1971-
2007
1971-
2019
1971-
1991
1971-
2001
1971-
2019
3,1 3,2 2,40 3,1 3,1 2,2
Belgium
(1997-2008)
Portugal
(1987-2008)
1971-
1996
1971-
2008
1971-
2019
1971-
1986
1971-
2008
1971-
2019
446
Lavrovskii, B.
Sustainable Development and Investment Policy (on the Example of the USA).
DOI: 10.5220/0010592104460451
In Proceedings of the International Scientific and Practical Conference on Sustainable Development of Regional Infrastructure (ISSDRI 2021), pages 446-451
ISBN: 978-989-758-519-7
Copyright
c
2021 by SCITEPRESS – Science and Technology Publications, Lda. All rights reserved

2,2 2,2 1,8 2,6
2,6
2,1
Greece
(1988-2010)
Singapore
(2003-2010)
1971-
1987
1971-
2010
1971-
2019
1971-
2002
1971-
2010
1971-
2019
1,8
1,8
1,2 5,1
5,0
4,5
Denmark
(1985-1997)
United States
(1985-2007гг.)
1971-
1984
1971-
1997
1971-
2019
1971-
1984
1971-
2007
1971-
2019
2,0
2,0
1,6 2,1
2,1
1,8
Israel
(1985-2007)
United Kingdom
(1988-2007)
1971-
1984
1971-
2007
1971-
2019
1971-
1987
1971-
2007
1971-
2019
2,1
2,1
1,9
2,3
2,3
1,8
Spain
(1989-2007)
France
(1994-2001)
1971-
1988
1971-
2007
1971-
2019
1971-
1993
1971-
2001
1971-
2019
2,4
2,4
1,9
2,2
2,2
1,6
Italy
(1983-1991)
Finland
(2000-2008)
1971-
1982
1971-
1991
1971-
2019
1971-
1999
1971-
2008
1971-
2019
2,8
2,8
1,4
2,6 2,7 2,0
Canada
(1985-2007)
Sweden
(1990-2007)
1971-
1984
1971-
2007
1971-
2019
1971-
1989
1971-
2007
1971-
2019
2,1
2,1
1,7
1,9
1,9
1,6
Korea, Rep.
(1983-2003)
Germany
(1995-2001)
1971-
1982
1971-
2003
1971-
2019
1971-
1994
1971-
2001
1971-
2019
7,2
7,2
5,8
2,3
2,2
1,8
Switzerland
(1989-2008)
1971-
1988
1971-
2008
1971-
2019
1,1
1,1
1,0
* The boundaries of the special period are indicated in
brackets.
In a number of developed countries, for example,
Australia and Japan, the presence of a special period
has not been revealed. In all cases, the cumulative
average annual growth rate of GDP per capita during
the special period is comparable to the analogous
indicator prevailing before it began. In some
countries, the average annual growth rate of GDP per
capita in a special period is slightly lower than the
indicators that existed before it began (Singapore,
Germany), in Finland - slightly higher. But the
"second wind" is not eternal, and after the end of the
special period, the pace has sharply decreased
everywhere.
We tend to associate the nature of the special
period with the computer information boom that
began approximately in the mid-1980s. The positive
impact of computer technology has manifested itself
in almost every developed country. The new local
trend usually lasted for about 10-20 years and ended
most often by the middle - end of the 2000s. Earlier
than all other countries, opposition to the global trend
towards weakening economic dynamics manifested
itself in the USA, Denmark, Israel, Italy, Canada,
Rep. Korea. This phenomenon has manifested itself
en masse since the late 1980s, early-mid 1990s
(second wave).
The first bell, indicating the end of a special
period, rang in 2000 and was connected, apparently,
with the global financial crisis, when the shares of,
first of all, high-tech companies literally collapsed.
The inertia associated with the influence of computer
technology, however, continued until 2008. World
financial and economic crisis 2008-2009 put the last
points over the i.
With regard to countries with emerging markets,
there is no need to talk about a certain special period.
However, in most of these countries, over the past two
to three decades, economic development has ceased
to be chaotic. It has become more orderly,
characterized by an increasing rate of growth in GDP
per capita. In different countries, growth began in
different years, but, as a rule, not earlier than the
beginning, the mid-1990s. And it continued until the
end of the period under review. It is possible that
these two to three decades were necessary to provide
susceptibility to the results of the computer
revolution.
3 STAGES OF ECONOMIC
GROWTH IN THE USA
The ratio of indicators of the dynamics of GDP and
fixed production capital, its change over time can give
a certain idea of the characteristic features of
Sustainable Development and Investment Policy (on the Example of the USA)
447
economic growth, extensive or intensive type of
development. Data for the USA are presented in Fig.
1.
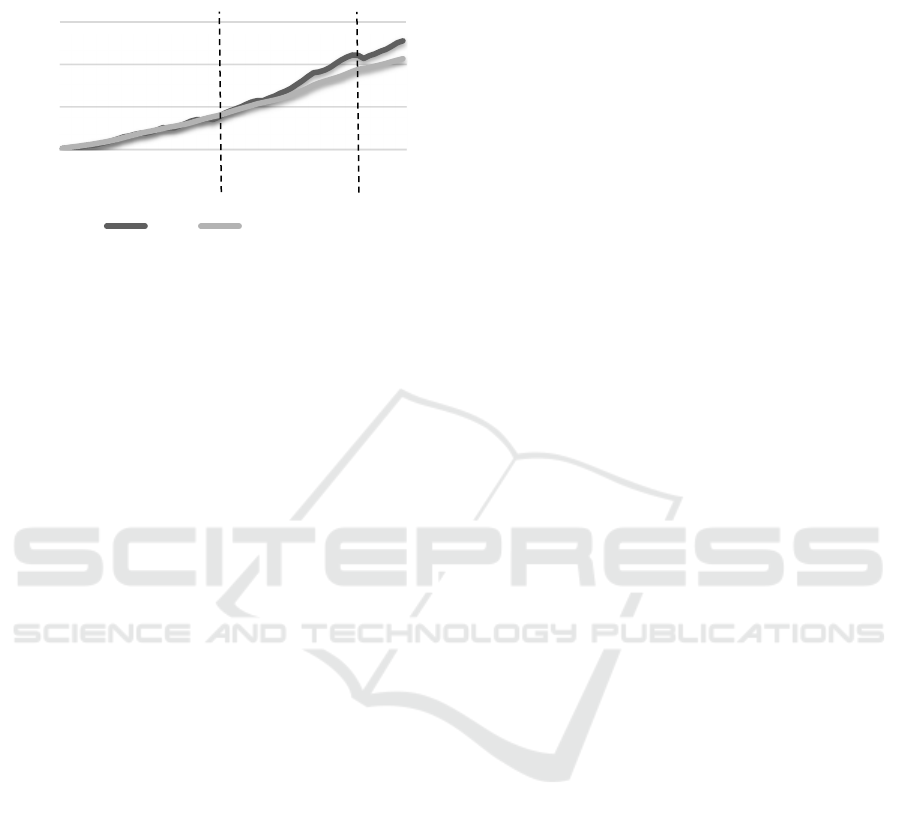
Figure 1: Growth index of GDP and fixed assets (constant
2009 US$),%, 1955-100.
Until the mid-1980s, the production base and
product release developed almost synchronously,
indicating an extensive type of development. In the
next 20 years or so, there has been a predominant
dynamics of GDP relative to fixed capital, which is a
sign of intensive growth. Since about the middle of
the 2000s, the growth rates of both indicators have
practically equalized again.
The phenomenon of predominant product growth
is the subject of further analysis.
4 DECOMPOSITION OF
PRODUCTIVITY DYNAMICS
INTO EXTENSIVE AND
INTENSIVE COMPONENTS
Qualitative characteristics of the production
apparatus (PA) measured by numerous technical and
economic indicators reflecting its specific aspects and
properties. We associate the consolidated generalized
assessment of the quality of PA at the macroeconomic
level with the indicator of labor productivity. The
higher this indicator, the higher the level of
technological perfection of the PA.
The restructuring of the PA, the replacement of
obsolete fixed assets can be carried out on the basis
of two types of technologies, each of which ensures
productivity growth. The difference between the
types consists in the ratio of the productivity of the
equipment supplied for replacement and its cost,
more precisely, the value of the specific investment.
In one case, these are breakthrough technologies with
specific investments that are fundamentally better
than those being replaced; in the other, they are
modern ordinary technologies with a ratio of cost and
productivity similar to replaceable methods of
production.
If the worker's labor productivity increases less or
approximately to the extent of the increase in the cost
of his workplace (capital-labor ratio), then it is natural
to attribute this growth to ordinary technologies.
These technologies are based on routine R&D,
knowledge mainly of yesterday. Replacing obsolete
assets with conventional technologies increases
productivity, but at best maintains the same capital
intensity (сapital productivity). Higher growth rates
of productivity in relation to capital-labor ratio are
due to the phenomenon of breakthrough technologies
that have fundamentally better technical and
economic parameters. This type of technology
provides an increase in both productivity and capital
productivity; generated by fundamental R&D, new
knowledge.
The idea of measuring the measure of
innovativeness of the PA modernization project is to
try to decompose the increase in labor productivity
into extensive and intensive (innovative) factors that
generate it. On the one hand, this is an increase in
fixed capital (capital-labor ratio), on the other, a
change in its qualitative components, that is, the
volume of product per unit of fixed capital (capital
productivity).
At the operational level, the measurement of the
innovation component within the framework of the
considered approach is associated with the dynamics
of capital productivity. An assessment of the intensity
of innovative activity is considered to be the part of
the increase in productivity due to the dynamics of
capital productivity. The more productivity growth
exceeds growth of the capital-labor ratio, the higher
the level (scale) of innovation, the role and
importance of the innovation factor.
As is known, labor productivity index can be
expressed as multiplication of the capital-labor ratio
and the capital productivity indices:
cprclpr
III
,
(1)
where is the labor productivity index, is the
capital-labor ratio and is the capital productivity
index.
For the case of continuous time, taking the
logarithm of equation (1), we obtain:
cprclpr
III lnlnln
,
(2)
Thus, the productivity index is presented as the
sum of the capital-labor and capital-productivity
indices. On the basis of relation (2), it is possible to
single out a part of the rate of productivity growth due
to a change in capital productivity:
100
300
500
700
1955
1960
1965
1970
1975
1980
1985
1990
1995
2000
2005
2010
2015
GDP Fixedassets
ISSDRI 2021 - International Scientific and Practical Conference on Sustainable Development of Regional Infrastructure
448

pr
cpr
in
I
I
ln
ln
, (3)
Within the framework of this approach, the
parameter will be considered an estimate of the
intensity of innovative activity.
So, the positive growth rates of capital
productivity and capital-labor ratio make it possible
to "naturally" decompose the increase in labor
productivity into factors that explain it, without any
remainder. Negative growth rates of capital
productivity, testifying to the predominant growth
rates of capital-labor ratio relative to the dynamics of
labor productivity, lead to a parameter value less than
zero.
An important note is as follows. A negative value
does not necessarily mean that there is essentially no
innovation activity. Apparently, the following
statement will be true: a positive value of the
parameter is sufficient, but not a necessary condition
for the presence of innovative activity.
Using this technique, we present data that give
some idea of the nature of the reproduction process in
the United States, the role of the innovation factor
(formula 3) already in certain quantitative estimates
(table 2).
Table 2. Share in total productivity growth due to increased capital productivity (assessment of the intensity of innovative
activity) by periods ( 2009 US$),%
Base yea
r
1955 1985 2005
Perio
d
1956-1985 1956-2005 1956-2016 1986-2005 1986-2016 2006-2016
Value
in
2,6 17,8 15,0 41,2 29,5 -7,6
It turned out that in general for the period 1956-
2016. approximately 85% of the productivity gain is
due to investments based on routine, 15% - on
fundamental research and development. It is also
possible to assert with certainty about the presence of
a special twenty-year period of time, which had a
decisive influence on the picture of the reproductive
process over the entire more than half a century. In
1986-2005. more than 40% increase in productivity is
achieved due to advanced technologies; of providing
a significant advantage in the growth of labor
productivity over the ratio of capital and labor.
5 THE NATURE OF
INNOVATION. THE ROLE OF
THE INTELLECTUAL
PRODUCT
Consider an approach to studying the nature of the
growth of capital productivity. As you know, in the
fundamental Harrod-Domar equation, economic
dynamics is functionally linked to the rate of
accumulation and the marginal capital intensity
(capital ratio):
Y
I
Y
I
G
:
, (4)
where G - GDP growth rate, I - investments , Y -
GDP,
Y
- GDP increase.
By analogy with this equation, we represent the
increase in labor productivity
P
r
as a function of
the volume of specific investments (for the creation
of one job)
,1
I
for the period [1,
] and the
indicator
,1
E
, which we call normalized investments
for the period [1,
]:
,1
:
,1
Pr EI
, (5)
where
P
r
=
P
r
-
0
P
r
;
,1
I
=
1
1
i
i
i
i
L
I
;
,1
E
=
1
1
i
i
i
i
L
I
:(
P
r
-
0
P
r
)
=1,…,
T
,
Designations:
P
r
- labor productivity in year;
0
P
r
- labor productivity in the base year 0;
i
I
- gross
production investment in year i;
i
L
- the number of
people employed in year i.
Sustainable Development and Investment Policy (on the Example of the USA)
449
The parameter
,1
E
is interpreted as the need for
capital for the growth of labor productivity of the unit
intensity; answers the question of how many dollars
of production investment is required over a certain
period to equip one workplace in order to increase the
worker's productivity per unit during the period. In
what follows, for brevity, the dimensionless
parameter will be called "normalized investment" or
"capital requirement".
Data on the dynamics of labor productivity and
normalized investment are presented in Fig. 2.
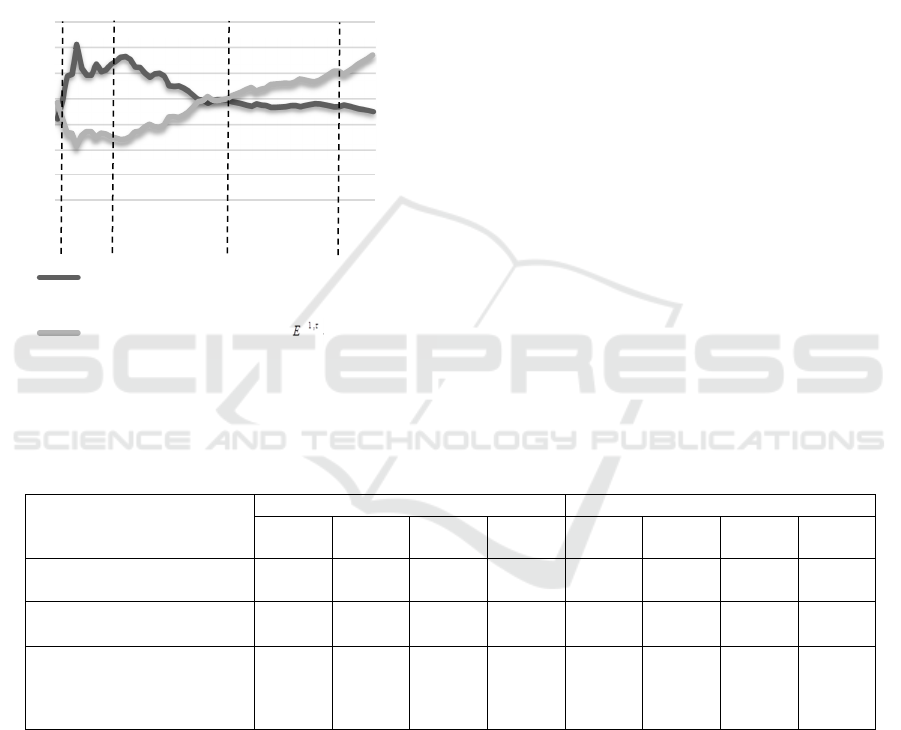
Figure 2: Dynamics of labor productivity and normalized
investment (2009 US$),%, base 1950
In fig. 2, the relationship between the cumulative
indicators of normalized investments and the
cumulative dynamics of labor productivity is clearly
visible. In particular, the decrease in the cumulative
capital requirement in 1951-1955. accompanied by
an increase in cumulative productivity growth; to the
period of significant growth in the cumulative
indicators of normalized investment from the mid-
1960s to the early 1980s corresponds to a noticeable
decrease in the cumulative rates of productivity
growth, etc. Thus, it is likely that the relationship
between changes in capital requirements and
productivity growth rates is reversed.
In turn, it is appropriate to assume that the factor
influencing the amount of capital demand, and,
thereby, the dynamics of productivity, is the
intellectual component of investment (table 3).
Table 3: Dynamics of labor productivity and parameters that generate it by periods
Indicators Fixed base Variable base
1951-
1965
1951-
1982
1951-
2003
1951-
2016
1951-
1965
1966-
1982
1983-
2003
2004-
2016
Average annual increase
rate of labor productivity,%
2,8 1,9 1,9 1,7 2,8 1,1 1,8 1,2
Parameter value
,1
E
4,1 7,0 8,0 9,8 4,1 11,2 8,0 14,1
Increase in the share of an
intellectual product in
production investments in
average annual terms, p.p.
0,74 0,35 0,43 0,37 0,74 0,03 0,48 0,19
During 1966-1982. the share of the intellectual
product in production investments remained
practically unchanged. The consequence was a sharp
increase in the value of the parameter
,1
E
- from 4,1
in 1951-1965. up to 11,2 in 1966-1982 and, thus, a
reduction in the average annual increase rate of labor
productivity (2,8% and 1,1%, respectively). A
significant increase in the share of an intellectual
product in production investments in 1983-2003.
(0.48 pp on average per year) created the conditions
for reducing the parameter
,1
E
to 8,0 and raising the
average annual increase rate of labor productivity to
1,8%. Modest and unstable growth of the intellectual
product in 2004-2016. proved insufficient to
withstand a significant increase in capital
requirements. The performance momentum has
weakened again.
Thus, the nature of the special period, the
predominant growth of the product relative to fixed
0,0
2,0
4,0
6,0
8,0
10,0
12,0
0,0
0,5
1,0
1,5
2,0
2,5
3,0
3,5
1951
1956
1961
1966
1971
1976
1981
1986
1991
1996
2001
2006
2011
2016
Averageannualincreaserateoflabor
productivity,%‐leftscale
Normalizedinvestment‐rightscale
ISSDRI 2021 - International Scientific and Practical Conference on Sustainable Development of Regional Infrastructure
450

capital in the United States during approximately
1980-1990s, is to a certain extent clarified.
6 THE DISCUSSION OF THE
RESULTS
It is believed that overcoming the long-term negative
trend in the development of the US economy is
associated with the neoconservative policy of
President Reagan (Reaganomics). It cannot be denied
at the same time that this policy was carried out
during the years of the computer revolution. Its
economic consequences in terms of innovative
development manifested themselves in a more
favorable dynamics of specific investments than
before. With the accumulation rate practically
unchanged, it became possible to accelerate labor
productivity and macroeconomic growth.
A little later than in the United States, the positive
fruits of computer technology manifested in most of
the developed countries of the world. After the crisis
of 2008-2009. The “computer rent” was exhausted,
and the developed countries returned to the trajectory
of declining growth.
An important further task is to assess the specific
indicators that have given rise to a special period in
most developed countries, not just the United States.
7 CONCLUSION
Macroeconomic dynamics in the United States
closely correlates with changes in the indicator
characterizing the need for capital. In turn, the value
of this need is apparently determined by the share of
the intellectual product in production investments.
We tend to associate the nature of the special period
in the United States and other developed countries
with the computer-information boom of the 1980s
and 1990s. The positive impact of computer
technology has manifested itself in almost all of them,
although to varying degrees.
The first bell, indicating the end of a special
period, rang in 2000 and was connected, apparently,
with the global financial crisis, when the shares of,
first of all, high-tech companies literally collapsed.
The inertia associated with the influence of computer
technology, however, continued until 2008. World
financial and economic crisis of 2008-2009 placed the
last points over the i.
ACKNOWLEDGEMENTS
The article was prepared within the framework of the
project "Socio-economic development of Asian
Russia based on the synergy of transport accessibility,
systemic knowledge of the natural resource potential,
the expanding space of interregional interactions",
Agreement number with the Ministry of Science and
Education No. 075-15-2020-804.
REFERENCES
A Strategy for American Innovation: Securing our
Economic Growth and Prosperity. Washington, DC,
February 2011.
A Strategy for American Innovation: Securing our
Economic Growth and Prosperity. Washington, DC,
February 2011.
Bureau of Economic Analysis.
https://apps.bea.gov/iTable/iTable.cfm?reqid=19&step
=2#reqid=19&step=2&isuri=1&1921=survey
Harrod, R. (2008). Economic dynamics theory. The Central
Economic Mathematical Institute of the Russian
Academy of Sciences Publ, 210 p.
Lavrovskii, B. (2020).Intellectual product as factor of
economic growth. Proceedings "Theoretical problems
in innovations", "Innovation policy and innovation
management."Innovative Solutions", Scientific-
Technical Union of Mechanical Engineering Industry-
4.0, 1(4):22-24.
Lavrovskii, B. L. (2018). Assessment of Innovation
Intensity: the Case of USA, Economy of Region,
14(1):281-291.
National Security Strategy of the United States of America.
December (2017). https://www.whitehouse.gov/wp-
content/uploads/2017/12/NSS-Final12-18-2017-
0905.pdf. Cited April 15, 2020
Supyan, V. B. US economy in a polycentric world:
prospects for maintaining positions.
https://interaffairs.ru/jauthor/material/2345
Suslov, V., Baranov, A., Lavrovskii, B. (2017).
Macroeconomic Model of the Scientific-Technological
Progress. 2017 10th International Conference
"Management of Large-Scale System Development"
(MLSD). DOI: 10.1109/MLSD.2017.8109692
Varnavskij, V.G. (2018). The role of the United States in
world industry and trade as a global problem. Contours
of global transformations: politics, economics, law,
11(2):100-112. DOI: 10.23932/2542-0240-2018-11-2-
100-112
Voytolovskiy, F.G., Kirichenko, E.V. (2016). SSHA:
vozmozhnosti i predely ekonomicheskogo i
politicheskogo liderstva, T.1, IMEMO RAN, 240 s.
Word Development Indicator (WDI). URL:
https://databank.worldbank.org/source/ world-
development-indicators
Sustainable Development and Investment Policy (on the Example of the USA)
451
