
Determination of the Risk of Deviation of an Event from the
Mathematical Expectation in the Management of Regional
Development
Vitaly Sergeevich Borovik
1a
, Vitaly Vitalievich Borovik
2b
and Alexandra Vitalievna Borovik
3c
1
Volgograd Science and Technology Center, Volgograd, Russia
2
Department of Capital Construction of the State Public Institution of Volgograd Region "Directorate of Highways"
Volgograd, Russia
3
Institute of Architecture and Engineering, Volgograd State Technical University, Volgograd, Russia
Keywords: Management, Risk, Time, Scientific Research.
Abstract: The paper analyses various time segments of a random process and shows how the covariance of the values
of random functions for different times is displays. It is accepted that any type of management involves the
optimal use of factors, avoiding the uncertainties that are inevitable with a statistical approach to the
sequencing of scientific research. The model includes the risk minimization of the real process deviation from
the anticipated one. The concept of the quasi-ergodic idea of two functions, which characterize this concept
with the corresponding form of integrals, is important for a further understanding of the presented theory.
Various time segment of a random process are analyzed during the scientific research, and it is shown how
the covariance of random functions’ values for times is manifested. The suggested model allows us to expand
the boundaries of research automation of management process in space and time, taking into account the risk
associated with the use of factors of the digital model.
1 INTRODUCTION
It was established that it is possible to build the
sequence of management strategy of scientific search
on the basis of a digital model, which creates the
prerequisites for the automation of research activities,
a significant increase in the effectiveness of scientific
and technological development. A digital model is
formed from a combination of statistical information
that reflects the retrospective results of the process
under analysis, the interdependence of targets and
factors.
Visualization of the digital model allows us to
illustrate the construction of various variants of
management strategy for the solution of the problem
and determine the best option which is considered to
be as the shortest distance between the isoquants of
the surface described by the digital model (Prokhorov
and Kulikovskikh, 2016), (Prokhorov et al., 1995),
a
https://orcid.org/0000-0002-8845-9339
b
https://orcid.org/0000-0002-2409-4078
c
https://orcid.org/ 0000-0002-1533-1721
(Mikheeva, 2007), (Borovik et al., 2014), (Borovik,
V.S and Borovik, V.V., 2016).
Regardless of the causes of the risk, deviations of
the characteristics of research process from the given
parameters, each agent seeks to reduce the possible
losses associated with the implementation of this risk
by making managerial decisions. The risk prediction
which is based on its acceptable values for making
unambiguous management decisions concerning the
process under analysis in space and time is a very
urgent task (Borovik et al., 2014), (Borovik, V.S and
Borovik, V.V., 2016), (Borovik et al., 2018),
(Borovik, V.S and Borovik, V.V., 2020).
The risk management is not an instantaneous act,
but it should be included into the general managerial
decision-making process. When setting optimization
problems, along with the criteria, the restrictions are
expected to be set on the parameters and process
variables, i.e. the permissible variations that
determine the functioning of the process (Borovik, V.
Borovik, V., Borovik, V. and Borovik, A.
Determination of the Risk of Deviation of an Event from the Mathematical Expectation in the Management of Regional Development.
DOI: 10.5220/0010591404070413
In Proceedings of the International Scientific and Practical Conference on Sustainable Development of Regional Infrastructure (ISSDRI 2021), pages 407-413
ISBN: 978-989-758-519-7
Copyright
c
2021 by SCITEPRESS – Science and Technology Publications, Lda. All rights reserved
407

and Borovik, A., 2019). The achievement of
objectives obtained by means of functions'
performance. In the management of research the
computing equipment has the tasks of accounting and
monitoring the achievement of the given parameters,
starting and stopping the solution of the problem,
maintaining the given operating mode of the
equipment and stabilizing the given parameters. The
main difference of the approach under consideration
is that the digital model based on the statistical data
of the process under analysis is the basis of risk
management.
The problem is that the existing management
system of the research process does not meet the
requirements and accuracy opportunities that allow
the process to be carried out automatically.
The aim of the study is to substantiate the
determination of the risk of deviation of an event from
the mathematical expectation when managing the
research process in accordance with the regional
development strategy.
Research objectives:
1. To establish a control criterion for an automated
scientific search system.
2. To highlight the quasi-ergodicity of the process
through the manifestation of the covariance of the
values of random functions for different time
segments.
2 RESEARCH METHODOLOGY
The largest companies in the world including NASA
use the 4-D System. It allows measuring the team
capabilities and people behavior that affect team
performance and risk management. The 4-D system
shows how to improve the performance of business
and projects, and it is especially in demand in multi-
level large-scale projects and assignments, as well as
in complex or critical situations. An automated
research management system is a person-machine
control system that provides automated collection and
processing of information necessary for the
optimization of the management of a production
facility in accordance with the accepted criterion.
The ratio that characterizes the quality of the
managemed object as a whole and takes specific
numerical values depending on the managerial
actions which are used is taken as the control criterion
of an automated system of scientific search. It is
proposed to conduct the planning on the basis of the
theory of random processes, which allows the use of
representative statistics that reflect the vast majority
of external and internal processes taking into account
the object of risk management. The design calculation
of reliability is part of the mandatory work ensuring
the reliability of any automated system and is based
on the requirements of regulatory and technical
documentation (Prokhorov, 2007).
The assumption is made that for a given sample
size, the risk cannot be less than some R0 (for
example, 5%). It is necessary to achieve a narrowing
of the control area (relative to the mathematical
expectation of a random process) to the interval [-;
], which greatly facilitates the management, helps
avoiding unforeseen risks. For the control in space
and time, time segments and control parameters are
indicated, which allows automating significantly the
control process.
3 RESEARCH RESULTS
We introduce the concept of quasi - ergodicity of two
functions, which is important for a further
understanding of the presented theory, characterizing
this concept only by the form of integral
Figure 1.
b
a
dttf
ab
)(
1
means that for any two random processes
)(tfy
i
and
)(tfy
j
the condition is fulfilled
)1(,1
)(
2
1
)(
2
1
dttf
t
dttf
t
t
t
j
t
t
i
i.e. the ratio of the mathematical expectations of
any two random processes on the same interval [-t, t]
are equal to one another.
Obviously, the formula (1) is also valid for the
interval [0; t], i.e.
,1
)(
1
)(
1
0
0
dttf
t
dttf
t
t
j
t
i
Since mathematical expectations are equal for an
ergodic process at all equal intervals, for example, for
functions
3
2
2
ty
and y = t
2
, then the ratio of
their mathematical expectations is:
ISSDRI 2021 - International Scientific and Practical Conference on Sustainable Development of Regional Infrastructure
408
.1
3
1
3
2
3
2
1
1
)
3
2
(
1
1
1
0
2
1
0
2
dtt
dtt
Figure 1 shows an illustration of quasi-ergodicity
only from integrals of the type
b
a
dttf
ab
)(
1
.
For the functions of a random type, the integrals
of the mean values of the functions on the same
interval are equal, i.e. the mathematical expectations
are equal.
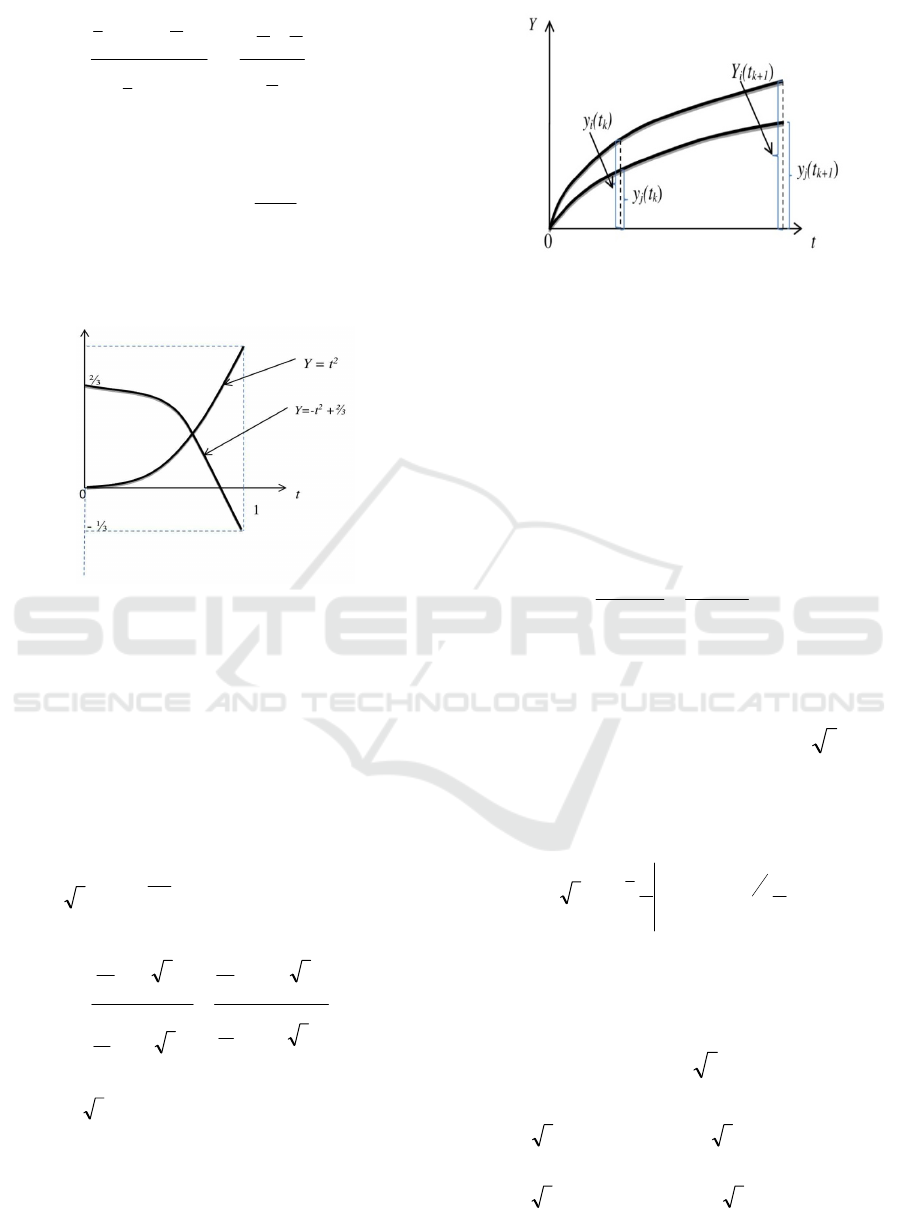
Figure 1: Quasi-ergodicity of the process, indicating the
dependence only on average mean values of the functions y
= f(t) on the interval [а; b], regardless of the shape of the
curves.
4 DISCUSSION OF THE
RESULTS
It should be noted that all possible implementations
of the random process under consideration are
described by a function, for example, of type
nitCy
ii
,1, . We introduce this function
into the function (1) on the intervals [0, t
1
] and [0, t
2
].
1
0
1
2
0
2
1
0
1
2
0
2
1
1
1
1
t
dttC
t
t
dttC
t
dt
t
tC
t
dt
t
tC
t
MO
MO
j
i
(2)
Where, С
МО
- management coefficient
,tCy
МО
which describes the mathematical
expectation of the curve of a random process.
The validity of formula (2) becomes obvious if we
reduce the constants С
i
and С
МО
and the same
multipliers in the left and right sides of formula (2).
Figure 2: Quasi-ergodicity of the process through the
manifestation of covariance of the values of random
functions for various time segments.
By way of analogy with formula (1), we call a
random such a process which has quasi-ergodic
characteristics (Fig. 2). It should be noted that an
additional justification for this term is given by the
fact that formula (2) implies formula (1) accurate to a
numerical factor.
Let’s take
)(
1
tfy
i
and
)(tfy
jj
as two
random processes. Then for any time segments t
k
and
t
k+1
we have:
)(
(
)(
)(
)11
ki
ki
kj
kj
ty
ty
ty
ty
, at i≠j. (3)
Since we will analyze various further time
segments of a random process, we will show how the
covariance of the values of random functions for
different times is shown. In the scientific research [7],
we obtained a function
ttX 7,886)(
1
, that
describes the intensity of factor Х
1
consumption over
time. In all calculations, the time associated with Х
1
,
is analyzed, i.e. t
1.
Let’s find the integral,
,8689
3
2
67,886
3
2
7,886
3
2
6
0
3
2
6
0
tdtt
and
it coincides with the mathematical expectation of a
random variable given by the first column of the table
given below (segment t=6). The time in months is 6
and it is a planned deadline for the work. We similarly
define the integral
dtt
5
0
7,886
=6608,7;
;8,47287,886
4
0
dtt 4,30717,886
3
0
dtt
9,16717,886
2
0
dtt
;
.1,5917,886
1
0
dtt
Determination of the Risk of Deviation of an Event from the Mathematical Expectation in the Management of Regional Development
409
In all calculations, the time associated with Х
1
, is
analyzed, i.e. t
1.
Then we define the coefficients of quasi-
ergodicity, i.e. the ratio of the time segments of the
mathematical expectation of the random process of
consumption of factor Х
1
under consideration. The
meaning of these coefficients is seen from their
definition:
)4(.
)(
)(
0
1
0
1
,
n
m
nm
dttX
dttX
K
Let us show how this formula is used. We found
all the necessary integrals. So:
;314,1
7,6608
8689
)(
)(
5
0
1
6
0
1
5,6
dttX
dttX
K
;397,1
8,4728
7,6608
)(
)(
4
0
1
5
0
1
4,5
dttX
dttX
K
;54,1
4,3071
8,4728
)(
)(
3
0
1
4
0
1
3,4
dttX
dttX
K
;837,1
9,1671
4,3071
)(
)(
2
0
1
3
0
1
2,3
dttX
dttX
K
.828,2
1,591
9,1671
)(
)(
1
0
1
2
0
1
1,2
dttX
dttX
K
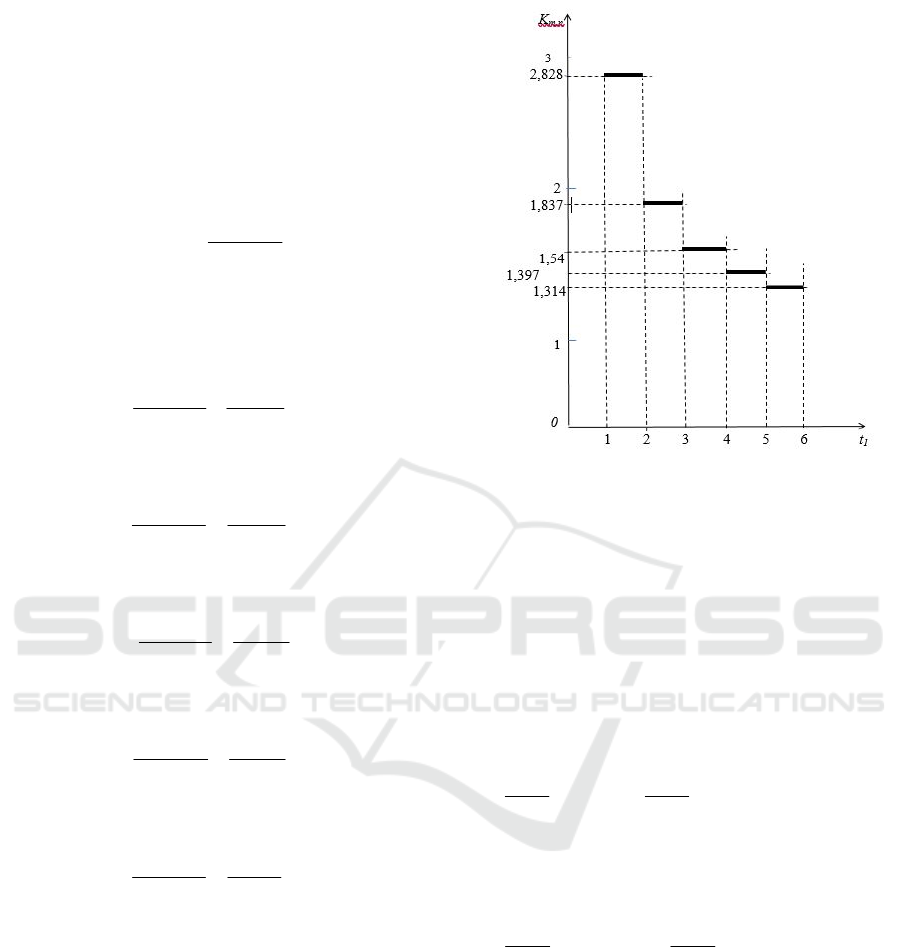
It should be noted that К
mn
depends on the
distance (time) between the segments t
m
and t
n
, which
can be seen from the following diagram (Fig. 3).
Figure 3: Diagram illustrating the dependence of the quasi-
ergodicity coefficient on time.
In accordance with the principle of quasi-
ergodicity, the same К
m,n
are valid for any
implementation of the random process under
consideration. The value of the random variable Х
1
for
the time segment t = 6 was taken from the
experimental data.
From the formula for К
m,n
, it follows that in order
to find the values of a random variable in the time
segment t=5, it is necessary to divide the values of the
random variable at t=6 by К
6,5
= 1,314, for the time
segment t = 5 we get:
6691
314,1
8792
;6672
314,1
8767
and so on till the
30
th
table row.
For the time segment t = 4, we do the same,
recalculate the sample for t = 5 with the quasi-
ergodicity coefficient К
5,4
= 1,397.
5,4789
397,1
6691
;95,4775
397,1
6672
and so on.
Any control involves the optimal use of factors,
avoiding the uncertainties that are inevitable when the
statistical approach to the planning of scientific
research is used [4, 12]. It is necessary to minimize
the risk of deviation of the real process from the
planned one. Having received the data, we can
calculate the optimal management. At the same time
we assume that:
• In accordance with the Khinchin –
Kolmogorov theorem, the spectral power density of a
stationary, in the broad sense, random process is the
Fourier transform of the corresponding
ISSDRI 2021 - International Scientific and Practical Conference on Sustainable Development of Regional Infrastructure
410

autocorrelation function. Time segments of the
random process of the use of factor X
i
are samples
from a normally distributed sampled population
(Kivijarvi et al., 2010).
• The estimated minimum risk should be taken
as R = 5%, i.e. the probability of the problem’s
solution is 95%, which corresponds to the conditions
of the sample size n = 30.
We give a detailed calculation of the interval 2,
in which the values of Х
1
for the time segment t
6
fall
with a risk of 5%. Since the calculations for the
remaining segments t = 5, 4, 3, 2, 1 are the same, they
will be presented more briefly.
For the time period t = 6. Calculation method is [-
, ]. The maximum and minimum values of Х
1
are in
bold: Х
min
=7537; X
max
= 9432. We divide the interval
[7537; 9432] into three partial intervals in width
.7,631
3
75379432
3
minmax
XX
h
The number of partial intervals is selected under
the condition of obtaining in each interval 8-10
options.
Then we find the middle of partial intervals:
.2,9116
2
94324,8800
;5,8484
2
4,88007,8168
;8,7852
2
7,81687537
For further calculations, we need to determine the
sample mean and variance, which we will calculate
by means of the production method, which is used for
the samples with equally spaced options:
,])([;
22
121
hMMDChМX
вв
where С –
false zero (option located in the middle of the
sample). We have С = 8484,5. h– partial interval
width – 631,7. Let us calculate:
h
Cx
u
i
i
-
conditional option;
n
un
M
i
ii
1
- conditional
option of the first order;
n
un
M
i
ii
)(
2
2
-
conditional option of the second order.
Let us carry out some preliminary calculations:
nt
, where n = 30 – sample size, = 181,74 –
evaluation precision, σ = 508,12 – mean square
deviation, t - Laplace function argument – Ф(t). t =
96,1
12,508
74,181
30
. Then from the table of values on
the basis of the Laplace function is Ф (1,96) = 0,475.
Calculation reliability: 95%.
The values of the mathematical expectation in the
time segments t = 1,2,3,4,5,6 are obtained, as shown
earlier, using the integral
k
t
dtt
0
7,886
, where we
successively take t
k
= 1,2,3,4,5,6.
In order to determine the calculated values of
factor Х
1
for various time fragments, it is necessary to
protect the process from external risks associated with
the influence of other factors
Therefore, in order to ensure a reliable operation
of the system, it is necessary to have the
corresponding value, for example, of the elements K,
which is determined for the time segment [t
i
, t
i+1
]
using the formula:
К
Q
tXtX
ii
)()(
111
, (5)
Where Q – intensity of impact of elements К.
It can be interesting to compare the result obtained
by the calculations by means of Lorentz
transformation for Х
1
. Let us assume that
)6(,
1
2
2
1
'
1
c
u
ntX
Х
where с – light speed in the special theory of
relativity. Let us take с = 1, because the speed of light
c in Lorentz transformations is often written equal to
unity (Borovik, V.S and Borovik, V.V., 2016),
(Carmeli, 1977), (Einstein,1955), (Ko, 2010).
In our example, c makes sense having the
maximum performance (or normative one). Then q is
the intensity of additional elements for a particular
system in fractions of c.
Let us insert into the formula
.
1
67,6608
8689
2
q
q
Further 75498721(1 - q
2
) = (6608,7 – 6q)
2
=
43674915,7 – 79304+36q.
From here it follows that:
q
2
- 0,00/q – 0,42 = 0 q =
0,0005+0,648=0,6485(out of 1).
From here the intensity q is determined, calculated
in space and time, as a percentage of the maximum
(or standard). From here it is easy to find the required
number of elements.
Determination of the Risk of Deviation of an Event from the Mathematical Expectation in the Management of Regional Development
411

5 CONCLUSION
In the article the concept of quasi ergodicity of two
functions was introduced and these functions are
presented by corresponding forms of integrals. These
notions are important for a further understanding of
the theory. The paper analyses various time segments
of a random process and it is shown how the
covariance of the values of random functions for
different time periods is manifested. It was
established that when planning a process it is
extremely important to determine the risk of random
situations with unforeseen consequences. The need is
shown to have a functional relationship, which would
allow calculating the risk of unforeseen
consequences, as a random event that develops over
time. When using the statistical characteristics, it is
advisable to proceed from a 5% error (risk). For
individual calculation points, in fact, the width of the
2 interval should be calculated, which includes the
influence factor with unforeseen consequences with
the probability of 0.95. This allows us to obtain the
tabular dependence = (t), (t), and then move on to
its analytical expression.
So that the system could function in a given way
at the right time the necessary parameters of the
factors are provided in an amount determined by the
corresponding time interval. For the calculated
parameters of the factors used at various time periods,
the reliability of the system’s work from external
risks is ensured. The given model allows us to expand
the boundaries of automation of the research
management process in space and time, taking into
account the risk associated with the use of factors of
the digital model.
REFERENCES
4-D System. Universal methodology for the evaluation and
development of commands.
http://54erfolg.ru/main/raspisanie/4-d-sistema.-
universalnaya-metodika-sozdaniya-vovlechennyix-i-
rezultativnyix-komand1.html.
Borovik V.S., Borovik V.V. (2016). Analysis of role of
time in the production process in a 4D space. Eastern-
European Journal of Enterprise Technologies,
№6/10(84):41-48. DOI: 10.15587/1729-
4061.2016.86535.
Borovik, V. S., Borovik V.V., Prokopenko Y.E. (2014).
Visualization of implementation of advanced
technologies in space 4D, Eastern-European Journal
of Enterprise Technologies, 3/3 (69):4-11. DOI:
https://doi.org/10.15587/1729-4061.2014.24621.
Borovik, V., Borovik, A. (2019). Improving the efficiency
of scientific research based on digitalization.
Proceedings of the 2019 International SPBPU
Scientific Conference on Innovations in Digital
Economy (SPBPU IDE '19).
DOI:10.1145/3372177.3373331.
Borovik, V.S., Borovik, V. V. (2019). Visualization of
strategy of production management on the basis of
digital model. International Scientific Conference
"Far East Con" (ISCFEC 2019). Far Eastern Federal
University, Vladivostok. DOI: 10.1007/978-981-15-
2244-4_3.
Borovik, V.S., Borovik, V.V. (2016). Modelling of
crystallization process of polymeric composition in
space and time. Eastern- European Journal of
Enterprise Technologies, 3/5 (81):4-10.
DOI:10.15587/1729-4061.2016.69383.
Borovik, V.S., Borovik, V.V. (2020). Digitalization of the
Economi as Tool to Increase the Potential of Innovative
Activity in the Region. International Scientific and
Practical Conference (DEFIN2020),
DOI:10.1145/3388984.3390643
Borovik, V.S., Borovik, V.V., Bogomolova, I. (2018).
Development of the regional innovative process in the
space by Minkowski. Proceedings of the International
Scientific Conference "Competitive, Sustainable and
Secure Development of the Regional Economy:
Response to Global Challenges" (CSSDRE 2018),
Atlantis Press. doi:10.2991/cssdre-18.2018.1.
Carmeli, M. (1977). Group Theory and General Relativity,
Representations of the Lorentz Group and Their
Applications to the Gravitational Field. McGraw-Hill,
New York, 311 p.
Einstein, A. (1955). Theory of relativity. Foreign literature
publishing house. M., P. 28.
GOST R 27.001.2009: Reliability in technology. Reliability
Management System.
Kivijarvi, H., Piirainen, K., Tuominen, M. (2010).
Sustaining organizational innovativeness: advancing
knowledge sharing during the scenario
process.(Report). International Journal of Knowledge
Management, 6, 22(18).
Ko, D.G. (2010). Consultant competence trust doesn't pay
off, but benevolent trust does! Managing knowledge
with care. Journal of Knowledge Management,
14(2):202-213.
Mathematical Modelling in Science and Technology - 1st
Edition The Fourth International Conference covers the
proceedings of the Fourth International Conference by
the same title, hel
https://www.elsevier.com/books/mathematical-
modelling-in-science-and-technology/...
Mikheeva, T.I. (2007). Structural and parametric synthesis
of control systems for road transport infrastructure,
Dissertation for the competition of the Degree of
Doctor of Technical Sciences. 05.13.01, Samara.
Prokhorov, S.A. (2007). Applied analysis of random
processes. SSC RAS, 582 p.
ISSDRI 2021 - International Scientific and Practical Conference on Sustainable Development of Regional Infrastructure
412

Prokhorov, S.A., Fursov, V.A., Krivosheev, A.O. et al.
(1995). Automated Systems for Scientific Research,
SPC “Aviator”. Samara, 137 p.
Prokhorov, S.A., Kulikovskikh, I.M. (2016). Pole position
problem for Meixner filters. Signal Processing, 120: 8-
12.
The main provisions of GOST 24.701-86.
Determination of the Risk of Deviation of an Event from the Mathematical Expectation in the Management of Regional Development
413
