
Assessment of the Region Investment Attractiveness in Complex
Relationship with Sustainable Development on the Basis of the
Balanced Scorecard
Vladimir N. Myakshin
1a
and Irina V. Grishina
2,3 b
1
Northern (Arctic) Federal University named after M. V. Lomonosov, Severnaya Dvina embankment 17, Arkhangelsk,
Russian Federation
2
Russian Foreign Trade Academy, Vorobyevskoe Shosse St. 6A, Moscow, Russian Federation
3
Russian Academy of National Economy and Public Administration, Prosp. Vernadskogo 82 Bld. 1, Moscow, Russian
Federation
Keywords: Investment Policy, Investment Attractiveness, Region, Balanced Scorecard, Balanced Estimation.
Abstract: The purpose of the article is to justify the need for possible applying the balanced scorecard for identifying
the region investment problems. Investment attractiveness of the regional economic system of the
Arkhangelsk region of the Russian Federation is taken as a research object. It should also be noted that over
a long period of time the balanced scorecard has been applied as the efficiency management tool of certain
organizations. However, no attempts were made to develop valuation techniques for the investment
attractiveness of economic systems using the balanced scorecard. Besides the balanced assessment
methodology has not been applied for studying regional issues before. The authors of the present research
improved the integrated approach to the assessment of the investment environment (that was implemented by
means of methodology of Council for the Study of Productive Forces) by supplying it with achievements of
the balanced approach which was suggested by R. Kaplan and D. Norton. The article proves the importance
of developing a mechanism for coordinating the interests of various participants of the investment process.
The authors show the opportunity of creating that sort of mechanism based on the balanced scorecard for
assessment of the region investment attractiveness taking into consideration the information needs of every
group of participants. The application of the balanced score card may become the basis for developing an
effective strategy of improving investment attractiveness of the region.
1 INTRODUCTION
The regional investment policy capable of providing
the rise in the investment attractiveness of every
Russian region for its development should become an
indispensable structural unit of the integral legislated
system of investment activity government regulation
that reflects peculiarities of the federal structure of the
country.
From our point of view, the regional
investment policy should be understood as the system
of measures that is carried out by the regional public
authorities responsible for the mobilization and
effective use of domestic and outward investment
a
https://orcid.org/0000-0002-3989-7367
b
https://orcid.org/0000-0003-0743-7232
resources of all forms of ownership in order to
guarantee the stable economic growth of the region.
The authors of the article conducted the study on
investment attractiveness of regional sectoral
economic systems which is one of the key
development challenges of the regional economy and
their research is based on a wide range of theories and
practices. A large number of different methods of
interregional investment comparison are used both in
Russia and abroad. Foreign rating valuation
techniques for investment environment and
investment attractiveness such as «Doing Business»,
valuation techniques of expert agencies like
«Moody's», «Standard&Poor's», «Fitch Ratings» and
388
Myakshin, V. and Grishina, I.
Assessment of the Region Investment Attractiveness in Complex Relationship with Sustainable Development on the Basis of the Balanced Scorecard.
DOI: 10.5220/0010591103880395
In Proceedings of the International Scientific and Practical Conference on Sustainable Development of Regional Infrastructure (ISSDRI 2021), pages 388-395
ISBN: 978-989-758-519-7
Copyright
c
2021 by SCITEPRESS – Science and Technology Publications, Lda. All rights reserved

others have become best known in Russia for being
included into various scientific reviews. The
development of an entrepreneurship toolkit for region
investment attractiveness assessment is based on the
analysis and generalization results of both foreign
(specifically pointing out the elements that can be
adopted within the economy of Russia) and domestic
experience in attracting investments (Hoque, 2000).
The domestic methodology of interregional
investment comparison has come a long way by now.
The challenges faced in assessing investment
attractiveness have been studied by such scientists as
A. Folomiev, I. Grishina, I. Royzman, A.
Shakhnazarov (Grishina, 2013; Hoque, 2000). In
accordance with the majority of approaches, the main
factors that differentiate territories in terms of
investment attractiveness are not only non-specific
factors (shared for all regions) but also specific
regional factors. T. Rakhimov suggests classifying
the present investment environment valuation
according to the set of characteristics including:
technique origin; technique application area;
coverage of investment environment elements; a
number of levels in investment environment
assessment; a presentation form of results; investment
environment valuation techniques employed;
dynamism of the set of specific indicators; scope of
investment environment assessment.
In our opinion the availability of a great number
of valuation techniques is also determined by the
difference between goal setting in research and
approaches to the interpretation of the concept
«investment attractiveness» and «investment
environment», determination of relations, and
structure of these categories. The concept «business
environment» is mainly used in foreign researches
(Becker, 2012; Belitski, 2016; Berkowitz, 2015;
Besley, 2015; Fernandes, 2015; Myakshin, 2019).
R. Anderson offers to differentiate the notions of
«investment environment» and «business
environment». He gives his preference to the second
notion because in the author’s opinion the notion
«investment environment» may create a
misconception about the contribution of the private
sector into economic growth (Anderson, 2004).
In our view, the evolving of domestic valuation
techniques for investment attractiveness has followed
the path of differentiation and complexity of the
assessment scorecard, and the introduction of mainly
qualitative (static) indicators. Nevertheless,
methodological approaches to investment
attractiveness assessment, factors influencing the
assessment, the structure of assessment indicators are
reconsidered by their authors on a time basis
according to objectives of conducted researches and
a change in conditions of economic development. It
should be noted that the indexes of the assessment of
the region investment attractiveness currently applied
in economic studies do not fully meet the needs of
different groups of participants of regional
investment processes to the above-mentioned
assessment. The new methodological approach is
based on the scorecard of indexes independent from
dynamics of investment attractiveness of other
regions and would allow meeting initially different
information needs of various participants of the
investment process.
The major conceptual innovation of the suggested
balanced approach allows for a shift in priorities
towards achieving compliance of the assessment
results with the interests of all parties (i.e. investors,
population, state administration bodies) when
assessing the investment attractiveness.
2 METHODOLOGY AND
METHODS OF RESEARCH
In order to reflect current economic conditions more
precisely and to take into consideration the present
improvement of the static observing system, the
authors have participated in modifying the
methodology of integrated comparative assessment
of investment attractiveness of Russian regions that
has been developed at the Council for the Study of
Productive Forces (CSPF). Moreover, the new system
of assessment indicators for two main elements of
investment attractiveness (investment potential of a
region and a regional investment risk) has been
presented. Despite the change in the structure of
specific indicators and their valuation techniques, the
most important feature of the integrated
methodological approach of CSPF has been
preserved. The feature consists of considering
regional investment attractiveness in complex
relationship with investment activity within the
regions (Grishina, 2013). On the results of the
experimental assessment of investment attractiveness
of the constituent entities of the Russian Federation
that were obtained with the application of the
suggested method (on the basis of the statistical
accounting for 2010), investment attractiveness of the
Arkhangelsk region has been estimated at 0,754
(i.e. 0,25 percentage points below the Russian
average, because the Russian average was considered
to be 1,00). According to the calculated results, the
Arkhangelsk region held the 56
th
place out of 83
Assessment of the Region Investment Attractiveness in Complex Relationship with Sustainable Development on the Basis of the Balanced
Scorecard
389

studied constituent entities of the Russian Federation
in terms of investment attractiveness (Hoque, 2000).
Moreover, pursuant to the conducted research on the
investment activity level of regional private investors
(according to the data from 2012, that was done in
order to keep the time lag for investment
attractiveness realization described in 2010), the
Arkhangelsk region was assessed to be of the third
group of regions with middle investment activity
level (0,985). The following level is just a little below
the Russian average and provide the relatively high
31
st
place among all Russian constituent entities. It
shows us the influence of unaccounted factors on the
investment attractiveness valuation technique and
consequently the presence of reserves for its further
development towards ensuring compliance with
investment attractiveness assessment and investment
activity assessment of every region. The balanced
scorecard (BSC) that originated at the beginning of
the 90s of the XX century as an evaluation system,
has turned into an efficiency management tool owing
to long-term improvements in the works of R.
Bhagwat, E. Daniel, F. Figge, Z. Hoque, D. Kaplan,
R. Norton, P. Niven, N. Olve (Bhagwat, 2007;
Daniel, 2012; Figge, 2002; Kaplan, 1996, 1998, 2000;
Martinsons, 1999; Niven, 2011; Olve, 2011).
Therefore researches that are aimed to develop the
practice-oriented balanced scorecard for investment
attractiveness assessment of the region could be
ranked as new ones on setting. In developing the BSC
to assess the region's investment attraction, we used
the basic principles outlined above, which belong to
the correct methodological approach of the CSPF.
The basis for the formation of the BSC is the
relationship of the key factors of investment
attractiveness with the key indicators that have been
selected with the use of the criterion «maximal
representation and investment value». The
opportunity of quantitative identification of
indicators on the ground of the current assessment
was taken into account while making maximum use
of the data from government statistics. The integral
indicators of investment attractiveness are suggested
to be estimated with the help of the multivariate
average formula. However, regional target values of
indicators are offered to be used as the basis for
rationing values of the individual indicators in
preference to the national averages estimated
throughout the Russian Federation that are followed
by many studies. The matrix of integral indicators is
formed on the ground of the calculations carried out.
3 RESULTS
According to the data of the authors’ empiric research
on the investment attractiveness level of the
Arkhangelsk region that has been carried out with the
help of the developed balanced scorecard, principal
directions of improving investment attractiveness
have been analyzed (Table 1, Figure 1). The results of
such researches could be required by the current
practice of state regulation of the economy.
Table 1: Composition of the balanced scorecard for the investment attractiveness assessment of Arkhangelsk region* (2011-
2018).
Name of the indicator
Targ
et
valu
e
Indicator value
2011 2012 2013 2014 2015 2016 2017 2018
Integral indicator for production and financial
perspective
0,51 0,31 0,46 0,38 0,68 0,64 0,65 0,86
1. Integral indicator for the section “Financial
development”
0,60 0,62 0,60 0,60 0,69 0,76 0,75 0,77
1.1. Share of profitable enterprises, percentage 0,9 0,63 0,63 0,65 0,64 0,6
7
0,71 0,66 0,68
1.2. Indicator of balancing budget revenues and
expenditures of the region, percentage
1 0,92 0,93 0,93 0,91 0,97 0,93 0,99 1,04
1.3. Share of overdue accounts payable in the total
amount of external accounts payable, percentage
0,01 0,06 0,04 0,06 0,06 0,03 0,02 0,02 0,02
2. Integral indicator for the section
“Environmental safety”
0,74 0,63 0,77 0,73 0,84 0,76 0,75 0,77
2.1. Share of the detected and detoxified pollutants
in their total number from all stationary pollution
s
ources, percentage
0,8 0,75 0,76 0,77 0,72 0,74 0,73 0,73 0,76
2.2. Share of environmental protection investments
in total investment amount as a percentage of the
region's investment capita, percentage
0,02 0,01 0,00 0,01 0,01 0,01 0,01 0,01 0,10
2.3. Forest reproduction indicator of forest
reserves, percentage
1 0,78 0,76 0,85 0,98 0,94 0,64 0,67 0,64
ISSDRI 2021 - International Scientific and Practical Conference on Sustainable Development of Regional Infrastructure
390

Continuation of table 1.
3. Integral indicator for the section “Efficiency
of the production and financial activity of the
region”
0,26 -0,17 0,13 -0,05 0,54 0,32 0,38 0,65
3.1. Depreciation level of fixed assets, percentage 0,15 0,48 0,4
7
0,46 0,45 0,48 0,50 0,51 0,53
3.2. Return on total assets, % 10 0,40 -1,30 0,40 0,40 2,80 0,46 0,3
7
0,73
3.3. Profitability of sold goods, products
(services), %
10 6,50 -4,30 0,00 -7,10 5,00 0,84 0,79 0,60
3.4. Profitability of labour forces, % 10 0,28 -4,50 1,3
7
1,3
7
10,76 14,66 13,79 14,69
Integral indicator for the development
perspective
0,66 0,68 0,62 0,51 0,55 0,39 0,37 0,40
1. Integral indicator for the section “Intellectual
potential”
0,57 0,65 0,61 0,65 0,65 0,40 0,39 0,40
1.1. Share of employees with higher education,
p
ercentage
0,4 0,23 0,26 0,24 0,26 0,26 0,28 0,27 0,27
1.2. Indicator of advanced staff training,
p
ercentage
0,5 - - - - - 0,01 0,01 0,01
2. Integral indicator for the section “Innovative
capacity”
0,70 0,71 0,65 0,47 0,53 0,44 0,42 0,46
2.1. Research and Technological Development cost
component, percentage
0,1 0,00 0,00 0,00 0,00 0,00 0,00 0,00 0,00
2.2. Technological innovations cost component,
p
ercentage
0,05 0,01 0,02 0,02 0,01 0,00 0,00 0,00 0,01
2.3. Use of information technology indicator,
p
ercentage
1,5 1,44 1,11 0,77 0,77 2,31 1,03 0,60 1,03
2.4. Indicator of replacement of fixed assets 0,15 0,10 0,11 0,11 0,08 0,05 0,06 0,06 0,06
2.5. Indicator of investment requirement of sold
p
roducts
0,2 0,33 0,33 0,29 0,22 0,13 0,21 0,23 0,21
3. Integral indicator for the section
“Infrastructural capacity”
0,50 0,52 0,53 0,53 0,53 0,08 0,08 0,08
3.1. Communication lines density, km/ thousand sq
km
60 30,00 31,00 32,00 32,00 32,00 59,00 59,00 59,00
Integral indicator for natural resource
perspective
0,67 0,66 0,67 0,69 0,74 0,74 0,79 0,82
1.Integral indicator for the section “Resource
provision”
0,70 0,70 0,71 0,73 0,81 0,69 0,76 0,80
1.1. The economic activity of the population level,
p
ercentage
0,75 0,55 0,53 0,53 0,52 0,52 0,51 0,51 0,50
1.2. Deposits of natural hydrocarbon (gas and oil),
million equivalent tons
3000
2954,
70
2954,
70
2954,
70
2954,
70
2954,
70
2954,
70
2954,
70
2954,
70
1.3. Deposits of mineral resources (except for
hydrocarbon deposits), million equivalent tons
2000
1039,
60
1039,
60
1039,
60
1039,
60
1063,
50
1063,
50
1063,
50
1063,
50
1.4. Forest reserves area, million hectares 35 28,82 28,83 29,29 29,29 29,31 29,31 29,31 29,31
1.5. Indicator of provision enterprises of the region
with their own financial resources, percentage
0,5 0,23 0,24 0,25 0,32 0,50 0,39 0,39 0,44
2. Integral indicator for the section “Geographic
location”
0,71 0,71 0,71 0,71 0,71 0,71 0,71 0,71
2.1. Region geographic location
7
5 5 5 5 5 5 5 5
3. Integral indicator for the section “Climatic
conditions”
0,43 0,43 0,43 0,43 0,43 0,43 0,43 0,43
3.1. The level of region favorable climate
7
3 3 3 3 3 3 3 3
Integral index for political - economic and social
perspective
0,64 0,57 0,60 0,59 0,60 0,49 0,51 0,52
1. Integral indicator for the section “Economic
growth potential of the region”
0,47 0,46 0,50 0,49 0,50 0,56 0,59 0,60
1.1. Volume of the Gross Regional Product, billion
rubles
320
273,6
9
315,4
0
326,9
2
356,4
3
399,5
2
377,9
9
418,4
6
464,9
1
1.2. Dynamics of the Gross Regional Product,
p
ercentage
110
110,1
0
104,0
0
102,0
0
101,1
0
100,1
0
99,20
103,8
0
102,9
0
1.3. Inflation rate in the consumer sector, %
0,5 5,50 6,00 6,80 13,00 13,00
104,8
0
101,5
0
104,0
0
1.4. Inflation rate in the industrial sector, %
0,5 3,60 6,50 2,10 4,60 21,10
105,6
0
109,8
0
112,6
0
1.5. Indicator of property relations in the region 0,8 0,48 0,49 0,50 0,51 0,51 0,29 0,30 0,3
7
1.6. Indicator of the entrepreneurial development
degree
0,3 0,13 0,11 0,11 0,12 0,12 0,13 0,15 0,14
Assessment of the Region Investment Attractiveness in Complex Relationship with Sustainable Development on the Basis of the Balanced
Scorecard
391
Continuation of table 1.
1.7. Openness of the economy, thousand dollars per
p
erson
8 1,37 1,20 1,99 2,02 1,81 1,86 2,17 2,69
2. Integral indicator for the section “Social
security”
0,48 0,48 0,48 0,48 0,48 0,30 0,30 0,32
2.1. Overall morbidity rate, the number of disease
incidences per one thousand people
100
1061,
10
1041,
31
1047,
4
7
1013,
30
995,1
9
1015,
90
1002,
20
998,5
0
2.2. Job safety level
1 0,99 1,00 1,00 1,00 1,00
118,9
0
122,4
0
122,0
0
2.3. Number of recorded crimes per one thousand
p
eople
7 20,43 20,51 20,71 20,90 21,07 17,76 17,31 15,18
3. Integral indicator for the section “Employee
satisfaction”
1,05 0,84 0,86 0,86 0,87 0,51 0,53 0,52
3.1. Social sector financing 0,5 0,66 0,66 0,6
7
0,66 0,6
7
48,03 49,55 56,39
3.2. Number of inhabitants with income above the
p
overty line
0,99 0,89 0,86 0,87 0,86 0,86 0,86 0,86 0,88
3.3. Unemployment rate, percentage 0,02 0,02 0,06 0,06 0,06 0,08 0,0
7
0,06 0,06
3.4. Indicator of the ration between growth rates of
labour productivity and growth rates of average
wages
1,1 1,07 0,95 0,96 1,01 1,10 0,93 0,98 0,91
IN THE BALANCED SCORECARD IN
TOTAL
0,61 0,54 0,58 0,54 0,64 0,55 0,57 0,64
*
The Balanced Scorecard has been developed and the calculation has been carried out by the authors
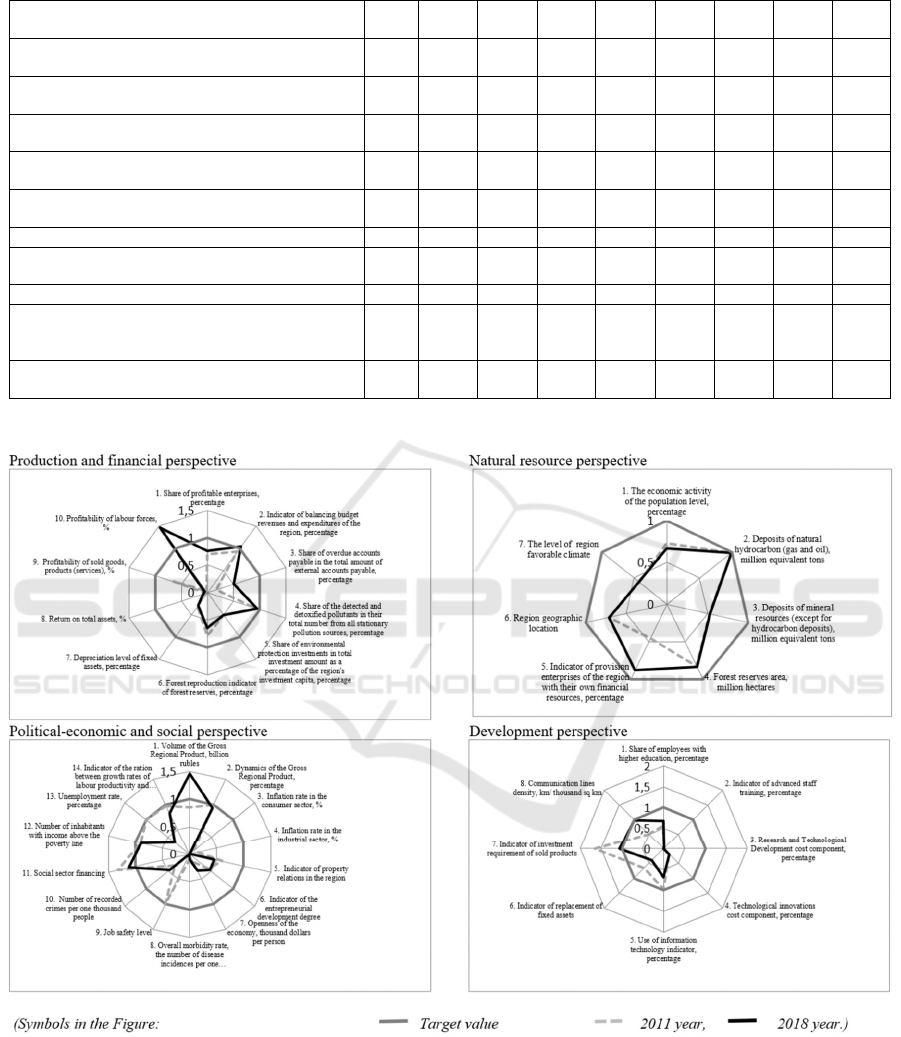
Figure 1: Diagram for key indicators of investment attractiveness of the Arkhangelsk region from different perspectives for
2011-2018*
*
The diagram has been developed by the authors
ISSDRI 2021 - International Scientific and Practical Conference on Sustainable Development of Regional Infrastructure
392

While implementing practical assessment of the
investment attractiveness level of the Arkhangelsk
region, the reality check of the developed method
confirms the possibility of using the balanced
scorecard as an instrument of quantitative
identification of the investment attractiveness factors.
The results of the assessment would be advisable to
use when developing a strategy for improving the
region's investment attractiveness.
4 DISCUSSION
It should be noted that the factors of financial
development produced a positive effect on the
investment attractiveness growth of the Arkhangelsk
region. The research identified the increase of 28 p.p.
(percentage points) in the financial development
indicator due to similar growth of the share of
profitable enterprises. The indicator of balancing
budget revenues and expenditures has grown by 13
p.p., while the indicator value is close to the target one
(1,04) which can be viewed as the positive aspect.
From 2011 to 2014 there was an obvious tendency of
a decrease in the indicators characterizing the
efficiency of production and financial activity.
However, 2,5 times increase of the integral indicator
of this section was observed in 2018 in comparison to
2011. It happened due to an increase of the indicator
«Return on total assets» by 1,8 times, a considerable
increase of the indicator «Profitability of labour
forces» that exceeded some certain target value
(14,69). It is important to note positive dynamics in
the integral indicator values of environmental safety
of production facilities (growth is 4 p.p.) which is the
result of increasing such indicators as «Forest
reproduction indicator of forest reserves» and the
conservative value of the indicator «Share of
environmental protection investments». The stated
factors have made a positive impact on the investment
attractiveness of the Arkhangelsk region. Analysis of
the integral indicator complex by four perspectives of
the developed balanced scorecard has shown that the
maximum value is the integral indicator value for
natural resource perspective (0,80) under positive
dynamics (increase constituted 14 p.p. over 5 years).
The detrimental effect of the low value of the
indicator which characterizes the climatic conditions
of the Arkhangelsk region (0,43) is offset by the
positive influence of the economic supportability
with raw material resources factor on investment
attractiveness. The volume indicators of forest
reserves area and natural hydrocarbon deposits
practically achieve the target values. The graphical
interpretation of the research results of production
and financial perspective of the BSC (Figure 1)
demonstrates minor deviations from the target values
of the following indicators: «Balancing budget
revenues and expenditures of the region», «Forest
reproduction of forest reserves», «The profitability of
labour forces». The diagram analysis shows that the
relatively low value of the integral indicator of
production and financial perspective is primarily
determined by significant deviations from the target
values of the indicators. On the ground of the analysis
of the diagram that has been created for the key
indicators of the natural resource perspective, it has
been discovered that the indicator «Economic
supportability of the region with raw material
resources» and the indicator «Level of the economic
activity of the population» are close to the target
values. The indicator «Provision enterprises of the
region with their own financial resources» almost
achieves the target value. However, there is a
negative impact of the factors of innovative social-
economic development on the investment
attractiveness of the Arkhangelsk region. In 2018 the
indicator of fixed assets replacement was decreased
by 1,7 times with a reduction of the indicator of
investment requirement by 1,6 times. At the same
time, the indicator of employee satisfaction was
decreased by 2 times due to 3 p.p. reduction in the
number of inhabitants with income above the poverty
line and the increase of unemployment rate by 1,3
times (comparing to 2015). In comparison with 2011,
the integral indicator of political-economic and social
perspective was lowered by 1,2 times.
The integral indicator for the section «Social
security» has a negative impact on the investment
attractiveness level due to the influence of the
following factors: the indicator «Number of recorded
crimes per one thousand people» exceeds the certain
target value by 2,2 times, while the indicator «Overall
morbidity rate» exceeds the target value by 10 times.
Negative dynamics of the integral indicator of the
development perspective seems to be alarming: there
is a 65 p.p. decrease in the integral indicator value
comparing to 2011 respective data. Negative
dynamics is primarily conditioned by 52 p.p. decrease
of the innovative capacity indicator while the
indicators for infrastructural capacity and intellectual
potential have grown. It should be noted that for a
long period of time the «Replacement of fixed assets»
issue continues to be a challenge. Firstly, it concerns
the assets component of fixed capital: the indicator
«Replacement of fixed assets» experienced a
reduction by 1,7 times while the depreciation of
equipment was 48%. It is necessary to upgrade
Assessment of the Region Investment Attractiveness in Complex Relationship with Sustainable Development on the Basis of the Balanced
Scorecard
393

production facilities of the region making it possible
to produce the goods competitive at the international
market. The important indicator of investment
attractiveness reduction is 1,6 times decrease in the
value of the indicator «Investment requirement of
sold products». The integral indicator for the
development perspective has got the lowest value
among the perspectives of the BSC (0,40). The
diagram of indicator values that are included into the
section «Development» makes it possible to fairly
demonstrate the deviation from the target values of
the following indicators: «Research and
Technological Development cost component»,
«Technological innovations cost component», «Index
of replacement of fixed assets», «Index of investment
requirement of sold products». Consequently, the
integral indicator profile for the Arkhangelsk region
shows that the integral indicator values for the
development perspective and the government and
social perspective are below the target values of
rights. This restricted the management of investments
in the Arkhangelsk region. The analysis of the results
of the investment attractiveness assessment of the
Arkhangelsk region on the basis of the balanced
scorecard allows identifying principal directions of
the investment policy of the Arkhangelsk region.
These directions include: development of market
institutions, specifically the creation of the conditions
for private entrepreneurship and small businesses;
improving the openness of the economy;
infrastructure development; improving innovative
capacity through cost increasing on Research and
Technological Development, technological
innovations, replacement of fixed assets; rising
population incomes in order to increase consumer
demand.
5 CONCLUSION
The elaboration and implementation of a balanced
scorecard-based performance evaluation system
represents an effective way for raising the investment
attractiveness of the projects being deployed in the
Arctic Zone of the Russian Federation. Further, the
BSC-based assessment of a region’s investment
attractiveness can be seen as a way of harmonizing
the interests of all stakeholders in an investment
process. Implementation of the balanced approach to
investment attractiveness assessment gives an
opportunity to identify the principal directions of the
regional investment policy. The suggested balanced
approach is aimed at improving the scientific basis of
state regulation of the investment sector at all levels.
The approach can be applied for comparative
diagnosis of regions and developing directions of
state regulation of investment activity at the macro
level. At the meso level the approach can be used
while forming the regional balanced economic
system. Confirmation of the practical importance of
the research results is the direct use of the balanced
scorecard for investment attractiveness assessment of
the Arkhangelsk region. Using the balanced scorecard
as the information base of the study of public
statistical data accounts for the possibility of applying
the elaborations by public authorities of other regions.
The balanced scorecard can be used as a set of tools
for assessing the performance of government
investment policies and for managing the
administration of regional investment measures. The
suggested balanced scorecard could become the base
for the diagnostic system that could provide for
identification of main investment problems and
developing scientifically based investment policy in
the constituent entities of Russia.
ACKNOWLEDGEMENTS
The research has been conducted in the framework of
the R&D state assignment of the Russian Presidential
Academy of National Economy and Public
Administration
REFERENCES
Anderson, R.E. (2004). Just get out of the way: how
government can help business in poor countries.
Washington, D.C.: Cato Institute, 274.
Becker, J., Fuest, C., Riedel, N. (2012). Corporate tax
effects on the quality and quantity of FDI. European
Economic Review, 56 (8): 1495-1511.
Belitski, M., Chowdhury, F. and Desai, S. (2016). Taxes,
corruption, and entry. Small Business Economic, 47 (1):
201-216. doi:10.1007/s11187-016-9724-y
Berkowitz, D., Lin, C., Ma, Y. (2015). Do property rights
matter? Evidence from a property law enactment.
Journal of Financial Economics, 116 (3): 583-593. doi:
10.1016/j.jfineco.2015.04.003
Besley, T. (2015). Law, regulation, and the business
climate: The nature and influence of the World Bank
Doing Business project. Journal of Economic
Perspectives, 29(3): 99-120. doi:10.1257/jep.29.3.99
Bhagwat, R., Sharma, M.K. (2007). Performance
measurement of supply chain management: A balanced
scorecard approach. Computers & Industrial
Engineering, 53 (1): 43-62.
doi:10.1016/j.cie.2007.04.001
ISSDRI 2021 - International Scientific and Practical Conference on Sustainable Development of Regional Infrastructure
394

Daniel, E., Myers, A. and Dixon, K. (2012). Adoption
rationales of new management practices. Journal of
Business Research, 65 (3): 371-380.
Fernandes, A., Hillberry, R. andMendoza Alcantara, A.
(2015). Trade effects of customs reform: evidence from
Albania.
Figge, F., Hahn, T., Schaltegger, S. and Wagner, M. (2002).
The sustainability balanced scorecard–linking
sustainability management to business
strategy. Business strategy and the Environment, 11
(5): 269-284. doi:10.1002/bse.339
Grishina I.V., Marukhin I.N. and Shestopalova I.P. (2013).
Peculiarities of the methodology: Research
methodology and the experience of investment
attractiveness assessment of the regions of Russia.
Federalism.1: 39-56.
Hoque, Z. and James, W. (2000). Linking balanced
scorecard measures to size and market factors: impact
on organizational performance. Journal of management
accounting research 12 (1): 1-17.
Kaplan, R. S. and Norton, D. P. (1996). Strategic learning
& the balanced scorecard. Strategy & Leadership,
24(5): 18-24.
Kaplan, R. S. (1998). Innovation action research: creating
new management theory and practice. Journal of
management accounting research, 10: 89-118.
Kaplan, R.S. and Norton, D.P. (2000). Having trouble with
your strategy? Then map it. Harvard Business Review
78 (5): 167-176.
Martinsons, M., Davison, R. and Tse, D. (1999). The
balanced scorecard: a foundation for the strategic
management of information systems. Decision support
systems, 25(1): 71-88.
Myakshin, V. and Petrov, V. (2019). Evaluating The
Investment Attractiveness Of A Region Based On The
Balanced Scorecard Approach. Regional Science
Inquiry, 11 (1): 55-64.
Niven, P.R. (2011). Balanced scorecard: Step-by-step for
government and nonprofit agencies. John Wiley &
Sons.
Olve, N.G., Roy, J. and Wetter, M. (2011). Performance
drivers: A practical guide to using a balanced
scorecard. Chichester: John Wiley & Sons.
Assessment of the Region Investment Attractiveness in Complex Relationship with Sustainable Development on the Basis of the Balanced
Scorecard
395
