
Transport Performance for Rough Terrain Sustainable Development
Liudmila P. Bobrik
1a
and Petr P. Bobrik
2b
1
Department "Engineering graphics" Moscow Aviation Institute (National Research University), Volokolamskoe highway,
4, Moscow, Russian Federation
2
Laboratory of the organization of transport systems Solomenko Institute of Transport Problems of the Russian Academy of
Sciences 12-th Line VO, 13, St. Petersburg, Russian Federation
Keywords: Rough Terrain, Sustainable Development, Accessibility, Movement Efficiency.
Abstract: The article analyzes the issues of a quantitative assessment of the transport movement efficiency across the
rough terrain. As a quality criterion, the vehicle energy costs are taken, conditioned by doing against rolling
friction forces and load weight of the load. Simplifying assumptions for formula expressions of forces are
formulated. Qualitative conclusions about the action of these forces depending on the road inclination angle
were presented. The attainability domain concept is introduced for a specified consumption value of the
resource. A transport indicator has been defined to compare accessibility areas with similar areas on the plain.
A numerical method for determining accessibility areas was proposed, based on representing the relief using
a weighted graph and determining the shortest distance tree within it. An integral over the territory indicator
of the transport potential of a rugged terrain is considered.
1 INTRODUCTION
Modern socio-economic realities in the world are
such that rough terrain territories (RTT), other things
being equal, are usually considered less favorable for
living, people, and business activity than their plain
counterparts, like the difference between coastal and
inland territories (Bezrukov, 2008). As a result, they
are less populated and less attractive for doing
business, with the exception of traditional types of
activity, mainly, agriculture.
Meanwhile, to explain what is happening from a
purely theoretical point of view, analyze why such a
situation has developed, understand what factors
result in a decrease in the potential for the social and
economic development of RTT, sometimes turns out
to be a non-trivial problem. However, without its
solution, it is impossible to answer the question of
how to increase the investment attractiveness of RTT,
to attract people or living and win the world
competition in the attractiveness of certain places.
Finally, it is necessary to provide the socio-economic
basis for RTT sustainable development for extended
a
https://orcid.org/0000-0003-2440-3309
b
https://orcid.org/0000-0001-9038-1852
period of time, as the classics understood it (Meadows
et al., 1972; Meadows, 1992; Forrester, 1974).
RTT occupy a significant part of the land. At the
same time, they are often able to offer a whole range
of unique characteristics for living and economy
(Ivashkina and Kochurov, 2018; Wolfe, 2019).
Therefore, it seems reasonable to use their potential
for all mankind, integrate it into the world labor
division (Podberezkin and Podberezkina, 2014)
The RTT development issues are very
multifaceted and require an integrated approach to
develop practical recommendations for each specific
territory, depending on the profile of its properties
and target objectives. This article will consider one of
the most important factors for territory functioning -
its potential in terms of the transport movement
efficiency.
362
Bobrik, L. and Bobrik, P.
Transport Performance for Rough Terrain Sustainable Development.
DOI: 10.5220/0010590703620367
In Proceedings of the International Scientific and Practical Conference on Sustainable Development of Regional Infrastructure (ISSDRI 2021), pages 362-367
ISBN: 978-989-758-519-7
Copyright
c
2021 by SCITEPRESS – Science and Technology Publications, Lda. All rights reserved

2 RESEARCH METHODOLOGY
2.1 Impact of Rough Terrain on
Transport Efficiency
The role of transport in the socio-economic
development of the territory is so important that it can
be named as one of the main reasons slowing down
the economic growth of many RTT (Golts, 1981). In
this case, this or that type of transport is not so
important as its indicators when used for moving a
unit of cargo or a passenger per unit of distance.
These are issues of pure efficiency of movements. In
this sense, the article continues research of work
(Bobrik L.P. and Bobrik P.P., 2016).
As different types of vehicles have their own
characteristics, a significant scatter of results can be
obtained for different studies. To get qualitative
conclusions, the article will consider road transport in
its most general form as an example. The findings can
be generalized with minor accuracy corrections for
other types of movements. In the simplest case, we
assume that the vehicle (V) is counteracted by two
main forces: the rolling friction force of the wheel and
the vehicle weight with its load. Since, as a rule,
during movement RTT, the speed of movement is
low, this allows, in a first approximation, to exclude
from consideration the force of air resistance,
parasitic vibrations of mechanisms, friction forces in
bearings and restrict ourselves to only these two
forces.
2.2 Rolling Friction
The rolling friction force is generally very complex
and requires many different factors. Among these,
surface types appear to be significant. But for our
purposes, as will be shown below, to assess the
influence of the rolling friction force on the efficiency
of movements, it will be possible to use a simple
formula.
r
mg
kF
кач
(1)
Here
m
is the total vehicle mass and its load,
g
is gravity acceleration,
r
is the vehicle wheel radius.
We will focus on the dependence on the vehicle mass
and its load. As each vehicle has a constant wheel
radius, this formula implies a linear form of this
dependence for each specific vehicle.
The proportionality factor
k
varies significantly
(by several times and even by orders of magnitude)
depending on surface types, evident from Table 1.
Table 1: Approximate values of rolling frictional resistance
for pneumatic car tires and various types of road surface
(source: Wikipedia).
Road surface and its Rolling resistance
Asphalt concrete in excellent 0.015-0.018
The same in satisfactory 0.018-0.020
Gravel surface 0.02-0.025
Cobblestone 0.035-0.045
Unformed road, dry 0.03-0.035
The same after rain 0.05-0.10
Sand, dry 0.15-0.30
Sand, wet 0.08-0.10
Snow road 0.025-0.03
Ice 0.018-0.02
From this table, an important conclusion can be
made that if we do not take abnormal cases like dry
sand, then the rolling friction force for cars usually
amounts to several percent of the total vehicle weight
with the load. As the car wheel radius rarely exceeds
a third of a meter, then further in the article the total
rolling friction coefficient of 6% of the body weight
will be taken by default.
2.3 Lifting a Load Uphill
The main transport difference between a plain and
RTT in terms of movement efficiency is the presence
of slopes or hills. On the plain, such areas are also
present, but the angles are much less marked, they are
present less frequently so that they can be neglected
in the first approximation.
In the case of a horizontal surface, the vehicle
weight with a load does not generate any additional
forces to the rolling friction force that impede
movement, which is a natural advantage of such
areas. But in rough terrain, extra effort is required
when lifting. At the same time, for the downward
movement, there is practically no compensation for
the energy consumption, since the speed shall be
limited for reasons of road safety, and the engine
operates at approximately the same mode as when
ascending to the same angle.
Transport Performance for Rough Terrain Sustainable Development
363
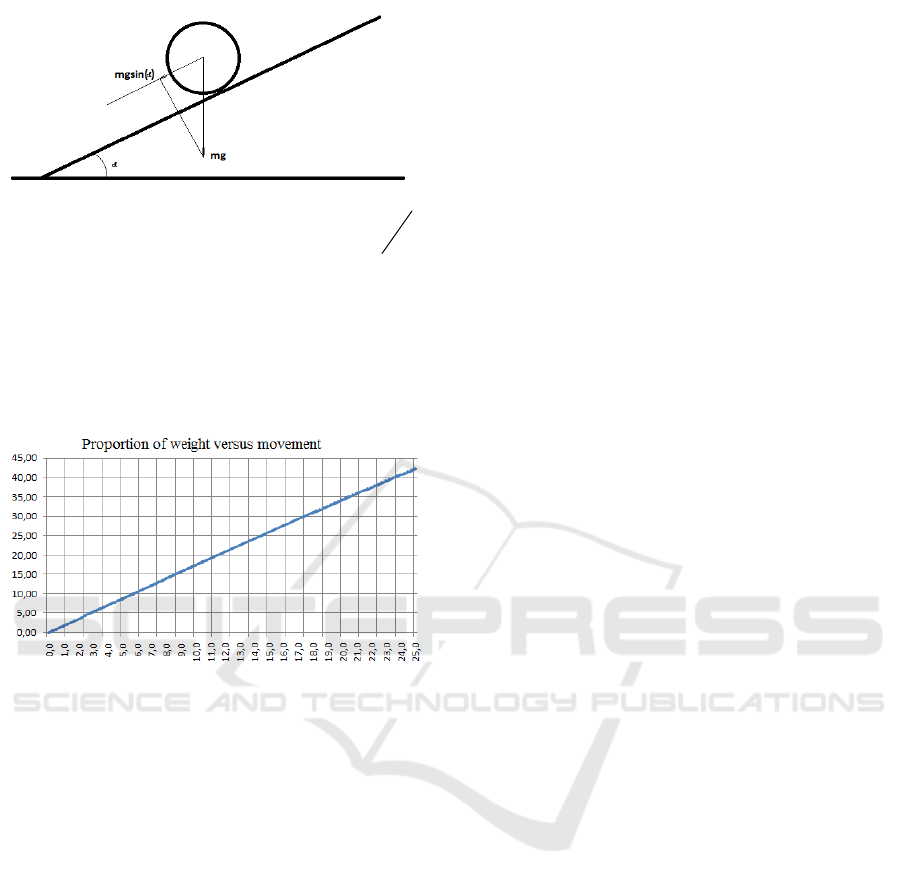
Figure 1: The forces acting on the vehicle during lifting.
If we consider the model problem (see Figure 1) when
lifting a load on an inclined plane, then it is easy to
conclude that an additional force is required for
lifting, proportional to the sine of the lifting angle
))sin(()sin(
качтяжкачтяги
Kmgmg
r
mg
kFFF
(2)
It is known from the school mathematics course
that at small angles (expressed in radians), the sine
behaves almost like a linear function. But, as we must
quantitatively assess the lifted load effect on the force
required to move, we will propose a graph of the
fraction of the gravity force that needs to be overcome
depending on the ascending angle.
Figure 2: Weight proportion when moving uphill.
Although at first glance, the dependence is very
similar to a linear one, it is not. From a practical point
of view, the most important conclusion is that the
force, required for movement, can be tens of percent
of the body weight. For example, with an ascending
angle of just over 10%, about 17% of the weight
should be lifted. And thus the additional force can be
higher than the rolling friction force, which, as can be
seen from the section above, is a percentage of the
body weight, even by an order of magnitude. The
gravity effect becomes commensurate with rolling
forces already at a few degrees.
This result is qualitative. It shows how
unfavorable the rough terrain is in terms of transport
as compared to a plain. For a similar movement in the
mountains, it is required to apply the force, which is
higher by an order of magnitude.
It is for this reason that road engineers are forced
to build bridges and tunnels, so that there are no
sections with a steep rise, although these are very
expensive facilities to build and maintain
(Biondini
and Frangopol, 2012).
3 RESEARCH RESULTS
3.1 Accessibility Areas
One of the main quantitative approaches to assessing
the efficiency of a particular mode of transport or
their combinations is the approach based on the
concept of accessibility areas (Bobrik, 2018).
In the most general case, the accessibility area is
taken as the territory that can be reached from a
specific point, after spending a certain amount of a
particular resource. These resources may include
time, travel costs, fuel costs, comfort levels, and
many others. That is, this is precisely a general
approach that can generate different definitions,
depending on the problem.
For example, for megalopolises, transport
accessibility is often calculated within an hour, which
is largely explained by the physiological reasons of
the human psyche, since after an hour the trip for
passengers begins to seem tiresome. For international
and intercity trips, as well as in geopolitics, the
accessibility area per day is becoming more
significant. For railway freight transport, it is not time
that is of great importance, but the cost of
transportation. Therefore, it is relevant to consider the
accessibility area, for example, for a $ 1,000 tariff.
As it is obvious from the examples above, the
accessibility area is a point characteristic. There are
various methods of how to match this area with a
certain numerical characteristic so that quantitative
comparisons can be made in the future. The most
common way is to estimate an accessibility area using
its square area. But it is not the only one.
At the same time, quite significant fluctuations of
this numerical indicator for different points can be
observed for the territory. In this case, the average
value of the accessibility area, averaged over the
territory of districts or other small territories, gives a
general idea of the transport of the territory. The
ISSDRI 2021 - International Scientific and Practical Conference on Sustainable Development of Regional Infrastructure
364

averaging can be performed, among other things, over
calculated ones (for example, a square cell), and not
necessarily by administrative entities. It makes it
possible to plot maps with any degree of detail or
generalization.
Within the framework of this approach, it is
possible to formulate an inverse problem. How many
resources will be required to reach the accessibility
area with the required numerical characteristic. For
example, if for one city a million inhabitants can be
reached on average in 50 minutes, and for another in
70 minutes, then we get a very visual characteristic
for determining where it is better to start a new
business from in terms of the transport component.
For rough terrain, the accessibility area can
change very dramatically, at times, when laying roads
with bridges and tunnels. It forms conditions for
accelerated socio-economic development (Dettwiler
and Schnelli, 1999). On the contrary, territories that
received recharge based on their transit position to a
large extent, with the appearance of bypass tunnels,
can reduce their socio-economic potential
(Knoflacher, 2001).
3.2 Quality Functional
A general approach based on accessibility areas can
be applied to assess the transport potential of RTT. It
will also allow for a quantitative comparison with a
similar flat area. For this, first of all, it is necessary to
strictly define the functional of the quality of
movement. For RTT, it is proposed to take the energy
consumption during the trip as a basis (Drozdov,
2014).
On a road with a slope, there is a sharp asymmetry
in energy consumption when driving in opposite
directions. Some drivers believe, that when driving
along a mountain serpentine, you should stick to
heuristic rule to go downhill in the same gear as when
going uphill with the same inclination angle. If, when
climbing to overcome the rolling force, it is necessary
to additionally add overcoming the gravity of the load
and the vehicle, which, as shown above, can require
many times more energy, then when moving
downhill, there is practically no relief, or it is much
less than the additional energy consumption when
lifting.
Therefore, in the simplest case, at an infinitely
small displacement with a horizontal shift, the
dl
length and liting
dh
, we will calculate the energy
consumption
dE
by the formula
dhFdlFdE
тяжестикачения
(3)
On the same site, but with a slope, the energy
consumption will be assumed to be
dlFdE
качения
. (4)
The proposed formulas are rough and even
incorrect for many types of vehicles. For example, for
rail transport, recuperation devices are quite common,
when, when driving downhill, electrical energy is
generated back into the mains. Although in less
amount than was spent on the lifting to the same
height. Among vehicles of various types, there is a
very high spread in the values of energy consumption
when driving downhill and when climbing. Usually,
on steep slopes, the vehicle speed decreases, i.e.
energy costs become higher than when driving on a
plain. When moving on foot, there is practically no
acceleration of movement.
Summarizing, the proposed formulas describe the
average situation for a wide range of vehicles. They
can only be used as a first approximation to obtain
some general conclusions. However, even these
formulas are already sufficient to get some
conclusions when moving across rough terrain in the
general case.
If some path
is divided into infinitely small
linear sections, then in this case the total energy
consumption on the path will be calculated according
to the classical integral formula of mathematical
analysis
dEE
(5)
This formula allows us to calculate the total cost
of energy when moving between two points,
depending on the chosen path. If we determine a path
where the minimum energy consumption will be
achieved, then by doing so we can calculate the
energy distance between any two points on the
territory.
4 DISCUSSION
4.1 Representation of a Rough Terrain
by a Graph
In the general case, a territory with a variable
landscape is digitally set using a two-dimensional
array, where each pair of geographic coordinates is
assigned a numerical value of the height above sea
level.
Let us take an arbitrary point
P
of the territory
with coordinates
),( yx
and height above the horizon
),( yxh
. The problem is to calculate the shortest
Transport Performance for Rough Terrain Sustainable Development
365

distances from point
P
to all the nearest points. To
do this, let us assign an oriented symmetric graph to
a specified territory
G
.
Divide the territory into squares with
dx
sides
and
dy
, and calculate the height of the square as the
height of its center. We assume that from the center
of the square you can move to the adjacent squares to
the left - right and up - down, as well as along the
diagonals. If we designate a square as a vertex of a
graph
G
, then each vertex in it will be adjacent to
eight adjacent vertices, except for the boundary
squares. The topology of connectivity in the graph
looks like a cross on the British flag.
Let us determine the length of each edge of the
graph according to formulas (3-4). If the height of
point
P
is less than the height of adjacent point
Q
,
then the length of the edge
),( QP
is calculated by
formula (1), and the length of the edge
),( PQ
is
calculated by formula (2). And vice versa in the
opposite case.
To determine the minimum distance between
vertices
P
and
Q
, one can use Dijkstra's algorithm,
widely used in practice (Kristofides, 1978; Ore,
2009). It determines the entire shortest-distance tree
(SDT) (Emelichev, 1990) for the entire set of points
in the area. Among the branches of this tree, there is
also a path on which the minimum energy
consumption between points
P
and
Q
is achieved.
Moreover, there can be several such paths.
4.2 Indicators of Transport Quality of
the Territory
The SDT obtained as a result of computer
calculations makes it possible to answer a number of
questions about the quality of the territory in terms of
transport.
The SDT for each point allows you to determine
the accessibility area for a given energy consumption
by formula (5).
P
p
D
It is also possible to calculate
its area
)(
p
DS
. As for a flat territory the
accessibility areas represent a circle, comparing the
area
)(
p
DS
with the area of a circle, we get the first
indicator of the transport potential of the territory.
circle
p
S
DS
K
)(
1
(6)
The physical meaning of the indicator
1
K
is in
how many times a smaller area we can achieve at a
given level of energy consumption in comparison
with a flat territory.
For the transport characteristics not of single point
P
, but of a certain territory
G
, you can consider the
average value of the indicator
1
K
on it.
G
dPPK
GS
K )(
)(
1
12
(7)
If a mountain village is selected as a territory, and
the administrative region in which it is located is
selected as the accessibility area, then using the
indicator
2
K
it is possible to assess the transport
discrimination of the inhabitants of this village in
comparison with the plain.
5 CONCLUSIONS
The article presents a new approach for assessing the
transport potential of an area with rough relief, based
on the concept of accessibility areas.
Two quantitative indicators are proposed that
characterize the degree of transport discrimination in
the territory.
An algorithm for the computer calculation of
indicators was developed.
REFERENCES
Bezrukov, L.A. (2008). Continental an Oceanic Dichotomy
in International and Regional Development.
Novosibirsk: Academic Publishing House "Geo".
Biondini, F. and Frangopol, D.M.(Eds.) (2012). Bridge
Maintenance, Safety, Management, Resilience and
Sustainability. Proceedings of the Sixth International
IABMAS Conference, pages 8-12.
Bobrik, L.P. and Bobrik, P.P. (2016). Local Factors in
Determining the Optimal Structure of the Backbone
Transport Network. Transport: Science, Technology,
Management, 11: 28-31.
Bobrik, P.P. (2018). On the Competitiveness of the Land
Economy. Materials of the XXXII Annual Session of the
Economic-Geographical Section of MARS.
"Polarization of the Russian Space: Economic, Social
and Cultural_Geographic Aspects", pages 78-86.
Dettwiler, M., and Schnelli, O. (1999). Design &
construction of Zurich's bypass tunnels. Tunnels &
Tunnelling International, 31(5).
Drozdov, B.V. (2014). Development Areas of the Physical
Economy (relative to the transport complex). Electronic
ISSDRI 2021 - International Scientific and Practical Conference on Sustainable Development of Regional Infrastructure
366

Scientific Publication "Sustainable Innovative
Development: Design and Management", 2(23): 8-94.
Emelichev, V.A. et al. (1990). Lectures on Theory of
Graphs. М.: Nauka.
Forrester, J.W. (1974). World dynamics. Waltham.
MA: Pegasus Communications.
Golts, G.A. (1981). Transport and Accommodation. M.:
Nauka.
Ivashkina, I. and Kochurov, B. (2018). Cities of baikal
region: environmental challenges of spatial
development. Environmental risks for socioeconomic
development. Proceedings of the 3
rd
(2nd STEPS)
Russian-Japanese Collaboration Seminar for
Sustainable Environment, 119–129. MSU Publishers
Moscow.
Knoflacher, H. (2001). Problems caused by the
motorway/railway freight traffic share in the Tyrol.
Proceedings of the Institution of Mechanical Engineers,
Part F: Journal of Rail and Rapid Transit, 215(1): 45-
51.
Kristofides, N. (1978). Theory of Graphs. Algorithmic
Approach.
Meadows, D.H., Meadows, D.L., Randers, J. and Behrens,
W.W. (1972). The limits to growth. New York:
Universe Books.
Meadows, D.H., Meadows, D.L. and Randers, J. (1992).
Beyond the limits. White River Junction. VT: Chelsea
Green.
Ore, O. (2009). Theory of Graphs: Transl. from English.
M.: Book House "LIBROKOM".
Podberezkin, A. and Podberezkina, O. (2014). Eurasianism
as an Idea, Civilizational Concept and Integration
Challenge. Eurasian Integration - The View from
Within. Taylor & Francis. Series: Routledge
Contemporary Russia and Eastern Europe, 46-60.
Wolfe, S. D. (2019). A new road and rail link from the
mountains to the coast. Mega-events: Placemaking,
regeneration and city-regional development.
Transport Performance for Rough Terrain Sustainable Development
367
