
The Estimation of Sustainable Development Trajectories
of the Regional Socio-economic System
Karolina Ketova
a
and Daiana Vavilova
b
Department of Applied Mathematics and Information Technologies, Kalashnikov Izhevsk State Technical University,
Studencheskaya Street, Izhevsk, Russia
Keywords: Regional Socio-Economic System, Economic-Mathematical Modeling, Investments, Sustainable
Development Trajectories, Effective Volume of Labor Resources.
Abstract: The article is solved the problem of constructing sustainable development trajectories of the socio-economic
system on the example one of the regions of the Russian Federation. The problem is formulated on the basis
of a dynamic macro-model of the regional economy, where the development factors are productive capital
and effective volume of labor resources. The effective volume of labor resources is a synergy of the quantity
of the factor (the number of labor resources) and the quality of the factor (the employee's labor efficiency).
The produced at the macro level product is allocated to investments in maintaining and expanding productive
capital, labor resources, and consumption in the macroeconomic regional system. The inclusion of the factor
of the effective volume of labor resources in the macro model is a distinctive feature of this management
problem statement. The solving the problem algorithm is to build trajectories of sustainable economic
development: the trajectories of balanced sustainable growth and the optimal trajectory of the socio-economic
system, which put this system on the trajectory of balanced sustainable growth. The statistical base of the
calculations is the demography data, the volumes of investment in the production and social-educational
sphere of the Udmurt Republic. To solve the problem of identifying unknown parameters of the model, the
period 2000-2019 is used. The optimal investment rates are calculated to allow the economic system to reach
the trajectory of balanced sustainable growth by 2025. The proposed methodology can be used to build
trajectories of sustainable development of socio-economic systems, as well as to conduct parametric model
calculations to identify factors of sustainable economic growth.
1 INTRODUCTION
The stable growth of socio-economic system
indicators in the region is laid down in the
construction of the development strategy, which
determines the amount of financing for the production
and social spheres of activity. The construction of a
development strategy should be carried out using
formalized methods of economic and mathematical
modeling. This approach to problem solving provides
scientific results and allows its practical application.
In this article, search of sustainable development
trajectories of the socio-economic system is carried
out by the model presented in (Belenky and Ketova,
2006; Ketova, 2013), where it is considered as the
initial regional model. A distinctive feature of this
a
https://orcid.org/0000-0001-7143-1930
b
https://orcid.org/0000-0002-2161-4402
problem statement is the inclusion of the factor of the
effective volume of labor resources as the leading
factor involved in the creation of the final product.
Like many factors influencing the behavior of
socio-economic systems, which are explicitly
involved in the construction of development
trajectories and do not have an initially formalized
mathematical form and statistical content, the factor
of effective volume of labor resources consists of
quantitative and qualitative components. The
quantitative component is the number of labor
resources. The qualitative component is formed from
the calculation of the efficiency of worker's labor.
Generalized gross produced product is distributed
for consumption, investments in maintaining and
expanding productive capital and investments aimed
Ketova, K. and Vavilova, D.
The Estimation of Sustainable Development Trajectories of the Regional Socio-economic System.
DOI: 10.5220/0010586901070115
In Proceedings of the International Scientific and Practical Conference on Sustainable Development of Regional Infrastructure (ISSDRI 2021), pages 107-115
ISBN: 978-989-758-519-7
Copyright
c
2021 by SCITEPRESS – Science and Technology Publications, Lda. All rights reserved
107

at developing the labor capital of the region
(investments in the social and educational sphere).
Labor efficiency is an significant indicator for
development of the socio-economic system. The
Decree of Russian Federation’s President of the “On
the Strategy of Economic Security of the Russian
Federation for the period up to 2030” was signed,
according to which, among other things, it should be
ensured to counteract modern challenges to the
country's economic security, and prevent crisis
phenomena in the resource and raw materials,
production, scientific and technological and financial
spheres. Among the statistical indicators, analyzing
the degree of implementation of the Strategy, there is
a category of “labor efficiency”, which is reflected by
the labor productivity index (Caron, Fally and
Markusen, 2020).
The labor productivity is an indicator of the
economic efficiency of labor potential and
technologies (Shumilina and Tsvil, 2019; Jaume,
2021). Labor efficiency is also characterized the
ability to create goods and services and reflects the
level of well-being of the population. At the same
time, high labor efficiency affects the potential of
labor resources, formed for the future (Ketova, 2007;
Ketova, Rusyak and Derendyaeva, 2013).
At present, there is no single coherent theory of
assessment of the labor efficiency. A detailed analysis
of this problem is presented in (Galiullin, Ermakov
and Simonova, 2017; Tavani and Zamparelli, 2021),
where several generalized points of view are
accepted.
In many educational institutions on the economics
of enterprise and labor, in academic dictionaries, the
concept of “labor efficiency” is synonymous of the
“labor productivity”.
According to the International Labor
Organization’s methodology (ILO), labor
productivity is the ratio of gross domestic product
(GDP) to the total number of employees. According
to the Organization for Economic Cooperation and
Development’s methodology (OECD), labor
productivity is defined as the ratio of GDP to hours
worked. The Russian Federal State Statistics Service
calculates the labor productivity at the macro level as
a result of dividing the GDP volume index by the
change in total labor costs.
Another criterion for assessing labor efficiency is
wages. Usually, it is the main source of income for
most citizens. Wages reflect the level of well-being of
the population (Aranzhin, 2019; Heil, 2020).
The issues of reasearching the relationship
between labor productivity and its payment are
considered in many scientific works (Smirnov and
Sannikov, 2008; Jung and Lim, 2020). The growth in
labor productivity must be accompanied by a
proportional increase in wages. It improves economic
efficiency indicators (Park and Rieu, 2020; Da
Silveira and Lima, 2021).
The relationship between labor productivity and
wages differs from region to region and from country
to country. Also, the degree of interconnection of
these indicators differs by the territorial regional
aspect (Drobot, Makarov and Yarikova, 2019;
Varlamova and Larionova, 2020; Laskiene,
Pekarskiene and Kontautiene, 2021). So, generalized
assessment of the level of wages is an objective
characteristic of labor efficiency and allows using it
in the model of socio-economic development of the
regional socio-economic system of the Udmurt
Republic (Ketova, 2013).
The quantitative component of the effective
volume of labor resources is calculated as a result of
solving the problem of modeling and forecasting
demographic dynamics, which is presented in detail
in (Belenky and Ketova, 2006; Rusyak and Ketova,
2008). The constructed forecast functions of the labor
force and the total population of the region are
explicitly introduced into the model of optimal
management of the socio-economic system.
Generalized gross produced product is allocated
for consumption, investments in maintaining and
expanding productive capital and investments i
effective volume of labor resources in the region.
The algorithm for solving the problem is to
estimate trajectories of sustainable economic
development.
The trajectory, along which the socio-economic
system should move to achieve high results of
economic development, is called the trajectory of
balanced sustainable growth. Since the studied socio-
economic system, as a rule, is not initially located on
it, then it must reach this trajectory of sustainable
development. To do this, we construct the trajectory,
called the trajectory of the optimal trajectory of
movement of a specific socio-economic system,
which put this system onto the trajectory of balanced
sustainable growth.
Solving the problem of estimating sustainable
development trajectories of socio-economic systems,
taking into account such an indicator as labor
efficiency, is great practical importance. The solution
of this problem is made on the example of the regional
socio-economic system – the Udmurt Republic (UR).
ISSDRI 2021 - International Scientific and Practical Conference on Sustainable Development of Regional Infrastructure
108

2 RESEARCH MATERIALS AND
METHODS
2.1 Problem Definition
The following main provisions are adopted.
1. At the macro level, when modelling the
economic dynamics of the region, we consider
generalized indicators: gross regional product
Y
(GRP), consumption
C , productive capital
K
(PC)
investment in the PC
I
, the effective size of the
labour resources
Z
, investment in workforce
development in the region
E .
2. We distinguish two population groups: the total
population of the region
tP and the working
population
tL (produce GRP). The ratio of these
two population groups
1,0
PL , because
tPtL 0 . The curves
tP and
tL are
obtained as a result of solving the problem of
demographic dynamics and are introduced into the
model in an exogenous way. The ratio is calculated
using the formula:
l
ll
dt
dttdtt
tP
tL
t
wwmm
0
00
),(
,,,,
)(
)(
)(
(1)
В формуле (1)
),(t age distribution function of
the population
per year
t
(density),
,t
percentages of people age
, which participate in the
production of GRP per year
t
,
l
lifetime.
The subscripts of
τt, and ),( t make it possible
to divide into women and men to clarify the accuracy
of the calculations, since the time for leaving the
economically active age is still different here.
3. The effective volume of labor resources
tZ
depends on the average efficiency of one employee
tz and the number of labor resources:
)()( tztLtZ .
4. The management problem is considered in
continuous time with a finite planning interval
T
tt ,
0
; – discount coefficient.
5. The phase variables of the model are the
productive capital
K
and the efficiency of one
employee
tz , change in time is described by the
equations:
KIK
k
and Z
L
E
z
z
;
k
and
z
are the coefficients of retirement of the
relevant factors of production.
6. The volume of output is determined by the
production function
ZKFY ,
. It is an upward
convex function, monotonically increasing in each
variable, as well as a linearly homogeneous function:
.,,, zkLFLZLKLFZKF
Here LKk
and
LZz /
are unit (per worker) values of
productive capital and the effective volume of labor
resources, respectively.
7. There is a distribution of the produced product
EICY
into 3 parts for every year
T
ttt ,
0
: investment
EI ,
in production factors
ZK ,
, respectively, and consumption C (Figure 1).
1t
K
1t
z
1t
L
Сapital
t
K
Labor
t
L
Efficiency
t
z
Gross regional
product
t
Y
Investment
t
E
Consumption
t
C
Investment
t
I
Figure 1: Economy reproduction cycle diagram.
8. In the socio-economic system
T
ttt ,
0
a
minimum level of consumption
min
C must be
maintained, which means that
min
CCC
. Then
minmin
),(:),(,: CZKFZKFCYY
, and
there are natural restrictions of the problem
);,(0
min
ZKFC
.0,,,0 EICEICY
9. Management in the socio-economic system is
carried out according to the vector
),,(
zkc
ssss ,
where are
YCs
c
the consumption rate,
YIs
k
the investment rate in
K
,
YEs
z
the investment rate in
E , and 1
zkc
sss .
10. Differential equations for phase variables
taking into account
YCs
c
,
YIs
k
,
YEs
z
and due to the transition from absolute values to unit
ones
,/,,
minmin
PCcLYyLKk
,/),(),(),(
min
czkfzkfLZKFLYy
take the form:
,
~
, kzkfsk
kk
LL
kk
~
,
zzkfsz
zz
,
. Initial and final states of the
system are describes by formulas:
. ,; ,
0000 TTTT
ztzktkztzktk
Moreover
)(),(
**
TTTT
tzztkk
, where are
The Estimation of Sustainable Development Trajectories of the Regional Socio-economic System
109

**
, zk
– the values of variables on the trajectory of
sustainable balanced growth. If during the planning
period
T
, the socio-economic system manages to
enter the trajectory of sustainable balanced growth,
then it remains on it until the end of the period
T
.
11. The criterion of optimality management is the
unit (per person) discounted maximum consumption
accumulated over the entire planning period
T
tt ,
0
:
s
t
t
tt
c
dteczkfsCr
T
max,
0
0
min
(2)
The set of admissible management has the form:
l
cllzkl
ssssss 1,1,0:,
(3)
12. Information passport of the problem (initial
information) has the form:
Tcf ,,,,,,
~
min21
.
The formulated problem is the task of estimating
trajectories of sustainable development by the socio-
economic system, taking into account the effective
volume of labor resources.
2.2 Solving Problem Algorithm
We talk about two parts of the optimal trajectory of
the system. The first section is a transition period until
a stable growth trajectory is reached, the second
section is movement along this trajectory. The studied
model belongs to the class of RKK models of
economic dynamics. The RKK-model is a model
based on the ideas of F. Ramsey, D. Kass and
T. Koopmans, presented in the works (Ramsey, 1928;
Cass, 1965; Koopmans, 1965). An adapted form of
models of this class can be found in (Belenky, 2007;
Ketova, 2013).
The solving problem algorithm is to estimate
trajectories of sustainable economic development.
This is the optimal trajectory of the socio-economic
system, which brings the system onto the second
trajectory is trajectory of balanced sustainable
growth.
Let us denote a vector of phase variables is
zkx , , a vector of dual variables is
,,
zk
a vector of management variables is
zkc
ssss ,, .
The Hamiltonian
txsΗ ,,, of this problem has the
form:
zzkfskzkfs
eczkfsstxsΗ
zzzkkk
t
zk
,
~
,
,1,,,
min
(4
)
We ignore the existence of phase restrictions. The
above condition
fc
min
0 allows the socio-
economic system to be in the area where
.0, zkf
The necessary conditions of the Pontryagin
maximum principle (Pontryagin, 1961; Intriligator,
2002) in relation to the problem (items 1-12) are as
follows:
For each fixed
Tt ,0
:
txsΗts
txsΗts
zk
zk
ss
z
ss
k
,,,maxarg
,,,maxarg
),(
),(
(5
)
Dual variables must satisfy the system of
differential equations:
z
H
k
H
zk
,
(6
)
Phase variables must satisfy systems of
differential equations with boundary
conditions:
,,
zk
H
z
H
k
TT
zTzkTkzzkk
,;0 ,0
00
(7
)
Introducing a replacement for the vector of dual
variables is
zk
,
,,
t
zz
t
kk
ee
(8
)
we transform (4) to the form:
zzkfse
kzkfse
eczkfsstxsΗ
zz
t
z
kk
t
k
t
zk
,
~
,
,1,,,
min
(9
)
Condition (5) in relation to (9) is written as:
zzkk
s
ssmaxarg
(10
)
ISSDRI 2021 - International Scientific and Practical Conference on Sustainable Development of Regional Infrastructure
110

whence we define the management parameters –
ts
k
and
ts
z
.
The quantity present in (10) is a function of time,
therefore takes place quasi-stationary nature of the
optimal trajectory manifests itself.
The system of equations (6), taking into account
the replacement (8), can be written in the formula
(11):
,1
, ,1
~
/
/
zkfssss
zkfssss
zzzkkzk
zzz
k
zzkkzk
kkk
(11
)
and system (7) takes the form:
.,
,
~
,
zzkfsz
kzkfsk
zz
kk
(12
)
The trajectory of balanced sustainable growth is
determined from the conditions:
,
zk
(13
)
,
zk
(14
)
Substituting (13), (14) in (11), (12), we find the
parameters of trajectories of balanced sustainable
growth
*
k
,
*
z
,
k
s
,
z
s
:
.,
,,
~
,,
,
~
,
****
****
**/
**/
zkfzzs
zkfkks
zkf
zkf
zz
kk
zz
k
k
(15
)
To estimate the optimal trajectory of the socio-
economic system until the trajectory of balanced
sustainable growth is reached, nonstationary
equations (11) and (12) are used, which are solved in
reverse time using the numerical modified Euler
method with correction (Kalitkin, 2011). Based on the
initial values of the variables
0000
, ztzktk
,
when problem solving the time point
t
is selected at
which the optimal trajectory of the socio-economic
system enters the trajectory of balanced sustainable
growth. In parallel, when solving, the values of the
variables
t
zk
,
and
t
zk
ss ,
are restored. At the
final stage, the problem of optimal distribution of
investments is solved in a straightforward way.
3 RESULTS OF ESTIMATION
SUSTAINABLE
DEVELOPMENT
TRAJECTORIES OF THE
REGIONAL SOCIO-
ECONOMIC SYSTEM ON THE
EXAMPLE OF THE UDMURT
REPUBLIC
Statistical data of socio-economic indicators of UR
are presented on the website of the Federal State
Statistics Service (http://www.gks.ru) in the Official
Statistics section (subsection “National Accounts”,
subsection “Population” and subsection
“Entrepreneurship”) and on the website of the Federal
Treasury (http://www.roskazna.ru) in the Budget
Execution section.
Table 1 and Table 2 present statistical data of UR
for the period 2000-2019 for all macroeconomic
indicators in comparable values, that are involved in
the model and are described in the first part of this
article.
The parameters, presented in the information
passport of the optimal management problem of the
socio-economic system of the region are to be
determined. They were calculated for the period
2000-2019 based on statistical data on UR (economic
indicators are given to comparable prices in 2019) in
accordance with the algorithm for identifying
unknown parameters (Ketova and Rusyak, 2009).
The following values are obtained:
,03.0
~
k
,07.0
z
ZKFY ,
46.054.0
72.0 ZK
. Discount
factor is
05.0
, planning period is 10T years,
Yc 4.0
min
.
The Estimation of Sustainable Development Trajectories of the Regional Socio-economic System
111
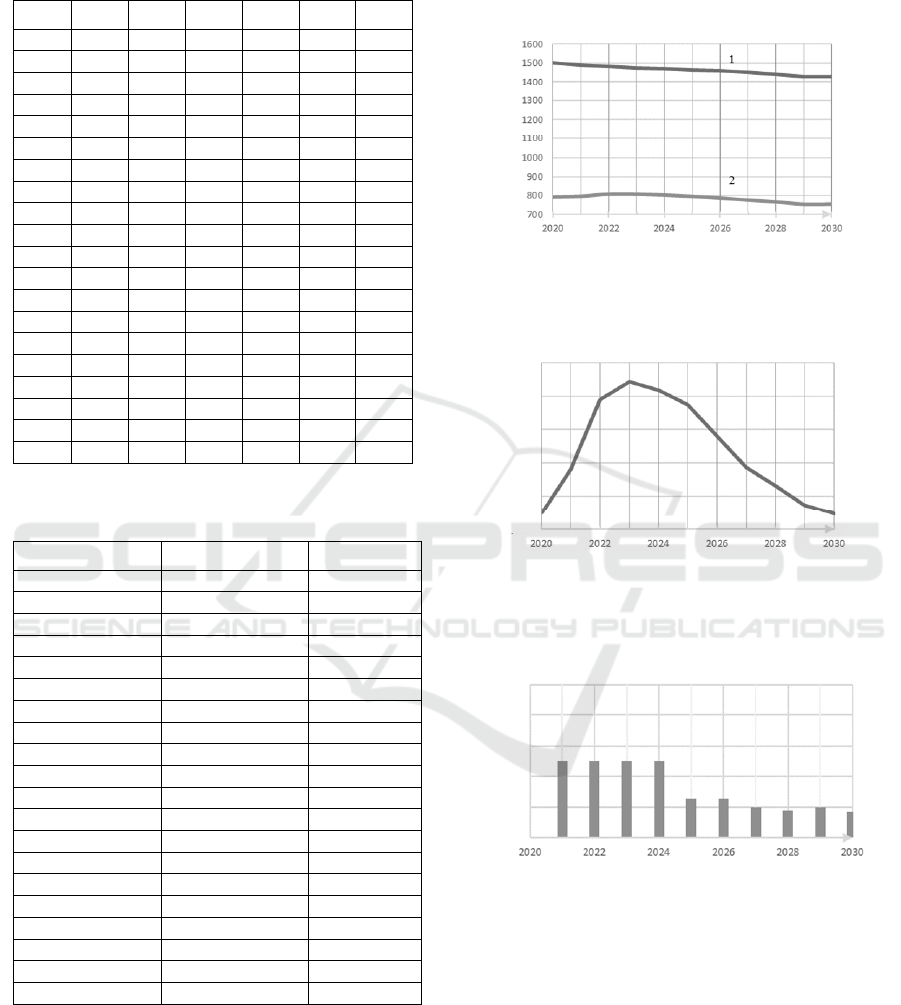
Table 1: Macroeconomic indicators of the UR for the period
2000-2019, measured in billion rubles, are expressed in
current year prices.
t
Y
K
Z
I
E
C
2000 53 184 192 10 5 38
2001 65 221 248 12 6 47
2002 78 255 263 15 9 54
2003 89 279 283 18 11 60
2004 100 315 287 22 14 65
2005 140 368 346 27 20 93
2006 165 394 403 34 27 103
2007 206 484 417 45 40 121
2008 243 553 488 54 45 145
2009 231 592 455 41 45 145
2010 275 650 434 51 48 175
2011 336 697 432 62 56 218
2012 373 817 421 64 70 238
2013 405 870 435 83 80 242
2014 450 975 371 92 84 275
2015 518 1041 358 82 90 346
2016 532 1170 353 87 92 352
2017 552 1246 336 84 89 380
2018 631 1363 315 97 103 432
2019 694 1458 346 101 110 464
Table 2: Social indicators of the UR for the period 2000-
2019, measured in thousands of people.
t
P
L
2000 1591.8 809.0
2001 1583.1 799.8
2002 1573.2 821.2
2003 1564.6 808.3
2004 1557.7 803.0
2005 1550.1 823.0
2006 1542.2 846.5
2007 1535.8 838.4
2008 1530.6 839.4
2009 1526.7 854.8
2010 1522.8 831.9
2011 1519.2 837.7
2012 1517.9 829.7
2013 1517.4 828.4
2014 1517.3 822.8
2015 1517.3 820.5
2016 1517.0 806.5
2017 1514.9 788.7
2018 1510.2 781.2
2019 1505.2 788.6
For determining the predicted share of the
economically active population of the UR in the total
population, forecast of their dynamics is built for the
period 2020-2035, based on the results of solving the
problem of demographic dynamics (Ketova, 2013).
The size of the general and economically active
population groups of the UR are presented in Figure
2, a, the dynamics of the share of the economically
active population is shown in Figure 2, b.
L
, thousands of
p
eople
t, year
Figure 2, a: Forecast dynamics of the population of UR for
the period 2020-2035: total number (1), economically
active population (2).
λ
t, year
0.550
0.545
0.540
0.535
0.530
0.525
Figure 2, b: Forecast dynamics of the economically active
population share in the total population of the UR for the
period 2020-2035.
k
s
t, year
1.0
0.8
0.6
0.4
0.2
0.0
Figure 3, a: Change management parameter
k
s .
Figures 3, a, b and Figures 4, a, b show some
results of solving the problem of constructing
trajectories of sustainable economic growth in the
region. Calculations were made using comparable
data for 2019. The socio-economic system reaches
the trajectory of balanced sustainable growth and
remains on it thanks to the management strategy (10).
ISSDRI 2021 - International Scientific and Practical Conference on Sustainable Development of Regional Infrastructure
112
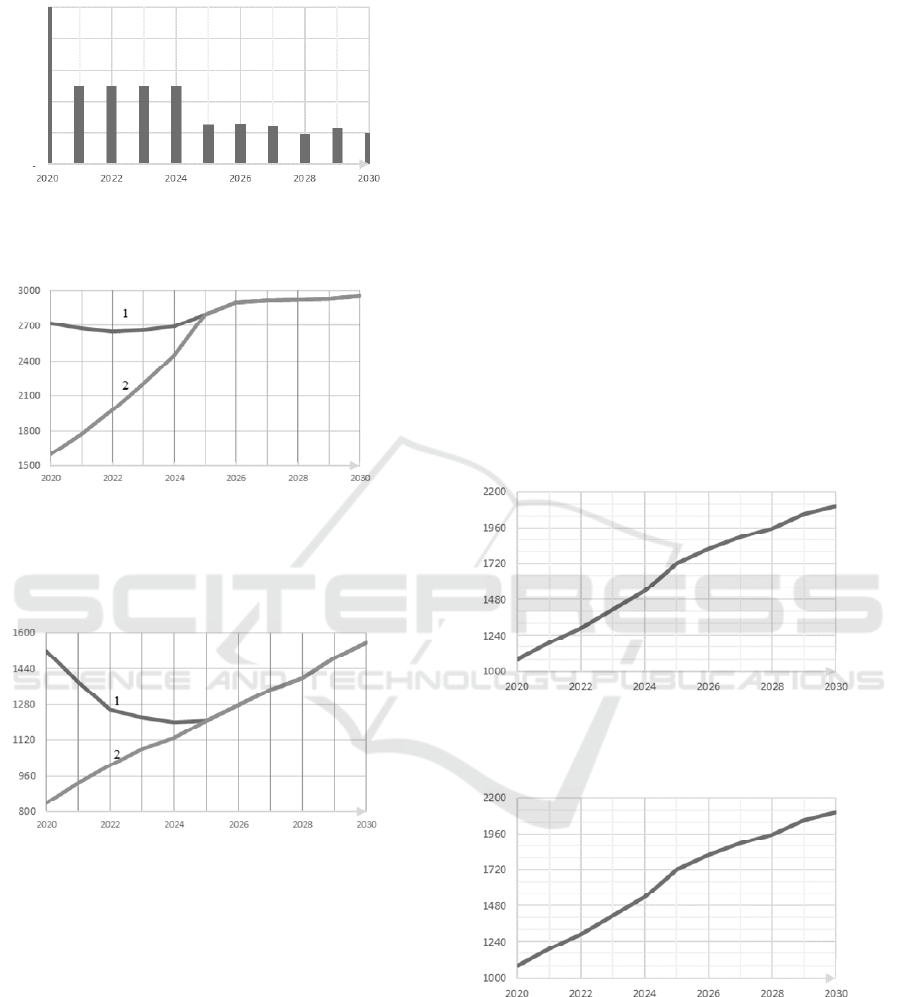
z
s
t, year
1.0
0.8
0.6
0.4
0.2
0.0
Figure 3, b: Change management parameter
z
s
.
k
, thousands of rubles /people
t, year
Figure 4, a: Phase coordinate trajectories k : optimal
trajectory of change (1), trajectory of balanced sustainable
growth (2).
z
, thousands of rubles /people
t, year
Figure 4, b: Phase coordinate trajectories
z
: optimal
trajectory of change (1), trajectory of balanced sustainable
growth (2).
Initially, the actual unit level (per employee) of
the value of productive capital is above the value on
the trajectory of sustainable balanced growth, which
we should achieve (Fig. 4, a), the unit level of the
value of the effective volume of labor resources is
below the optimal values (Fig. 4, b). At the initial
moment of time, the capital-labor ratio is closer to the
sustainable development trajectories than labor
efficiency. Implementing the strategy of managing
the socio-economic system (10), we initially build up
the factors farthest from the trajectory of sustainable
balanced growth. At first, there is an increase in the
share of investments in the development of the labor
potential of the region.
In 2025, there is an exit of the socio-economic
system on the sustainable balanced growth trajectory.
A reduction in capital investment in factors of
production begins. There is an opportunity to increase
the consumption component.
Thus, as calculations are shown, in the
implementation of the scenario of optimal
management, the productive capital at the first stage
decreases, which is explained by the need to withdraw
obsolete assets that have low productivity and incur
large material costs for maintenance. This policy
opens up the opportunity to increase labor efficiency
by 1.7 times by 2025. Since 2023, there has been an
increase in productive capital. The optimal
distribution of investments between the production
and social spheres of the region makes it possible to
increase the unit gross regional product by 2030 by
1.94 times (Figure 5, a).
y
, thousands of rubles /people
t, year
Figure 5, a: Dynamics of the unit value of gross regional
product for the planning period 2020-2030.
, thousands of rubles /people
t, year
Figure 5, b: Dynamics of the accumulated unit consumption
for the planning period 2020-2030.
Let’s consider the time period, when the socio-
economic system is located upon the trajectory of
balanced sustainable growth. We see a significant
increase of GRP.
This state of affairs is due to the fact that in the
first years the basic production assets are actively
increased and funds are invested in the labor
The Estimation of Sustainable Development Trajectories of the Regional Socio-economic System
113

resources of the region. Consumption in the socio-
economic system is kept to a minimum. When the
system reaches the trajectory of balanced sustainable
growth, the rate of increase in labor productivity
)(ty
decreases due to a decrease in the rate of growth of
factors of production. The consumption in the system
is increasing, unit value is
min
c
92 thousand rubles
in year (in prices of 2019).
The criterion functional (accumulated
consumption per inhabitant of the region), reaches
2026 thousand rubles by the end of the planning
period. (Figure 5, b).
Annual consumption is not constant over the
entire planning horizon. So, until both phase
coordinates enter the trajectory of sustainable
balanced growth (2025), consumption is constant and
amounts to 92 thousand rubles per person in year. The
period of movement towards the trajectory of
sustainable balanced growth is characterized by a
significant share of deductions from GRP to
production factors. Further, we have the opportunity
to increase the share deducted for consumption (about
60% of the GRP). This ensures a rapid increase in the
specific welfare.
4 CONCLUSIONS
In sum, the sustainable development trajectories of
the regional socio-economic system are estimated on
the example of the Udmurt Republic. The trajectory
of balanced sustainable growth and the optimal
trajectory of movement of the socio-economic
system, which brings this system to the trajectory of
balanced sustainable growth, have been constructed.
The calculations are based on statistical data for the
period 2000-2019. The forecast is carried out until
2030 inclusive.
The presented in the article algorithm for the
construction of sustainable socio-economic
development trajectories allows solving the problem
of determining the optimal proportions between
investments in production factors and consumption.
The results of solving the problem on the example of
a specific regional system made it possible to
conclude that an effective balanced increase in the
rate of well-being is the result of the harmonious
development of productive capital and social capital.
It is necessary to invest in the efficiency of the
region’s labor resources on a par with productive
capital. These attachments must be of the same order.
As a result of solving the management problem on
the example of the socio-economic system of the
Udmurt Republic, the optimal values of the region's
macroeconomic indicators are obtained. It is shown
that the system can reach a balanced trajectory of
sustainable economic growth with the
implementation of the optimal control scenario by
2025, which will make it possible to increase the GRP
by almost 2 times. It was revealed that at this stage,
the priority is the development of the factor of
efficiency of labor resources of the region, which
allows achieving the fastest growth of economic
indicators.
REFERENCES
Aranzhin, V. V. (2019). The relationship of wages and
productivity: trends in the conditions of economy
digitization. In Russian journal of labor economics.
Vol. 6. No. 1. DOI:10.18334/et.6.1.39938. (in Russ.).
Belenky, V. Z., Ketova. K. V. (2006). The complete
analytical solution of the macro-model of regional
development for the exogenous demographic
prognosis. In Economics and Mathematical Methods.
Vol. 42. No. 4. (in Russ.).
Belenky, V. Z. (2007). Optimization models of economic
dynamics. Conceptual apparatus. One-dimensional
models. Nauka. Moscow. (in Russ.).
Caron, J., Fally, T., Markusen. J. (2020). Per capita income
and the demand for skills. In Journal of International
Economics, 123, 103306.
Cass, D. (1965). Optimum Growth in an Aggregative
Model of Capital Accumulation. In Rev. of Econ.
Studies. Vol. 32.
Da Silveira, J. J., Lima, G. T. (2021). Wage inequality as a
source of endogenous macroeconomic fluctuations.
Structural Change and Economic Dynamics, No. 56.
Drobot, E. V., Makarov, I. N., Yarikova, E. V. (2019).
Spatial development of Russia: problems of
differentiation in the conditions of globalization. In
Journal of International Economic Affairs, Vol. 9. No.
4. DOI:10.18334/eo.9.4.41347. (in Russ.).
Galiullin, Kh. Ya., Ermakov, G. P., Simonova, M. V.
(2017). Concept of labor efficiency. In Russian journal
of labor economics, Vol. 4. No. 3.
DOI:10.18334/et.4.3.38263. (in Russ.)
Heil, M. (2020). How does finance influence labour market
outcomes? A review of empirical studies. In Journal of
Economic Studies, No. 47(6).
Intriligator, M. (2002). Mathematical methods of
optimization and economic theory, Iris press. Moscow,
(in Russ.).
Jaume, D. (2021). The labor market effects of an
educational expansion. In Journal of Development
Economics, No. 149, 102619.
Jung, J. H., Lim, D. G., (2020). Industrial robots,
employment growth, and labor cost: A simultaneous
ISSDRI 2021 - International Scientific and Practical Conference on Sustainable Development of Regional Infrastructure
114

equation analysis. In Technological Forecasting and
Social Change, No. 159, 120202.
Kalitkin, N. N. (2011). Numerical methods. Nauka.
Moscow. (in Russ.).
Ketova, K. V. (2007). A mathematical economic model of
the manpower resource potential and cost
characteristics of demographic losses. In Expert Syst.
Appl, No. 3 (7). (in Russ.).
Ketova, K. V., Rusyak, I. G. (2009). Identification and
forecast of generalized indicators of regional economic
system development. In Applied Econometrics, No. 3.
Ketova, K. V. (2013). Mathematical Models of Economic
Dynamics, IStU publishing house, Izhevsk. (in Russ.).
Ketova, K. V., Rusyak, I. G., Derendyaeva, E. A. (2013).
Solution of the problem of optimum control regional
economic system in the conditions of the scientific and
technical and social and educational progress. In
Mathematical modelling, No. 10 (25). (in Russ.).
Koopmans, T. C. (1965). On the Concept of Optimal
Economic Growth. In Pontificae Academiae
Scientiarum Scripta Varia, Vol. 28.
Laskiene, D., Pekarskiene, I., Kontautiene, R., (2021).
Regional income inequality in Lithuania. In Economy of
Region, No. 16 (4).
Park, H. W., Rieu, D. M., (2020). A Mathematical
Formulation of the Dual Nature of Unproductive Labor.
In Review of Radical Political Economics, No. 52.
Pontryagin, L. S. (1961). Mathematical theory of optimal
processes, Nauka, Moscow. (in Russ.).
Ramsey, F. P. (1928). A Mathematical Theory of Saving.
In Econ. J., Vol. 38, No. 152.
Rusyak, I. G., Ketova, K. V. (2008). Analysis of
Demographic Losses Economic Characteristics. In
Tomsk State University Journal, No. 310. (in Russ.).
Shumilina, V. E., Tsvil, M. M. (2019). Statistical modeling
and forecasting of the index of labor productivity in the
Russian Federation. In Bulletin of Eurasian Science, No.
1. (in Russ.).
Smirnov, M. A., Sannikov, O. V. (2008). Labor
productivity, wages and economic efficiency of labor. In
Living standards of the population of Russian regions,
No. 2. (in Russ.).
Tavani, D., Zamparelli, L., (2021). Labor-augmenting
technical change and the wage share: new
microeconomic foundations. In Structural Change and
Economic Dynamics, No. 56.
Varlamova. J., Larionova. N. (2020). Labor Productivity in
the Digital Era: A Spatial-Temporal Analysis. In
International Journal of Technology, No. 11 (6).
The Estimation of Sustainable Development Trajectories of the Regional Socio-economic System
115
