
Multi-Temporal Inundated Areas Monitoring Made Easy: The Case
of Kerkini Lake in Greece
Ioannis Manakos
1
a
, Malak Kanj
2
b
, Michail Sismanis
1
c
, Ioannis Tsolaikidis
3
d
and Chariton Kalaitzidis
2
e
1
Information Technologies Institute, Centre for Research and Technology Hellas, Thessaloniki, Greece
2
Department of Geoinformation in Environmental Management, Mediterranean Agronomic Institute of Chania,
Chania, Greece
3
Lake Kerkini Management Authority, Kerkini, Serres, Greece
Keywords: Inundation Mapping, Automatic Thresholding, Sentinel-2, Sentinel-1, Kerkini Lake, Wetland.
Abstract: Satellite data may support management of wetland areas for monitoring of the inundation seasonality.
Previously successful in Doñana and Camargue Biosphere Reserves, this study examines the transferability
of unsupervised inundation mapping through automatic local thresholding in discriminating inundated areas
from non-inundated ones in Kerkini Lake. Nine different alternatives of this approach are employed on
Sentinel-2 (S2) Level-2A images (2016-2019). The best fit alternative was derived by the validation against
local and on-site registered attributes. To overcome unfavourable atmospheric conditions, Sentinel-1 (S1)
images were examined in tandem with derived S2 inundation maps (S2m), using the best fit alternative.
Two S2m, one preceding and one following a target S1 image, were used to train random forest models (per
pixel) to be applied to the target S1 image and derive the respective inundation map (S1m). S1m was
validated against a S2m for the same date; not previously used in the training process. Classification
performance reached k [0.77-0.94] and overall accuracy [88.05-97.16%] for the S2m. The evaluation of
S1m showed k of 0.99 and overall accuracy between 99.71-99.88%. Automation of the process and
minimum human interference supports its usage by non-specialists, e.g. for Protected Areas management.
a
https://orcid.org/0000-0001-6833-294X
b
https://orcid.org/0000-0002-6776-4692
c
https://orcid.org/0000-0001-6387-5849
d
https://orcid.org/0000-0001-6848-189X
e
https://orcid.org/0000-0001-5217-7164
1 INTRODUCTION
Wetlands are fundamental for maintaining life on
Earth and demonstrate high biodiversity. They
provide different ecosystem services that ultimately
affect human wellbeing (Finlayson & D’Cruz,
2010; Millennium Ecosystem Assessment, 2005).
They provide for food and shelter, flood control
and climate regulation, as well as for supporting
and maintaining biogeochemical cycles and soil
formation. Nowadays, they are seen as having a
cultural role to visitors, too, as they provide a good
source of income from tourism and recreation.
These ecosystem services along with their rapid
decline as a result of human pressures and climate
change urge for capacity improvement in
monitoring status. In this context, water presence
and extent across time is as seriously treated as
water quality maintenance. The variability of water
extent is vital for any decision to tackle any
misbalances in ecosystem services (e.g. cattle
feeding vs. bird nesting). Spaceborne Earth
Observation monitoring can be a powerful
approach for accurate and cost-effecting frequent
monitoring of open water surfaces.
Numerous approaches, utilizing optical and
radar data for water surface area estimation, can be
used to rapidly generate flood extent maps in real
time, with no additional need for supplementary
data (Cohen et al., 2019; Marti-Cardona et al.,
48
Manakos, I., Kanj, M., Sismanis, M., Tsolaikidis, I. and Kalaitzidis, C.
Multi-Temporal Inundated Areas Monitoring Made Easy: The Case of Kerkini Lake in Greece.
DOI: 10.5220/0010555700480055
In Proceedings of the 7th International Conference on Geographical Information Systems Theory, Applications and Management (GISTAM 2021), pages 48-55
ISBN: 978-989-758-503-6
Copyright
c
2021 by SCITEPRESS – Science and Technology Publications, Lda. All rights reserved

2013). Radar data-based approaches have an
advantage over optical data ones by operating
under nearly all weather and day-night conditions.
However, emergent vegetation, waves, sand, and
radar shadows produced by terrain features hinder
the efficient delineation between water and land
(Kordelas et al., 2019; Manakos et al., 2019).
Evidently, extraction of the water surface from
optical imagery is generally more straightforward
than radar imagery. The rich spectral information
of optical data allows for the reliable detection of
the water presence by utilizing various indices and
bands; especially, when applying thresholds to
them. Commonly used thresholding approaches to
indices, include Normalized Difference Water
Index (NDWI) (Du et al., 2016; McFeeters, 1996;
Zhang et al., 2018), Modified NDWI (Xu, 2006),
and the Automated Water Extraction Index (Feyisa
et al., 2014; Guo et al., 2017; Rokni et al., 2014;
Zhang et al., 2018). Numerous classification
methods, supervised and unsupervised, have been
applied in detecting water bodies and their extent
from multispectral imagery (Kordelas et al., 2019;
Thenkabail, 2015). Furthermore, machine learning
algorithms (MLA) have been employed for remote
sensing image analysis and demonstrated improved
accuracies for inundation map derivation.
Commonly used MLAs include k-Means
(Yousefi et al., 2018), Artificial Neural Networks
(Skakun, 2010), Support Vector Machine
(Nandi et al., 2017; Sarp & Ozcelik, 2017),
Decision Trees (Acharya et al., 2019), and Random
Forest (Feng et al., 2015; Ko et al., 2015).
These classification-based approaches may achieve
higher accuracy than thresholding; however,
ground truth data are required to select appropriate
training samples. This, in turn, requires skilled
personnel or enhanced human interference with the
process.
Focusing on non-supervised inundation
mapping, automatic local thresholding methods
have been successfully applied to Doñana and
Camargue Biosphere Reserves; both with optical
data alone or by fusing radar and optical data
sources by means of machine learning, to increase
information retrieval capacity (Kordelas et al.
2018, 2019; Manakos et al, 2019). This study
examines the transferability of the methods to
monitor inundation seasonality of a river deltaic
system entering an inland lake at the foothills of
Kerkini Mountain in North Greece.
2 MATERIALS AND METHODS
2.1 Study Area
Lake Kerkini (41°13’N, 23°08’E) refers to the
artificial lake (reservoir) created in 1932 and the
surrounding wetland area. Its surface area of 70-76
km
2
lies at the transboundary of Strymonas River in
northern Greece close to the border with Bulgaria.
Its drainage area extends over 11,600km
2
, with the
Hellenic sub-basin making up to 803 km
2
(Ovakoglou et al., 2016; Psilovikos & Margoni,
2010). Kerkini climate is an intermediate between
Mediterranean and Mid-European, with hot
summers and cold winters. The average annual
rainfall reaches 463.5 mm and occurs in two peaks,
one during the cold period of the year and the other
during May-June (Gerakes, 1989).
Lake Kerkini has developed into one of the most
popular stops for migratory bird populations in
Europe, as well a wetland of international
significance; established as a Natura2000 protected
area and a RAMSAR wetland of international
importance. Kerkini accommodates over 300 bird
species; with at least 1300 plant species; including
indigenous and rare species, as well as Greece’s
largest water buffalo population (Bubalus bubalis).
Thus, understanding inundation seasonality is
crucial for the Lake Kerkini Management Authority
to balance nesting and feeding needs of the
migrating birds, feeding needs of buffalos and
irrigation needs of the Serres plain.
2.2 Satellite Imagery
Sentinel-2 Level-2A (L2A) products were
downloaded from the Copernicus European Space
Agency (ESA) hub between 6 September 2017 and
27 August 2019 (52 products), as well as 24 S2
Level-1C (L1C) products between 16 November
2015 and 23 July 2017. The acquired products
comprise the tile 34TFL. S2 L1C Top-of-
Atmosphere (TOA) products were processed to L2A
Bottom-of-Atmosphere (BOA) products using
Sentinel-2 Level2A Prototype Processor (Sen2Cor)
software downloaded in the ESA SNAP Desktop
third-party plugin of the Sentinel-2 Toolbox.
Sen2Cor has a high performance in generating the
Scene Classification layer (SCL) (92 ± 4%) (Main-
Knorn et al., 2017).
To assess the application of the unsupervised
automatic local thresholding during unfavourable
atmospheric conditions for S2 image acquisition 11
S1 Ground Range Detected (GRD) images were
Multi-Temporal Inundated Areas Monitoring Made Easy: The Case of Kerkini Lake in Greece
49

downloaded from the Copernicus Open Access Hub
for the periods between 24 February 2019 to 26
March 2019 and 30 July 2019 to 29 August 2019.
ESA SNAP was used for preprocessing the Sentinel-
1 GRD using the command line graph processing
framework, to (i) apply orbit file, (ii) remove
thermal and border noise, (iii) calibration, (iv)
speckle filtering using Lee Signa filter with a
window-size of 5x5, (v) Range-Doppler Terrain
Correction. The unitless backscatter coefficient is
converted then to dB using a logarithmic
transformation (Filipponi, 2019).
2.3 Validation Data
Acquisition dates (22 dates) coinciding with
recurring water level measurements (2017-2019),
provided by the Lake Kerkini Management
Authority, are considered in the unsupervised
inundation mapping by automatic local thresholding.
Validation maps were delineated taking into
consideration actual water level measurements (10-
minute interval), bathymetry map with 10-m pixel
resolution (Tsolakidis & Vafiadis, 2019), water class
derived from the Copernicus SCL and expert local
knowledge about the maximum expected annual
fluctuation across decades. Specifically, in situ water
level gauge measurements were combined with the
bathymetry map (i.e. all pixels under the gauge level
in the bathymetry map without barriers in-between
are considered inundated). Then the expert
knowledge across decades for the maximum flood
elevation level ever reached was superimposed. In
addition, information from the water class of the
SCL was considered at positions, where
sedimentation of the delta might have influenced
information derived from existing but older
bathymetry map.
2.4 Methodology
2.4.1 Local Automatic Thresholding of
Sentinel-2
The work presented by Kordelas et al. (2018, 2019)
introduced unsupervised approach in discriminating
between inundated and non-inundated areas, through
detecting automatic thresholds. The pre-processed
S2 L2A image is segmented into non-overlapping
regions to select segments with high percentage of
inundated pixels. Then an expanding patch based
approach, taking into consideration medians of
percentages of inundated/ non inundated areas, is
followed based on the centroids of the segments.
The open water subclass is examined by estimating
the initial threshold with the ability to separate
inundated pixels from non-inundated ones through
the use of: (i) SWIR-1 Band (Alt1), (ii) product of
SWIR-2 and NIR (Alt2) and (iii) product of SWIR-1
and NIR (Alt3). The initial threshold is calculated as
the first deep valley the histogram can detect. The
final threshold is calculated based on (i) the
minimum cross entropy thresholding algorithm
(MCET), (ii) Otsu’s algorithm or (iii) the average
between them, resulting in nine different alternatives
from all possible combinations of data and
thresholding method taken into consideration. The
performance of each of the alternatives is assessed
by its ability to accurately distinguish between
inundated and non-inundated pixels, against the
validation data, using the overall accuracy of the
validation dates and the overall Kappa coefficients
(Congalton & Green, 2009; Whitten et al., 2011).
2.4.2 Pixel-centric Classification of
Sentinel-1
Under the unavailability of data or unfavourable
weather conditions S2m cannot be generated, hence,
producing a gap in the monitoring capacity. To
counterbalance this, Manakos et al. (2019) proposed
the use of multiple local random forest classifiers’
estimation per pixel, based on S1 images timely
close or coinciding with S2m dates. The training set
is created for 3x3 pixel samples, with the features
being the pixel’s backscatter coefficients for bands
VH and VV, algebraic combinations of the same
bands, and the season of the year, while the
reference class for each pixel is derived from the
closest S2m. Pixel-centric classification is
performed on the S1 target date data using the
trained classifiers, based on the location in the
image, to delineate the required inundation map
(S1m). The method used in this work is abbreviated
as TIM (after Manakos et al. (2019)), where two
S2m, one preceding and one following the
acquisition date of the target S1 image are used.
Furthermore, the TIM method was modified in order
to produce results using only one S2m, either
proceeding or following. The accuracy of the
classification of the target S1 image was evaluated
against the best fit alternative result used to produce
the timely coinciding S2m; not previously used in
the training process.
GISTAM 2021 - 7th International Conference on Geographical Information Systems Theory, Applications and Management
50
3 RESULTS AND DISCUSSION
3.1 Inundation Maps Derived by
Sentinel-2 Images
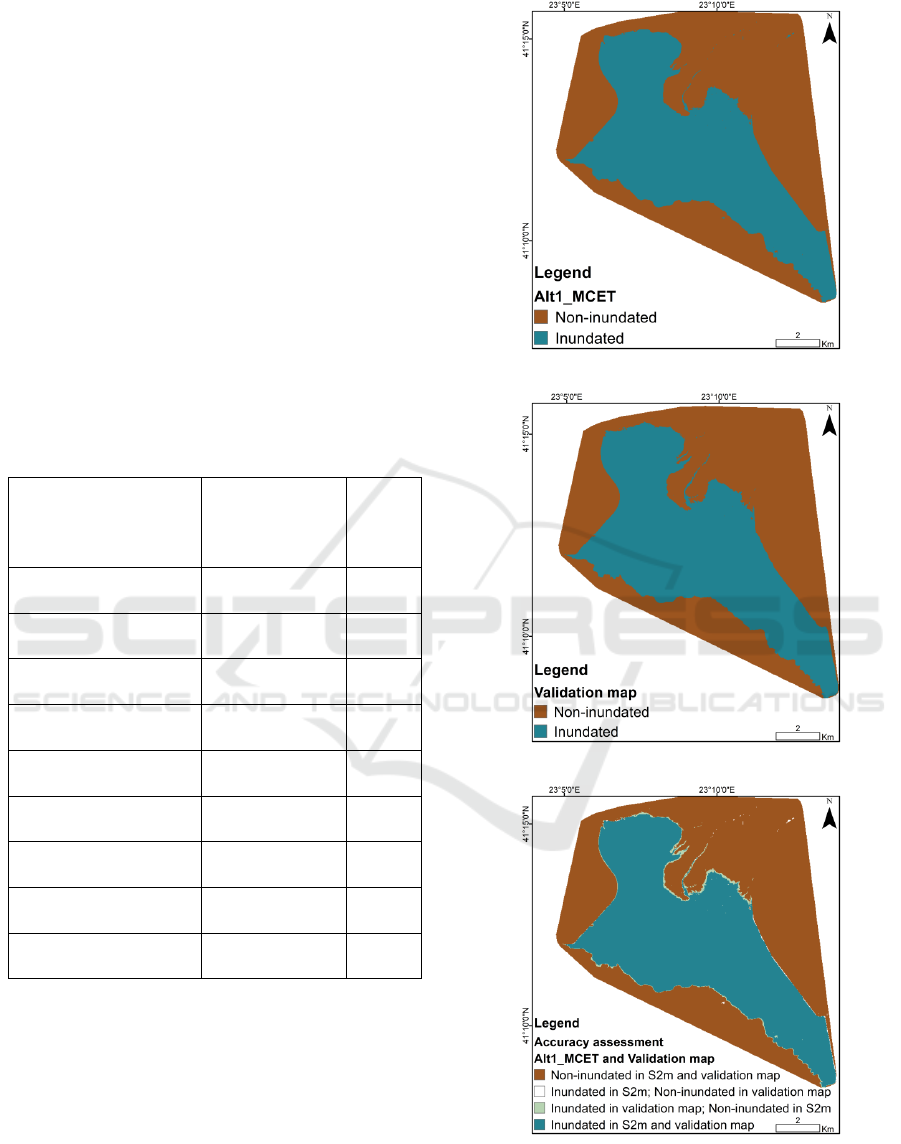
Accuracy assessment took into consideration all
pixels present in the area with excellent results as
indicated in Figure 1. In Table 1 is shown that the
overall k ranged from 0.77 to 0.94, ‘substantial’ but
mostly ‘almost perfect’ agreement according to
Landis and Koch (1977) and overall accuracy ranged
from 88.05 to 97.16%. Using Alt1, Band 11 (SWIR-
1) as an initial threshold and applying MCET
algorithm to find the final threshold, achieved the
best classification performance.
Table 1: Overall accuracy assessment shows the use of the
nine alternatives of local automatic thresholding in
distinguishing between inundated and non-inundated
pixels, averaged over all 22 images/ dates.
Alternatives Overall
Accuracy (%)
Overall
kappa
Alt1 and MCET 97.16 0.94
Alt1 and Otsu’s 96.82 0.93
Alt1 and average 97.08 0.94
Alt2 and MCET 91.32 0.83
Alt2 and Otsu’s 89.77 0.79
Alt2 and average 91.03 0.82
Alt3 and MCET 89.06 0.79
Alt3 and Otsu’s 88.05 0.77
Alt3 and average 90.22 0.81
3.2 Inundation Maps Derived
Synergistically by Sentinel-2 and
Sentinel-1 Images
For the two target dates examined with the TIM
method, the S1m produced an overall accuracy over
99.71% in all cases, when compared with the S2m
reference. The overall kappa values were all over
0.99 (Table 2).
(a)
(b)
(c)
Figure 1: (a) Inundation map (example of 17 August 2019)
derived Sentinel-2 image. (b) Validation layer. (c)
Accuracy assessment (a) against (b).
Multi-Temporal Inundated Areas Monitoring Made Easy: The Case of Kerkini Lake in Greece
51
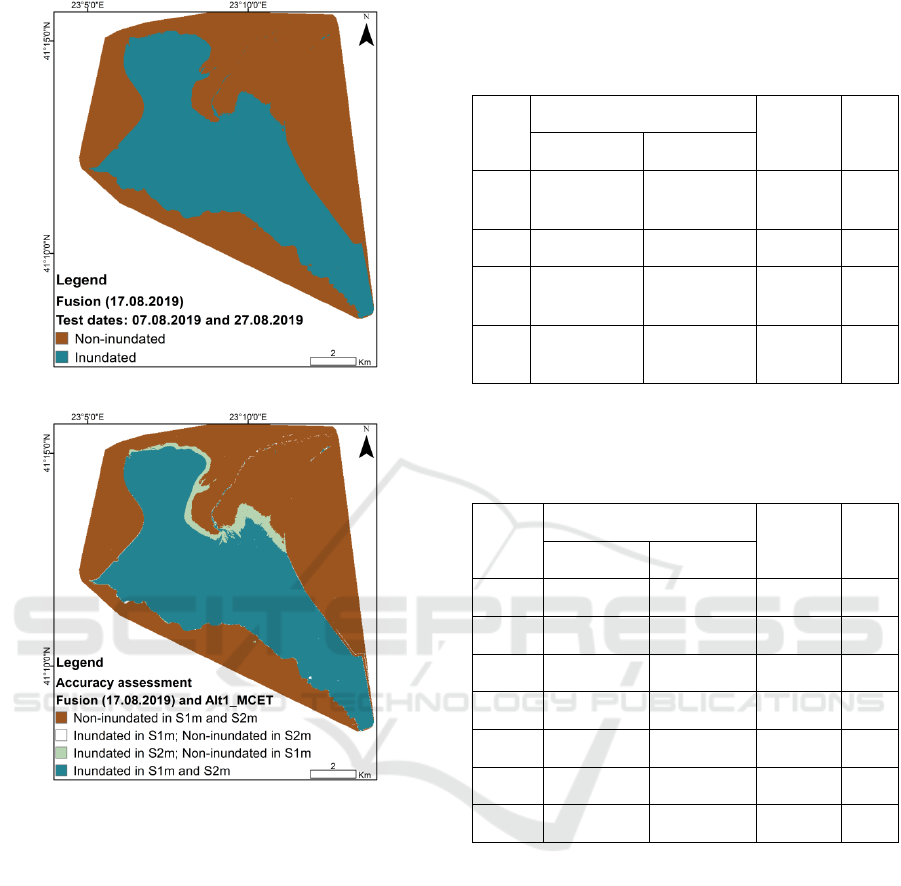
(a)
(b)
Figure 2: (a) Inundation map (example: 17 August 2019)
based on pixel centric classification using TIM (07 August
2019 and 27 August 2019). (b) Accuracy assessment on
the inundation map S1m (17 August 2019) validated
against the timely coinciding S2-derived inundation map
(S2m) produced by best fit alternative. Training dates
used: 07 August 2019 and 27 August 2019.
For the same target dates and by using the
modified TIM method with reduced number of
training S1 images (Table 3), 1 S2m was used to
train the target S1 dates, and achieved lower
accuracies than in Table 2, with overall accuracy of
83.11 to 99.78%, when compared to the reference
S2m. The overall kappa values ranged from 0.62 to
0.98. It becomes clear that the method may be
successfully applied with less S1 images and in
various time intervals away from the target date;
however, results are not as credible.
Table 2: Accuracy assessment of pixel-centric
classification method done using TIM method applied to
S1 images acquired on 08 March 2019 and 17 August
2019.
Target
S1
Training dates Accuracy
(%)
kappa
S2 images S1 images
08.03 28.02; 20.03 24.02; 02.03
20.03; 26.03
99.78 0.99
17.08 12.08; 22.08 11.08; 23.08 99.88 0.99
17.08 07.08; 27.08 05.08; 11.08
23.08; 29.08
99.77 0.99
17.08 02.08; 27.08 30.07; 05.08
23.08; 29.08
99.71 0.99
Table 3: Accuracy assessment of pixel-centric
classification method done using the modified TIM
method with reduced number of training S1 images
acquired on 08 March 2019 and 17 August 2019.
Target
S1
Training dates Accuracy
(%)
kappa
S2 images S1 images
08.03 28.02 24.02; 02.03 99.78 0.98
08.03 25.03 20.03; 26.03 98.55 0.96
17.08 02.08 30.07; 05.08 83.11 0.62
17.08 07.08 05.08; 11.08 98.03 0.95
17.08 12.08 11.08 98.58 0.96
17.08 22.08 23.08 98.94 0.97
17.08 27.08 23.08; 29.08 98.26 0.95
3.3 Applicability of the Methods
The aim of this work was to assess the performance
of unsupervised methods applied to Camargue and
Doñana Biosphere Reverses, and its applicability for
Kerkini Lake, an inland reservoir whose intense use
across the years has suffered from a changing water
extent due to the human pressures, and uncontrolled
frequent extreme flooding events.
In relation with the use of the multispectral
information, Kordelas et al. (2018, 2019) applied
threshold techniques, which have been usually
employed for radar images to quantify flood water
extent (Grimaldi et al., 2016), on multispectral
images and led to high mapping accuracy of the
water extent in Kerkini Lake, as well. Minimum
cross entropy thresholding (MCET) for the
GISTAM 2021 - 7th International Conference on Geographical Information Systems Theory, Applications and Management
52

estimation of the final threshold had consistent
results with Camargue and Doñana marine coastal
areas. The results from this work prove the efficacy
of the methods in an inland water body and wetland.
The alternative approaches Alt2 (MCET) and Alt3
(MCET) demonstrated also similarly good results as
for Camargue and Doñana complete areas (Kordelas
et al., 2019).
In relation with cases when unfavourable
atmospheric conditions prevail, the sole use of radar
images proves to fail achieving high accuracy due to
backscatter confusion among landscape features,
such as water with emergent vegetation, shadow
effects, sandy areas, which may be classified either
as belonging to the water or land class. The use of
the pixel-centric classification has the ability to
capture the pixel-related fluctuation of the
backscatter across a time period, which in one case
might mean inundation and in a neighbouring one no
inundation. As a result the application of the pixel-
centric classification with the use of one or two
Sentinel-2 inundation maps up to a 30-day time
interval from the targeted Sentinel-1 image, has
achieved accurate results. The utilization of two
Sentinel-2 inundation maps provided the best results
in this study and is consistent with the results from
its application at the Doñana Biosphere Reserve
(Manakos et al., 2019).
The validation of the automation techniques
provides consistent results for managing water use.
In the case of Lake Kerkini the hydroperiods
generated using the S2m and S1m throughout the
years, revealed the intense reservoir use for flood
control due to frequent extreme events, which assists
in retaining a lower level of the lake. Seasonal
patterns could be identified for various subareas
within the delta and beyond.
4 CONCLUSIONS
This research contributes to the studies conducted by
Kordelas et al. (2018, 2019) and Manakos et al.
(2019) on the evaluation of the credibility and
applicability of the developed methods for
inundation mapping to other protected areas than
coastal marine ones. It became evident that methods
apply also at Lake Kerkini, a protected area and an
artificially generated inland water body for flood
mitigation in the plain of Serres, by achieving high
accuracy.
High inundation mapping accuracy is achieved
without the need for simultaneous ground truth data
or user’s intervention. Employing machine learning
through fusion of S-1 and S-2 data, allows the
consistent delivery of products, overcoming the
limitation of weather conditions and optical data.
Further steps may utilize DEM or additional post-
processing techniques to correct for hillshade or
aspects. Additional index optimization could be
applicable for areas with different types of
vegetation. Automation of the process and minimum
human interference further supports the
implementation of the verified workflow as an
effective service (even transformed to an online one)
for Protected Areas management.
ACKNOWLEDGEMENTS
This study has been partially funded and supported
by the European Union's Horizon 2020 innovation
program under Grant Agreement No. 820852, e-
shape (https://e-shape.eu/).
REFERENCES
Acharya, T. D., Subedi, A., & Lee, D. H. (2019).
Evaluation of Machine Learning Algorithms for
Surface Water Extraction in a Landsat 8 Scene of
Nepal. Sensors, 19(12), 2769.
https://doi.org/10.3390/s19122769
Cohen, S., Raney, A., Munasinghe, D., Loftis, D.,
Molthan, A., Bell, J., Rogers, L., Galantowicz, J.,
Brakenridge, G. R., Kettner, A. J., Huang, Y.-F., &
Tsang, Y.-P. (2019). The Floodwater Depth
Estimation Tool (FwDET v2.0) for Improved Remote
Sensing Analysis of Coastal Flooding. Natural
Hazards and Earth System Sciences Discussions,
2017, 1–15. https://doi.org/10.5194/nhess-2019-78
Congalton, R. G., & Green, K. (2009). Assessing the
Accuracy of Remotely Sensed Data: Principles and
Practices. In Psychology Applied to Work: An
Introduction to Industrial and Organizational
Psychology, Tenth Edition Paul (Second, Vol. 53,
Issue 9). CRC Press Taylor & Francis group.
Du, Y., Zhang, Y., Ling, F., Wang, Q., Li, W., & Li, X.
(2016). Water Bodies’ Mapping from Sentinel-2
Imagery with Modified Normalized Difference Water
Index at 10-m Spatial Resolution Produced by
Sharpening the SWIR Band. Remote Sensing, 8(4),
354. https://doi.org/10.3390/rs8040354
Feng, Q., Gong, J., Liu, J., & Li, Y. (2015). Flood
Mapping Based on Multiple Endmember Spectral
Mixture Analysis and Random Forest Classifier—The
Case of Yuyao, China. Remote Sensing, 7(9), 12539–
12562. https://doi.org/10.3390/rs70912539
Feyisa, G. L., Meilby, H., Fensholt, R., & Proud, S. R.
(2014). Automated Water Extraction Index: A new
technique for surface water mapping using Landsat
Multi-Temporal Inundated Areas Monitoring Made Easy: The Case of Kerkini Lake in Greece
53

imagery. Remote Sensing of Environment, 140, 23–35.
https://doi.org/10.1016/j.rse.2013.08.029
Filipponi, F. (2019). Sentinel-1 GRD Preprocessing
Workflow. Proceedings, 18(11), 1–4.
https://doi.org/10.3390/ECRS-3-06201
Finlayson, C. M., & D’Cruz, R. (2010). Inland Water
Systems. In Ecosystems and Human Well-being:
Current State and Trends (Vol. 1, Issue January, pp.
551–583). http://www.millenniumassessment.org/en/
Condition.html
Gerakes, P. A. (Ed.). (1989). Conservation and
Management of Greek Wetlands. In Proceedings of a
Workshop on Greek Wetlands (p. 493). IUCN, 1992.
Grimaldi, S., Li, Y., Pauwels, V. R. N., & Walker, J. P.
(2016). Remote Sensing-Derived Water Extent and
Level to Constrain Hydraulic Flood Forecasting
Models: Opportunities and Challenges. Surveys in
Geophysics, 37(5), 977–1034. https://doi.org/10.1007/
s10712-016-9378-y
Guo, M., Li, J., Sheng, C., Xu, J., & Wu, L. (2017). A
Review of Wetland Remote Sensing. Sensors, 17(4),
777. https://doi.org/10.3390/s17040777
Ko, B., Kim, H., & Nam, J. (2015). Classification of
Potential Water Bodies Using Landsat 8 OLI and a
Combination of Two Boosted Random Forest
Classifiers. Sensors, 15(6), 13763–13777.
https://doi.org/10.3390/s150613763
Kordelas, G., Manakos, I., Aragonés, D., Díaz-Delgado,
R., & Bustamante, J. (2018). Fast and Automatic Data-
Driven Thresholding for Inundation Mapping with
Sentinel-2 Data. Remote Sensing, 10(6), 910.
https://doi.org/10.3390/rs10060910
Kordelas, G., Manakos, I., Lefebvre, G., & Poulin, B.
(2019). Automatic Inundation Mapping Using
Sentinel-2 Data Applicable to Both Camargue and
Doñana Biosphere Reserves. Remote Sensing, 11(19),
20. https://doi.org/10.3390/rs11192251
Landis, J., & Koch, G. (1977). The Measurement of
Observer Agreement for Categorical Data. Biometrics,
33(1), 159-174. https://doi.org/10.2307/2529310
Main-Knorn, M., Pflug, B., Louis, J., Debaecker, V.,
Müller-Wilm, U., & Gascon, F. (2017). Sen2Cor for
Sentinel-2. In L. Bruzzone, F. Bovolo, & J. A.
Benediktsson (Eds.), Image and Signal Processing for
Remote Sensing XXIII (p. 3). SPIE.
https://doi.org/10.1117/12.2278218
Manakos, I., Kordelas, G. A., & Marini, K. (2019). Fusion
of Sentinel-1 data with Sentinel-2 products to
overcome non-favourable atmospheric conditions for
the delineation of inundation maps. European Journal
of Remote Sensing, 1–14. https://doi.org/10.1080/22
797254.2019.1596757
Marti-Cardona, B., Dolz-Ripolles, J., & Lopez-Martinez,
C. (2013). Wetland inundation monitoring by the
synergistic use of ENVISAT/ASAR imagery and
ancilliary spatial data. Remote Sensing of
Environment, 139(June 2018), 171–184.
https://doi.org/10.1016/j.rse.2013.07.028
McFeeters, S. K. (1996). The use of the Normalized
Difference Water Index (NDWI) in the delineation of
open water features. International Journal of Remote
Sensing, 17(7), 1425–1432. https://doi.org/10.1080/
01431169608948714
Millennium Ecosystem Assessment. (2005). Ecosystems
and Human Well-being: Synthesis. Island Press.
Nandi, I., Srivastava, P. K., & Shah, K. (2017). Floodplain
Mapping through Support Vector Machine and
Optical/Infrared Images from Landsat 8 OLI/TIRS
Sensors: Case Study from Varanasi. Water Resources
Management, 31(4), 1157–1171. https://doi.org/
10.1007/s11269-017-1568-y
Ovakoglou, G., Alexandridis, T. K., Crisman, T. L.,
Skoulikaris, C., & Vergos, G. S. (2016). Use of
MODIS satellite images for detailed lake
morphometry: Application to basins with large water
level fluctuations. International Journal of Applied
Earth Observation and Geoinformation, 51, 37–46.
https://doi.org/10.1016/j.jag.2016.04.007
Psilovikos, A., & Margoni, S. (2010). An empirical model
of sediment deposition processes in Lake Kerkini,
Central Macedonia Greece. Environmental Monitoring
and Assessment, 164(1–4), 573–592.
https://doi.org/10.1007/s10661-009-0914-9
Rokni, K., Ahmad, A., Selamat, A., & Hazini, S. (2014).
Water Feature Extraction and Change Detection Using
Multitemporal Landsat Imagery. Remote Sensing, 6(5),
4173–4189. https://doi.org/10.3390/rs6054173
Sarp, G., & Ozcelik, M. (2017). Water body extraction
and change detection using time series: A case study
of Lake Burdur, Turkey. Journal of Taibah University
for Science, 11(3), 381–391. https://doi.org/10.1016/
j.jtusci.2016.04.005
Skakun, S. (2010). A neural network approach to flood
mapping using satellite imagery. Computing and
Informatics, 29, 1013–1024.
Thenkabail, P. S. (2015). Remotely Sensed Data
Characterization, Classification, and Accuracies. In
Remotely Sensed Data Characterization,
Classification, and Accuracies (Vol. 1). CRC Press.
https://doi.org/10.1201/b19294
Tsolakidis, I., & Vafiadis, M. (2019). Comparison of
Hydrographic Survey and Satellite Bathymetry in
Monitoring Kerkini Reservoir Storage. Environmental
Processes, 6(4), 1031–1049. https://doi.org/10.1007/
s40710-019-00394-7
Whitten, I. H., Frank, E., & Hall, M. A. (2011). Data
Mining: Practical Machine Learning Tools and
Techniques (Third). Elsevier. https://doi.org/10.1016/
C2009-0-19715-5
Xu, H. (2006). Modification of normalised difference
water index (NDWI) to enhance open water features in
remotely sensed imagery. International Journal of
Remote Sensing, 27(14), 3025–3033.
https://doi.org/10.1080/01431160600589179
Yousefi, P., Jalab, H. A., W. Ibrahim, R., Mohd Noor, N.
F., Ayub, M. N., & Gani, A. (2018). Water-Body
Segmentation in Satellite Imagery Applying Modified
Kernel K-Means. Malaysian Journal of Computer
Science, 31(2), 143–154. https://doi.org/10.22452/
mjcs.vol31no2.4
GISTAM 2021 - 7th International Conference on Geographical Information Systems Theory, Applications and Management
54

Zhang, F., Li, J., Zhang, B., Shen, Q., Ye, H., Wang, S., &
Lu, Z. (2018). A simple automated dynamic threshold
extraction method for the classification of large water
bodies from landsat-8 OLI water index images.
International Journal of Remote Sensing, 39(11),
3429–3451. https://doi.org/10.1080/01431161.2018.14
44292
Multi-Temporal Inundated Areas Monitoring Made Easy: The Case of Kerkini Lake in Greece
55
