
Designing and Implementing a Dashboard with Key Performance
Indicators for a Higher Education Institution
, Ana Azevedo
1a
, José Azevedo
1b
and Michelle Eiko Hayakawa
2
1
CEOS.PP, ISCAP, P.PORTO, Rua Jaime Lopes de Amorim, Matosinhos, Portugal
2
Departamento de Gestão e Apoio Técnico, IFTM, Cuiabá, Brazil
Keywords: Business Intelligence, BI, Performance Indicators KPIs, BI Software Tools, Business Analytics, Data
Warehouse, DW.
Abstract: In a context where public and private institutions continuously seek excellence in management and
improvement in service delivery, governance is one of the contemporary practices that has been adopted not
only as a model for evaluation and monitoring, but also for transparency. To this end, the institutionalization
of a governance model represents not only a challenge for public managers, but also the opportunity to make
use of information technology, especially Business Intelligence, as a way to ensure agility in accessing and
processing information. Through this work, we propose the construction of a prototype of a dashboard for the
BI system to be adopted as a practice of governance by results in a Brazilian public institution, focusing on
education, not only to support the decision making of managers, but also to allow efficiency and public
transparency, and to minimize the difficulties in access, in the management of various BI systems and the
informational asymmetries existing in the Public Administration.
1 INTRODUCTION
Access to information and the ability to put
knowledge to productive use have always been the
hallmark of successful people, companies and even
nations (Fraga, Erpen, & Varvakis, 2017). The
dynamics and competitiveness of the modern world
require that organizations, public or private, make
decisions quickly and based on knowledge obtained
from Business Intelligence (BI) systems. BI
represents an important tool in conducting business
effectiveness and innovation, because it allows
transforming the large volume of operational data into
complex and competitive information, capable of
assisting in decision making with the use of analytical
and interactive tools. In this context, BI is also an
important tool for the practice of Corporate
Governance (GC), because it allows the strategic
alignment of the organization, the measurement of
results and transparency of information, due to the
continuous use of indicators, built based on a set of
information. It is this set of information that allows
the manager to make a safe decision and minimize the
a
https://orcid.org/0000-0003-0882-3426
b
https://orcid.org/0000-0001-6951-4278
risks of failure in a project or in a strategic action.
From this point of view, it was found that the Federal
Institute of Education, Science and Technology of
Mato Grosso (IFMT) has great difficulty in accessing
data and building management indicators, and that
there is still a need to implement tools that help
managers in decision-making, promoting governance
and transparency of information.
The objective of this work is to propose and carry
out a proof of concept of a BI system for governance
by results, through performance indicators within the
IFMT, aiming to support the decision making
process.
The motivation for this research is due to the fact
that during the professional exercise at the IFTM, one
of the authors experienced moments of difficulty in
the rapid access to information for decision making,
due to the absence of a model focused on the
governance of results and performance indicators. In
this sense, besides the personal and professional
interest in the subject, it is observed that the relevance
of the research is related to the use of performance
indicators and governance. These are contemporary
Azevedo, A., Azevedo, J. and Hayakawa, M.
Designing and Implementing a Dashboard with Key Performance Indicators for a Higher Education Institution.
DOI: 10.5220/0010539501650172
In Proceedings of the 13th International Conference on Computer Supported Education (CSEDU 2021) - Volume 1, pages 165-172
ISBN: 978-989-758-502-9
Copyright
c
2021 by SCITEPRESS – Science and Technology Publications, Lda. All rights reserved
165

themes that are beginning to be demanded by Public
Institutions, in addition to society itself.
The rest of the paper is organized in the following
way: Related topics will be approached, namely
Business Intelligence (BI), the components of a BI
system, and interfaces and ways of representing KPIs.
Following are the design, development, description,
and evaluation of the dashboard. The article ends with
a conclusion.
2 RELATED TOPICS
In this section, the main concepts related to this work
are introduced
2.1 Business Intelligence
Business Intelligence (BI) can be presented as an
architecture, a tool, a technology, or a system that
holds and stores data, analyses it using analytical
tools, and provides information and/or knowledge,
facilitating the production of reports, queries, and
fundamentally, allowing organizations to improve
their decision-making. In short, Business Intelligence
can be defined as a process that transforms data into
information and then into knowledge (Azevedo &
Santos, 2009). Turban & Volonino (2013)
conceptualize BI as a combination of software
architecture, databases, analytical tools, graphical
displays and decision-making methodologies, whose
objective is "to enable interactive access (sometimes
in real time) to data, to enable manipulation of data,
and to give business managers and analysts the ability
to conduct appropriate analyses." (Sharda, Delen &
Turban, 2018, p. 16) or improve the organization's
performance (Piedade, 2012). For this author, at the
strategic level, BI systems provide information on
several performance indicators that allow to verify
whether the strategic objectives of the organization
have or have not been achieved, supporting the
planning or redefinition of new methods of operation
and business. At the tactical level, BI demonstrates
how business processes are evolving, if there are
problems and what are the new business trends.
Lastly, at the operational level, BI can provide
information related to the activity of the organization,
its business or its customers. In short, for Reginato &
Nascimento (2007, p. 73), the tools of BI can "provide
a systemic view of the business and help with uniform
distribution of the data between users. Its main
objective is to transform large quantities of data into
quality information for decision making".
2.2 Components of a BI System
The four main components of a BI system, according
to Sharda, Delen, & Turban (2018), are the Data
Warehouse (DW), Business Analytics (BA),
Business Performance Management (BPM) and a
user interface for viewing the information (Figure 1).
DW is the place where all the data extracted from
the information systems are stored, which are
organized and oriented from the main subjects of the
organization, vary over time in the availability of
historical and current data, are integrated and have the
characteristic of being non-volatile; that is, it is not
allowed to change or delete the data after inclusion in
the DW (Loshin, 2012; Reginato & Nascimento,
2007; Sharda, Delen, and Turban, 2018).
It is important to highlight that before the data are
deposited in the DW, it is necessary to go through the
ETL (Extract, Transform and Load) process, that is,
it is the process that collects the relevant data from
transactional databases, spreadsheets, and text files,
transforms them into a pattern (through cleaning,
treatment and classification processes) and loads
them into the DW (Turban & Volonino, 2013).
Business Analyics are tools that help transform
data into knowledge, which can help stakeholders
make business decisions, promote revenue growth,
risk reduction, cost management and others (Sharda,
Delen, and Turban, 2018; Loshin 2012).
BPM uses analysis, reporting and BI queries to
optimize the overall performance of the organization.
This tool can be based on the Balanced Scorecard
(BSC) methodology, allowing for comparison, and
sharing of performance goals and results, so that
managers can quickly understand how the company's
activities are going. These systems use various types
of indicators to measure organizational performance.
The most commonly used indicators are KPIs or key
performance indicators.
Finally, there is the user interface that
corresponds to the way information is visualized,
made available as reports or web interfaces
(dashboards, reports, scorecards, spreadsheets and
other information transmission and visualization
tools, such as corporate portals and virtual reality
presentations (Côrte-Real, 2010; Sharda, Delen, and
Turban, 2018).
2.3 Interfaces and Ways of
Representing KPIs
For Costa (2012, p. 167), as a fundamental
requirement, a BI system must offer interfaces that
make it easier for the manager to interact and
CSEDU 2021 - 13th International Conference on Computer Supported Education
166
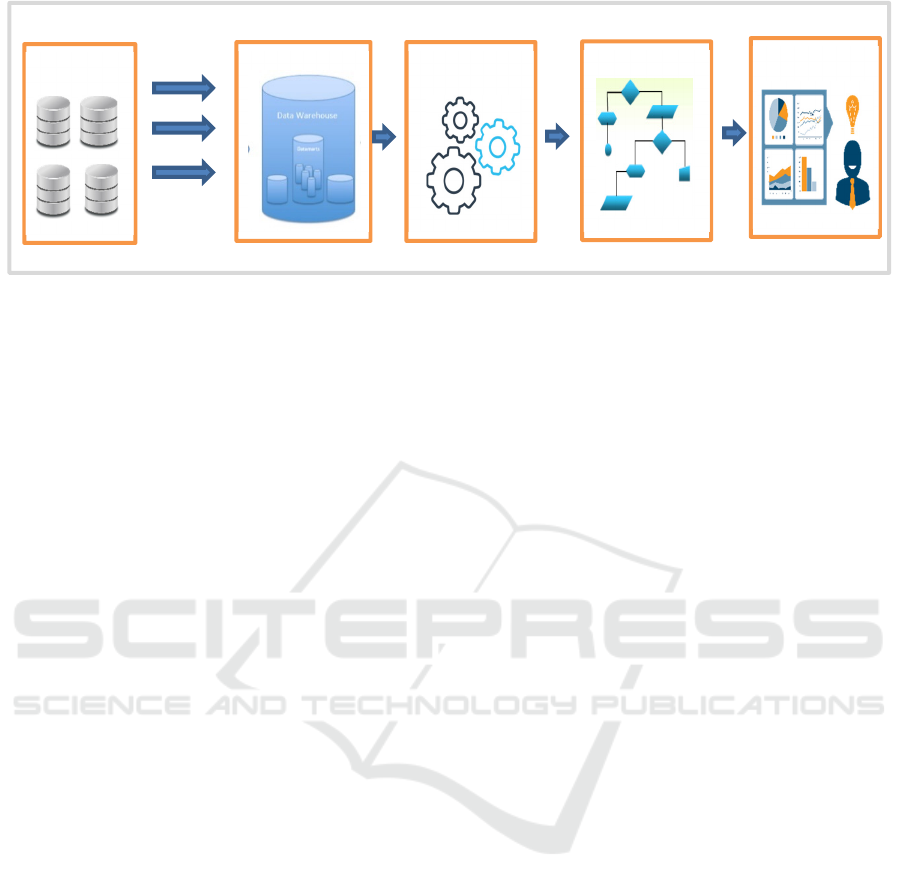
Figure 1: Components of a BI system.
understand data in order, for example, to provide
adequate information for decision-making. This
human-machine interaction (user-friendly interface)
allows the individual to generate reports and analyze
autonomously, thereby improving user satisfaction
and experience. These interfaces can facilitate access
to KPIs, but for the decision-making and success of
governance by results, it is important that business
managers have knowledge about performance
indicators, have a critical vision, and know the
objectives and strategic goals of the organization.
KPIs are usually represented by visual elements,
capable of demonstrating the performance, state or
status of an indicator and can often be related to
productivity, quality, capacity, time, profitability and
others. These types of KPIs are more dynamic,
interactive and easy for the user to understand, as they
allow them to quickly understand whether the
situation is correct or not.
KPIs are released on dashboards or printed
reports. In dashboards, KPIs are presented in a more
interactive and visual manner. Few (2007)
conceptualizes the dashboard as a visual
representation of the most important information to
achieve one or more goals, consolidated and
organized in a single view screen so that the
information can be monitored quickly and with user
participation.
3 DESIGN, DEVELOPMENT,
DESCRIPTION, AND
EVALUATION OF THE
DASHBOARD
This section presents the design, development,
description, and evaluation of the dashboard.
3.1 Design
To carry out this stage it is important to carry out the
planning, selection and definition of the constructive
aspects. For this purpose, a documental report
(included in the appendix) was prepared, containing
the planning, roadmap, and requirements for the
development of the BI system, in which the internal
characteristics of the researched institution, the
expected benefits for the solution of the problem and
the context in which the BI system will operate were
taken into consideration (user type and technology).
Thus, it is possible to design a BI system that
consists of two main elements: a) dashboards
containing the indicators created for the areas of
teaching, research, extension and management; and
b) a web page for hosting the performance indicators
and user access. The details of the development and
evaluation process are presented in the following
sections.
3.2 Development
Among the various types of BI tools available in the
market for the development of the dashboard to
display performance indicators, the starting point was
the classification carried out by Gartner, called
"Magic Quadrant" (Howson, Sallam et al, 2018), to
guide the process of choosing the software used to
develop the dashboard. The experimental phase of
this research included the installation and use of a
demonstration copy of the selected software. All
software has great potential for use and can be used
as BI tools in the institution, but some of these are
easier to use. The analysis of each of the selected
software tools is presented in Table 1.
Business
Analytics
Data Warehouse
User Interface
Data Sources
BPM
ETL
Designing and Implementing a Dashboard with Key Performance Indicators for a Higher Education Institution
167
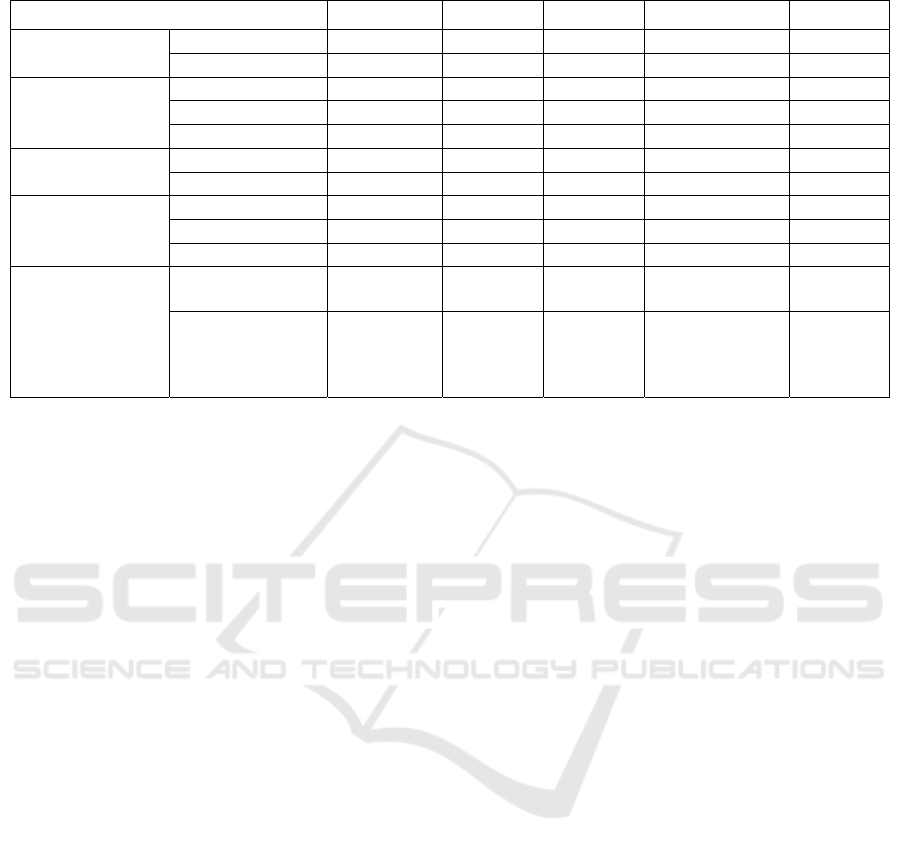
Table 1: Evaluation of software characteristics and requirements.
Characteristics and requirements Power Bi QlikView Tableau Tableau Public Pentaho
Licence
Free * * * X X
Commercial X X X X
Operating system
Windows X X X X X
Linux X X X X
Mac OS X X X X X
Platform Desktop X X X X X
Web X X X X
Usability **
Ease of use Good Excellent Excellent Excellent Difícil
Data manipulation Good Good Excellent Excellent Difícil
Attractive Regular Excellent Excellent Excellent Regular
Product Cost Moderate High Moderate Não possui Do not
have
Market Small,
medium and
large
companies
Small,
medium
and large
companies
Small,
medium
and large
companies
Small, medium
and large
companies
Medium
and large
companies
* These softwares are free for a limited time.
** Scale used: difficult, regular, good, and excellent.
Initially, the main requirement for the
construction of the BI system was the use of an open-
source tool; however, throughout the elaboration of
this research, it was verified that we could opt for one
that was not open source as long as its cost ratio
benefit would justify it. Thus, after evaluating all
these constraints, Tableau Public was chosen.
DW was locally stored and built based on the
selection of data extracted from the Institution's
information systems, documents published on the
institutional website and open data from the Federal
Government. However, for the construction of some
indicators, a database with fictitious content was also
used, because some available information was
incomplete and others depended on specific or
exclusive access authorization; thus, for security
reasons and to avoid the information being not
corrupted, stolen or misused, a database with
fictitious content was chosen. This does not damage
the development of the research, since the intention is
to propose a model that can be used by the institution.
Before loading the data into the DW through the ETL
process, some information from the databases was
processed, transformed, and standardized. To
perform this action, it is possible to use Tableau Prep
or the Tableau Creator that includes, in addition to the
Tableau Desktop the Tableau Prep. With this, it is
possible to perform the cleaning and preparation of
the data and join and combine data between different
tables or databases.
However, in some databases, it was not necessary
to apply the ETL techniques because the data
obtained were fully capable of being applied in the BI
tool for building dashboards. However, depending on
the system or from the database, some data needed to
be transformed or standardized, such as by example
the names of the IFTM's Campi, as for these data
there were identified various forms of nomenclature:
codes, acronyms, full or abbreviated names, etc. The
information obtained in some of the institution’s
databases required the cleaning, association, and
preparation of data, but as the volume was not so
large, this process was performed with the tools made
available in Excel (filters, formulas, and supplements
such as Power Query and Power Pivot), as shown in
the set of images in Figure .
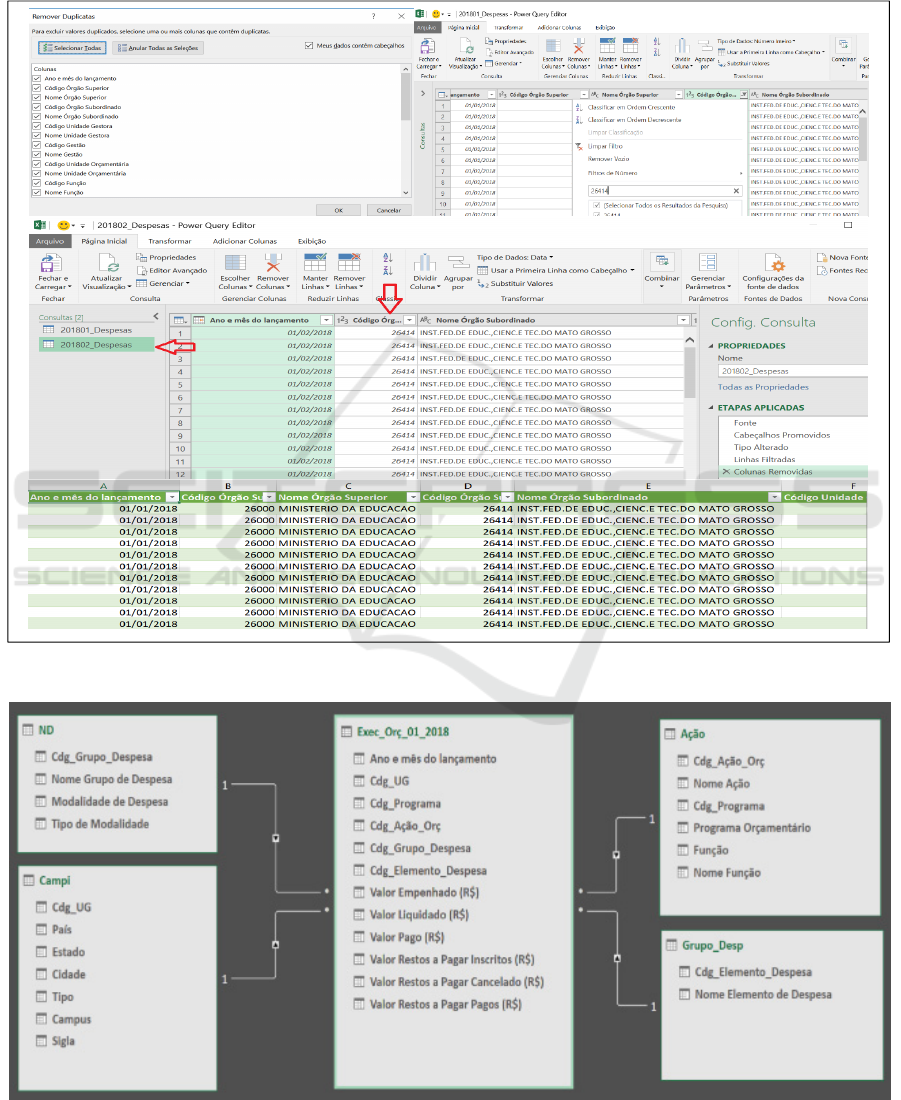
To ensure the security of this process and to
facilitate association and data sizing, the Star Schema
(multidimensional modeling) was adopted for the
design of the DW. Kimbal and Ross (2013) state that
the multidimensional model consists of fact tables
linked to dimension tables by means of primary and
foreign keys. According to Fortulan & Gonçalves
Filho (2005, p. 58), the Fact Table is the main one,
where the occurrences are stored, and the Dimension
Tables provide a description of the data and have only
one primary key. The Star Schema for the execution
of the budget expenditure is presented in Figure . It is
important to highlight that this type of relationship is
automatically performed by Tableau, when the user
performs the selection of the dimensions, as
demonstrated for example in Figure.
After loading the data into Tableau Public, other
dimensional modeling was also performed through
CSEDU 2021 - 13th International Conference on Computer Supported Education
168
groupings, intersections, or associations, as shown in
Figure and Figure. However, it is important to note
that for the dimensional modeling process, Tableau
Public itself carries out the steps in a satisfactory
manner, without the need for additional and parallel
tools. In any case, the actions performed were
important for the enrichment and improvement of
knowledge, as it helped in the work developed by
Tableau.
Figure 2: Star scheme for the execution of the budget expenditure.
Figure 3: Use of MSExcel
TM
tools for data processing.
Designing and Implementing a Dashboard with Key Performance Indicators for a Higher Education Institution
169
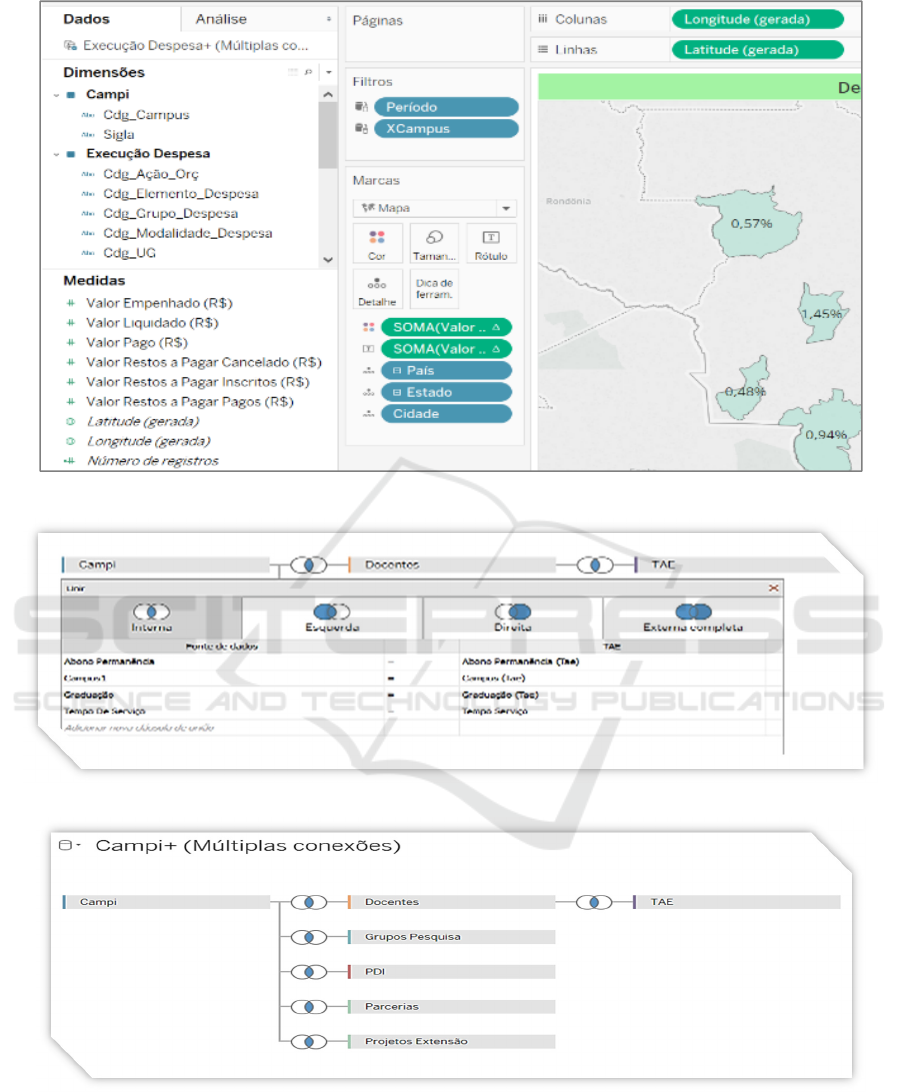
Figure 4: Screen with dimensions and measurements.
Figure 5: Relationship of databases.
Figure 6: Connections and interconnections with the various DM.
After the construction of all dashboards, they
were made available on a web page, which was
conceived with the intention of being aggregated on
the institutional page of the IFMT. However, since
this proposal is academic and not institutional in
nature, this platform for dissemination and
visualization of the performance indicators of the
institution was built and hosted in a different location.
There was no damage to the development of the
proposed project and the test application has potential
CSEDU 2021 - 13th International Conference on Computer Supported Education
170
for future use by the Institution, if so desired, because
the tools and technologies chosen are compatible.
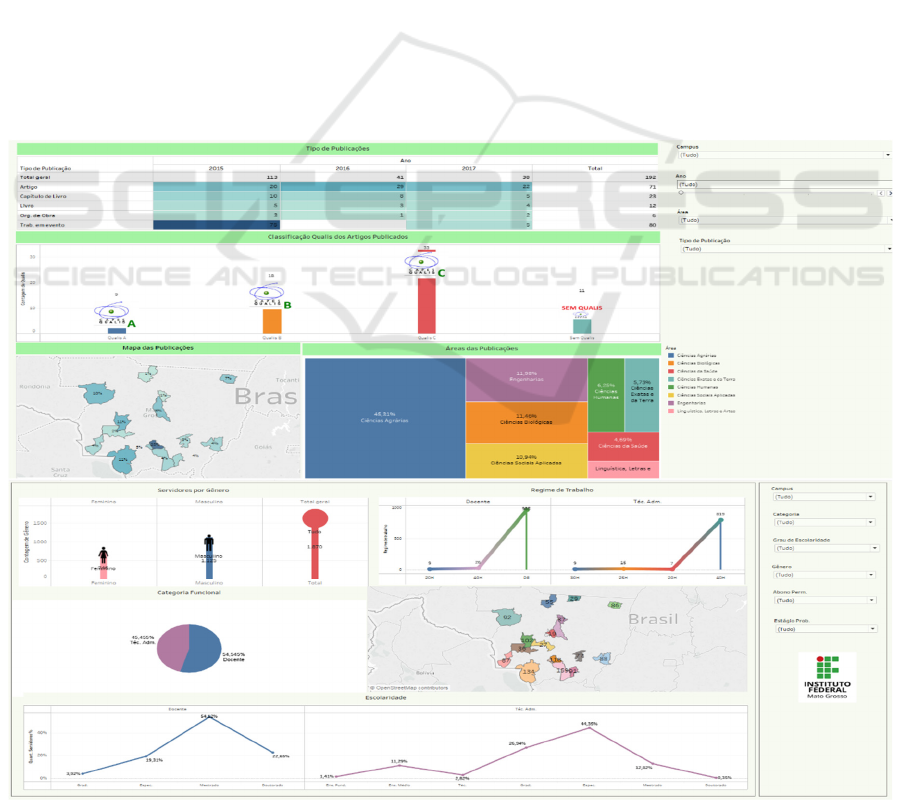
3.3 Short Description
The dashboard of the web platform was divided into
four areas: a) teaching, b) research, c) extension, and
d) management. Figure presents an example of a
dashboard containing the performance indicators for
these four areas. Each graph that makes up the
dashboard is individually built into a Tableau
spreadsheet. These spreadsheets allow the insertion of
metrics, filters, dimensions, details, masks,
measurements, and calculated fields. Each sheet is
then sized and visually organized on the panel, thus
composing the thematic part of each area of the BI
system.
Several types of visual elements were used, such
as geographic maps, word clouds, buses, pizza, lines,
and areas, with the intention of making the navigation
pleasant and varied for the user, which is more
attractive and dynamic. It is important to note that not
all pages of the dashboard presented in this paper for
reasons of confidentiality.
3.4 Evaluation
Once the artifact was built, several tests and
experiments were conducted to verify its
performance. The prototype was made available for
experimentation and evaluation, and to make the
proof of concept. One of the authors, accompanied
the users selected for the experiments, and the
problems pointed out by those users were approached
to update the dashboard. The feedback obtained from
initial users was very positive.
4 CONCLUSION
The use of the BI tool Tableau Public to implement
the proposed indicators proved to be an efficient
solution, as it allows the use of Data Marts composed
of several and varied types of data, as well as flexible,
intuitive, and fast analyses.
The results obtained in the proof of concept
demonstrate that the proposed model has the potential
to assist managers in the decision-making process,
Figure 7: Dashboard with the governance indicators.
Designing and Implementing a Dashboard with Key Performance Indicators for a Higher Education Institution
171

monitoring performance and results, promoting
transparency of actions and stimulating the search for
improvement in service delivery. Similarly, it was
demonstrated that BI systems and tools are important
instruments in the construction of this model because
they ensure reliability, minimize errors, and provide
dynamics and agility in the processing and
presentation of information, in addition to optimizing
time and manpower.
During the research, some difficulties and
limitations were encountered. There were difficulties
in accessing the data in the databases because of the
wide variety and types of data available, as well as the
security procedures and access restrictions. Likewise,
the process of choosing the best software to build the
performance indicators requires a considerable
amount of time and study of each system.
This research has potential for future work,
namely the evolution of the artifact, since it requires
improvements and new implementations, not only to
overcome the limitations currently existing, but also
in the construction of new performance indicators.
ACKNOWLEDGEMENTS
This work is financed by Portuguese national funds
through FCT - Fundação para a Ciência e Tecnologia,
under the project UIDB/05422/2020.
REFERENCES
Azevedo, A. & Santos, M.F. (2009). Business Intelligence:
State of the Art, Trends, and Open Issues. In
Proceedings of the 1st KMIS 2009, 296-300.
https://doi.org/10.5220/0002303602960300
Bueno, R. L. P., Brelàz, G. de, & Salinas, N. S. C. (2016).
Administração pública brasileira no século 21: seis
grandes desafios. Revista do Serviço Público, 67(0), 7–
28. https://doi.org/10.21874/rsp.v67i0.1152
Côrte-Real, N. (2010). Avaliação da maturidade da
business intelligence nas organizações (Dissertação).
Universidade Nova de Lisboa, Lisboa. Recuperado 18
abril, 2018 de https://run.unl.pt/bitstream/10362/7477/
1/TEGI0269.pdf.
Costa, S. A. R. da. (2012). Sistema de business intelligence
como suporte à gestão estratégica (Dissertação).
Universidade do Minho, Minho. Recuperado 18 abril,
2018 de http://repositorium.sdum.uminho.pt/handle/
1822/25810.
Fortulan, M. R., & Gonçalves Filho, E. V. (2005). Uma
proposta de aplicação de business intelligence no chão-
de-fábrica. Gestão & Produção, 12(1), 55–66.
https://doi.org/10.1590/S0104-530X2005000100006.
Fraga, B. D., Erpen, J. G., & Varvakis, G. (2017). Business
Intelligence: métodos e técnicas de gestão do
conhecimento e as tendências para avanços do capital
intelectual. Business Intelligence, 7(1), 15.
Howson, C., Sallam, R.L., Richardson, J.L., Tapadinhas, J.,
Idoine, C.J., & Woodward, A. (2018). Magic Quadrant
for Analytics and Business Intelligence Platforms.
Gartner Report ID: G00326555 https://www.gartner.
com/en/documents/3861464/magic-quadrant-for-
analytics-and-business-intelligence-p
Kimball, R., & Ross, M. (2013). The Data Warehouse
Toolkit: The Definitive Guide to Dimensional
Modeling. John Wiley & Sons.
Loshin, D. (2012). Business Intelligence: The Savvy
Manager’s Guide. Newnes.
Piedade, M. B. (2012). Business Intelligence no suporte ao
conceito e à prática de student relationship
management em instituições de ensino superior
(Doutoramento). Universidade do Minho, Minho.
Recuperado em 13 abril, 2018 de http://repositorium.s
dum.uminho.pt/handle/1822/20461.
Reginato, L., & Nascimento, A. M. (2007). Um estudo de
caso envolvendo Business Intelligence como
instrumento de apoio à controladoria. Revista
Contabilidade & Finanças, 18, 69–83.
https://doi.org/10.1590/S1519-70772007000300007.
Sharda, R., Delen, D. & Turban. E. (2018). Business
Intelligence, Analytics, and Data Science: a Managerial
Perspective – Fourth Edition. Upper Saddle River, NJ:
Pearson Education, Inc.
Turban, E., & Volonino, L. (2013). Tecnologia da
Informação para Gestão: em busca de um melhor
desempenho estratégico e operacional (8
o
ed). São
Paulo: Bookman Editora.
CSEDU 2021 - 13th International Conference on Computer Supported Education
172
