
Students Expectations on Learning Analytics: Learning Platform
Features Supporting Self-regulated Learning
Tuija Alasalmi
*
School of Vocational Teacher Education, Haaga-Helia University of Applied Sciences, Pajuniityntie 11, Helsinki, Finland
Keywords: Learning Analytics, Self-regulation, Expectations, Online Learning Platform.
Abstract: The article presents results of a survey and interviews mapping students’ expectations and needs on learning
analytics. The discussion focuses on the functionalities and features which were considered to support self-
regulated learning in Moodle learning environment. The aim of the discussion is to identify how the reported
student needs could be met by utilizing descriptive, prescriptive or predictive learning analytics.
It was discovered that students need and expect certain functions in the digital learning environment to support
self-regulated learning. The survey results indicate that students mainly demand for tools which could help
them in planning and scheduling their studies. Secondly, to be able to monitor and regulate their performance,
they need progression tracking tools as well as timely and constructive feedback. Features of descriptive
analytics were considered the most useful for self-regulation, while the expected benefits of prescriptive and
predictive analytics were more controversial and tentative.
1 INTRODUCTION
Learning analytics is a relatively young field of
research, and its use in the field of education is still in
its infancy. Learning analytics is a sub-genre of data
analytics and does not have a definition set in stone.
Learning analytics is broadly defined as the collection,
measurement and analysis of data produced by a
learner in a digital learning environment. The data
processing aims at understanding and optimizing
learning and its contexts (Society for Learning
Analytics Research, 2020).
Although the data in digital learning platforms is
provided by the students, their perspective has mainly
been bypassed in the development of learning
analytics tools (Hooli, 2020; Buckinham, Shum,
Ferguson, Martinez-Maldonado, 2019). Therefore,
learning analytics tools often only measure and record
actions which present useful information to the
teacher, but not necessarily to the students (Hooli,
2020). Moreover, even if students could benefit from
the data collected in the online learning environment,
they may not have access to view it. In recent years,
most digital learning platform providers have started
to develop learning analytics tools which are
available to students, ie. they are able to themselves
*
https:/www.haaga-helia.fi
monitor and utilize the data accumulated from their
online studies.
The tools for collecting, analyzing, and interpreting
learning data will not develop unless learning analytics
is researched and advanced in a user-driven way. If the
tools are found to be unnecessary or useless, they will
not be deployed. Silvola, Jylkäs and Muukkonen have
concluded that in order to develop analytics tools that
students want to use, the tools should meet the
information and support needs of students in their daily
lives (Silvola, Jylkäs & Muukkonen, 2020). Therefore,
it is important to map the real need of end-users of
learning environments – both teachers and students –
and to critically assess if the data collected really
benefits them.
This article is based on a survey and interviews
conducted between November 2020 and February
2021 in the MOPPA project (Motivation och
självreglering på inlärningsplatta med hjälp av
inlärningsanalytik). The aim of the survey and
interviews was to map students’ experiences of digital
learning environments, identify everyday support
needs for online learning and find out which
activities, tools and pedagogical elements
contributing to the collection of learning data in
digital learning platforms are considered to increase
students’ self-regulation and motivation.
Alasalmi, T.
Students Expectations on Learning Analytics: Learning Platform Features Supporting Self-regulated Learning.
DOI: 10.5220/0010537101310140
In Proceedings of the 13th International Conference on Computer Supported Education (CSEDU 2021) - Volume 2, pages 131-140
ISBN: 978-989-758-502-9
Copyright
c
2021 by SCITEPRESS – Science and Technology Publications, Lda. All rights reserved
131

On the basis of the survey some key needs were
found in the context of Moodle learning environment
used in Haaga-Helia University of Applied Sciences.
This article specifically discusses the tools, activities
and functionalities which the respondents of the
survey found useful and supportive of their learning
process. The reported solutions (either pedagogical or
technical) which were believed to facilitate learning,
are viewed as either existing or possible data
collection points for descriptive, prescriptive or
predictive learning analytics. Practical suggestions
concerning the development of learning analytics
tools are made on the basis of the findings.
2 DATA ANALYTICS IN DIGITAL
LEARNING ENIVRONMENTS
Learning analytics is commonly divided into three
types: descriptive or diagnostic, prescriptive and
predictive analysis. Gröhn and Nevalainen have made
a comparative analysis of various online learning
platforms with respect to the in-built learning
analytics tools available. They report that the
analytics tools in the platforms included in their
analysis mainly offer descriptive or diagnostic
learning analytics. There are yet only a few tools or
options for using predictive analytics available, and
there’s a lot of variation in the use of prescriptive
analytics (Gröhn & Nevalainen, 2018). Even though
tools and models for predictive analytics such as
identifying likely drop-outs have been developed,
they have not been widely adopted in higher
education (Viberg et el., 2018). Gröhn and
Nevalainen conlude that learning analytics in the
platforms scrutinized in their report shortly means
monitoring the various learning actions, collecting the
course resources and assignments into a
comprehensive view and providing reminders or
notifications on the deadlines and materials to be
studied. To summarize, the data offered to learners
includes their progression on a general level, on a
specific course and with the chosen assignments.
Most analytics tools also offer separate views for
submitted assignments and those yet to be done
(Gröhn & Nevalainen, 2018).
2.1 Previous Studies of Students’
Expectations on Learning Analytics
Schumacher and Ifenthaler have mapped students’
expectations on learning analytics within the
framework of the three phases of self-regulation as
outlined by Barry Zimmerman (2002): the
forethought phase, the performance phase and the
self-reflection phase. In this framework self-
regulation is understood as a set of metacognitive and
cognitive processes initiated and maintained by the
students, to carry out the tasks given in any context of
learning (Zimmerman, 2002). The students’
expectations on learning analytics in the study of
Schumacher and Ifenthaler were recognized as to-do
lists, reminders of deadlines, tools for planning, clear
learning goals, motivational aspects and individual
recommendations (forethought phase); monitoring
competence level and development of skills,
additional or personalized material and assignments,
recognition of offline and social learning
(performance phase); and self-reflective assignments
and feedback (self-reflective phase) (Schumacher &
Ifenthaler, 2018).
Students' expectations towards learning analytics
have been studied in Finland previously in the APOA
project. In the workshops organized for students, the
following ten themes emerged on which learning
analytics is expected to offer support: 1) Defining and
monitoring learning objectives, 2) Monitoring
learning activities, 3) Monitoring and visualizing the
learning process, 4) Interaction, 5) Feedback, 6)
Competence development assessment, 7) Provision
of study material, 8) Influencing the process or the
content of the course, 9) Improving teachers'
technical competence and 10) Time management and
study skills (Hartikainen & Teräs, 2020).
2.2 Moodle
In the Moodle learning environment used in Haaga-
Helia, the analytics tools available to the student are
mostly descriptive. These descriptive tools include
Completion Progress block, which collects and
visualizes information about the completion of
scheduled tasks as well as activities and resources in
any course area. The function is not automatic; the
teacher activates it if desired and makes it available to
students. Tools for collecting and organizing learning
data also include the Gradebook and especially the
personal Dashboard which is a kind of landing page
and summary view that the student can customize and
from which they can see the general situation of all
their courses (including completion percentages of
each course, if progress completion is enabled). The
dashboard includes a link to the site-level calendar
tool which collects deadlines from all the active
courses available to the student. Students can add
various blocks into their dashboard, such as timeline,
upcoming events, progress tracker, and latest
CSEDU 2021 - 13th International Conference on Computer Supported Education
132

announcements. The blocks collect data from all the
course areas in which the student participates.
The range of tools available to the teacher is wider
and there are e.g. log data, reports, and activity-specific
usage statistics that students do not have access to. All
Moodle activities (e.g. forums, test, assignment,
lesson, etc.) collect information about the student's
activity, such as the amount of views. This information
is only visible to the teacher, while the student can only
access the material he or she produces (i.e., assignment
submissions, test attempts, own files, forum posts, and
comments). This information, however, is scattered
and not presented as a single comprehensive course-
level view or dashboard to student.
Possibilities for prescriptive analytics in Haaga-
Helia’s Moodle are limited. The test activity enables
automated feedback and giving instructions to the
student based on the question or test results. There are
also automated reminders used for activating students
to submit their assignments before deadlines.
Teachers may use reports to sort out inactive students
on particular activities and send messages with
further instructions, but all this has to be done
manually. Finally, neither teachers nor students have
any tools available for predictive analytics. The
Moodle Learning Analytics API is installed in Haaga-
Helia’s Moodle, but all the default learning analytics
models are disabled.
3 METHODOLOGY
As one of the purposes of the project was to identify
and explore the connection between student self-
regulation and learning analytics, the framework for
the survey was based on Zimmerman’s model of self-
regulated learning. It was also used by Schumacher
and Ifenthaler in their study of students’ expectations
on learning analytics as reported earlier.
3.1 The Survey
The survey consisted of 25 questions divided into three
question sets. The first seven questions regarded
background info, and the next seven questions mapped
the students’ preferences concerning online learning.
The final set of 14 questions included structured
questions on the students’ perception of their self-
efficacy level and their experiences on certain
pedagogical solutions and functionalities available in
their online courses. There were also open-ended
questions about the perceived barriers to online
learning, the expectations and needs for tools or actions
supporting learning, and two questions on motivational
issues. This article focuses on the responses given in
the open-ended questions; however, the issue of
motivation was omitted from this discussion.
The open-ended questions of the survey were
analysed through qualitative content analysis. The
needs (functionalities or tools) reported by the
respondents were first categorized according to their
main theme, identifying repeating key words and
phrases. Thematic analysis also utilized semantic
analysis. Furthermore, the identified main themes
were recognised as needs towards either descriptive,
prescriptive or predictive analytics.
The survey was sent to selected student groups in
blended learning study programs, but participation
was voluntary and the answers were handled
anonymously. There were 47 responses and most of
the respondents were students of business and
entrepreneurship or IT and digital services. The mean
age of the respondents was 34; the youngest was 21
and the oldest 56. They were mostly adult students
with a previous degree or work experience.
3.2 The Interviews
The survey was followed by voluntary semi-
structured interviews with seven students who had
also participated in the survey. The interviews
included four open-ended question and two semi-
structured question based on the survey results. With
the semi-structured questions, the interviewees were
shown a table that summarized the tools or actions
supporting learning as identified in the survey
responses, divided into the three analytics types. The
summary was made on the basis of the survey
responses, and it included the most often suggested
features and functionalities. However, some options
were added simply because it was presumed that most
students were not fully aware of the possibilities of
learning analytics in learning platforms. Table 1
shows the categories including the titles they were
presented with. The first column represented needs
for descriptive analytics, the second column
represented needs for prescriptive analytics and the
third column consisted of needs for predictive
analytics.
The students were asked to choose which of the
categories included features that best support self-
regulated learning and motivation in general. They
were also asked to highlight any three features which
they personally considered the most useful for them.
The interviews were conducted by the author and
another researcher and they were transcribed. All
seven interviewees chose to have a Zoom or Teams
interview. Oral informed consent to record the
Students Expectations on Learning Analytics: Learning Platform Features Supporting Self-regulated Learning
133
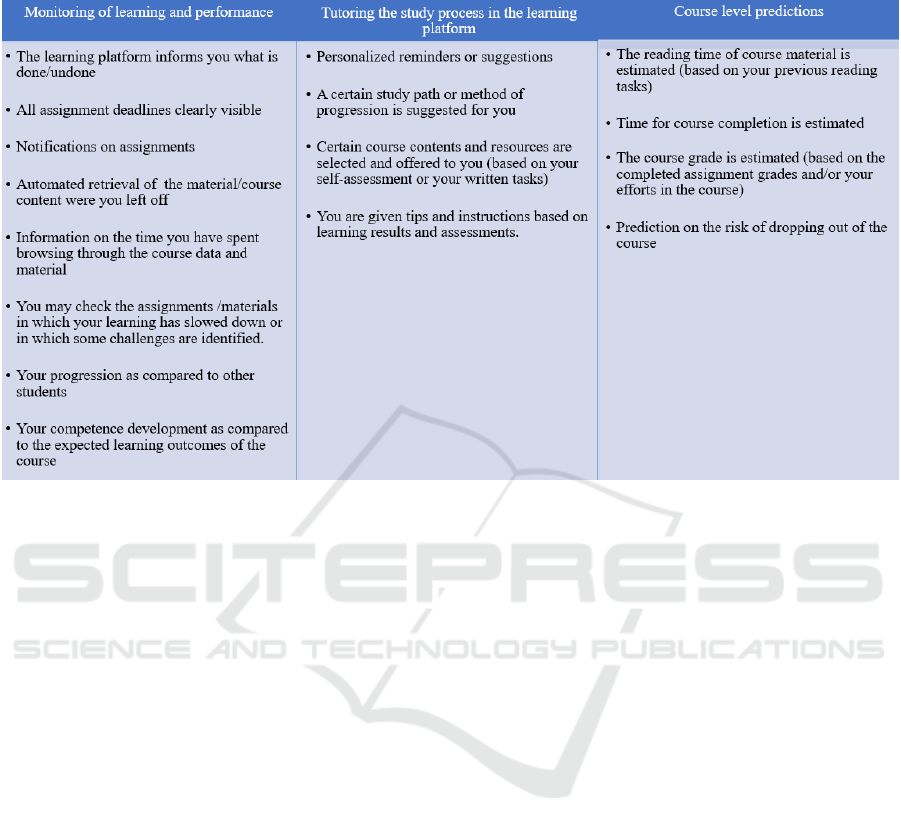
Table 1: The division of actions and features supporting self-regulated learning on the learning platform, categorized under
the types of learning analytics.
session was gained in the beginning of the interview
by all interviewees. The interviews lasted between 15
and 28 minutes. The questions were aimed at
revealing in more detail the reported needs,
experiences and perceptions of the students within the
context of learning analytics. The purpose of the
interviews was not to gain any new information but
rather to find further explanations for the identified
needs and to elaborate on the specific themes that
emerged in the survey. The interviews complemented
the thematic analysis of the survey responses.
4 RESULTS
In an open-ended question of the survey, students
were asked to write about anything they feel could
help them (self-regulate) in their study process in
online learning. Respondents were especially
encouraged to think if they had any needs for a
specific feature or functionality in the learning
platform. Eleven students did not have any
suggestions nor reported specific needs; in addition,
there were some replies focusing on pedagogical
issues. However, two major themes emerged: a
demand for time management and progression
tracking, and the need for feedback.
4.1 Time Management, Progression
Tracking and Study Planning
In 22 responses, a need for scheduling and planning
tools was highlighted, with a strong emphasis on the
follow-up of deadlines:
“A to-do list in one place would be great. I could
add notes myself about submitted assignments and
schedule all undone assignments.”
Another feature or functionality considered
important was a comprehensive dashboard view for
monitoring all the active courses at one glance:
“A comprehensive view of all active courses,
currently I’m building such a view with excel myself.
The view includes all contact sessions (online/
classroom), personal events, deadlines and my own
scheduling of which course assignments I am
working on and when.”
“[A tool] that shows me instantaneously which
courses are ongoing and what happens in them and
how I have progressed and what are for instance the
assignment deadlines, and all of these in one
location.”
The majority of student needs were connected
with progression monitoring. This was needed both
on a single course level and within the framework of
the entire study program:
“It would be nice to see information of my actions
and time usage, and a comprehensive view of my
CSEDU 2021 - 13th International Conference on Computer Supported Education
134

progression in a particular course and within my
studies as a whole. Now this information is scattered
in different locations and in a majority of the courses,
the progression tracking does not work correctly.”
Some students specifically emphasized the
importance of visualizations such as heat maps, visual
timelines and progress bars. One of the respondents
even claimed that learning platforms should be more
like project management systems where students
would be able to manage all learning tasks according
to their own schedule. This sort of Kanban-style view
on learning emerged in the responses quite often and
it was evident that tools for time management are
certainly needed. However, it is interesting that the
responses had a task-oriented edge as they did not
reflect the need for monitoring competence
development, as was found in the student workshops
of the APOA project and in the study by Schumacher
and Ifenthaler. According to Zimmerman, setting
personal goals in the forethought phase of self-
regulated learning, and monitoring one’s
performance in respect to the expected learning
outcomes in the monitoring phase are functions
supporting self-regulation (Zimmerman, 2002).
Nevertheless, this was not highlighted in the students’
needs in this survey. Since the need for keeping track
of deadlines and assignment submissions was
emphasized, it appears that instead of having
problems with achieving the expected learning goals,
the metacognitive difficulties were a bigger issue.
Apparently, some students struggle finding suitable
strategies for online learning and they may have some
problems with self-regulation, but only in terms of
time management. This is where they expect help
form learning analytics.
4.2 Different Types of Feedback
The next important viewpoint after time management
was the question of feedback. 15 students reported
issues especially with communication and feedback,
and it was evident that tools were needed for a more
effective and timely communication concerning the
students’ overall status, course and task level
progression and the level of engagement:
“My work progresses/does not progress would be
a good button to have in all courses, this is how
teachers would know more about the student and they
could give instructions and push students forward in
doing the assignments.”
Such a feature might help teachers in identifying
students who are at greater risk of dropping out or
who may have trouble with their cognitive or
metacognitive processes (i.e. self-regulation). This
sort of need for a process-oriented feedback was,
however, in the minority. The responses emphasized
more of outcome-oriented feedback, which is what
most learning analytics dashboards usually support
(Sedrakyan, Malmberg, Verbert, Järvelä &
Kirschner, 2018). Sedrakyan and colleagues point out
that providing relevant type of feedback in learning
platforms depends on identifying the factors behind
students’ (low) performance; any learning analytics
dashboard should be able to differentiate whether the
student has cognitive problems (difficulties in
understanding the tasks) or behavioural problems
(difficulties in motivation or putting enough effort
into studying) and offer feedback for the purposes of
cognitive development or behavioural changes
(Sedrakyan et al., 2018).
In the survey, most of the respondents hoped for
instant feedback or at least feedback given relatively
promptly after the assignment submission:
“Feedback is needed in every course soon after an
assignment is submitted in order to be able to learn.
In this course feedback was delivered quickly, but this
not always the case.”
“In math course there were assignments which
had instant feedback on whether or not the answer
was correct. I wish there were more of this sort of
gamified assignments.”
Well-timed feedback does not only help students
to self-regulate their learning efforts, but it also helps
students in identifying their competence level and
ultimately it leads to better learning results. For
example, in a study with 500 students carried out by
Liu and Cavanaugh, the teachers’ constructive and
timely feedback comments had significant effect on
the students’ final scores in a math course (Liu &
Cavanaugh, 2012).
It is worth considering a learning analytics
functionality which could sort out students who
would benefit the most from feedback without any
delay, since many of the responses expressed
dissatisfaction with the timing of the feedback.
“The weekly assignments should be checked and
feedback should be received earlier than the end of
the course. Often course material is based on the
previous weeks’ assignments and if I have understood
something wrong or have no competence in the
beginning of the course, there is no way to fix it in the
end.”
Sedrakyan and colleagues have suggested, based
on their research on learning analytics dashboards as
a source of feedback, that the optimal time for
feedback can be determined by detecting any
anomalies or challenges in the learning process
(Sedrakyan et al, 2018). One survey participant
Students Expectations on Learning Analytics: Learning Platform Features Supporting Self-regulated Learning
135

suggested that in connection with the assignment
submissions, there could be an optional button for
asking feedback (especially in tasks were feedback is
usually not given). This could benefit students who
need more guidance while teachers are able to reduce
their work load by not giving feedback to everyone
on all tasks. It has been discussed that as students
differ in their readiness for self-regulatory learning,
support should be offered to the students with weaker
metacognitive skills (Nussbaumer et al., 2015).
Regulating the level and receive time of feedback
according to the learner’s needs is what learning
analytics dashboards could be used for, as Sedrakyan
and colleagues have also proposed earlier (Sedrakyan
et al, 2018).
4.3 Behavioural or Cognitive
Feedback?
Earlier studies have outlined the types of cognitive
feedback into corrective, epistemic and suggestive
feedback (Alvarez, Espasa, Guasch, 2012; Guasch,
Espasa, Alvarez & Kirschner, 2013). Corrective
feedback points out false conclusions, solutions and
decisions; epistemic feedback provides analysis for
critical reflection and suggestive feedback gives
advice to the learner on how to proceed and what to
improve. All feedback types may play a role in
supporting self-regulated learning, but from the point
of view of learning analytics, corrective and
epistemic feedback types are more descriptive and
suggestive feedback contributes to prescriptive
analytics. Automated feedback in learning platforms
can form a basis for prescriptive analytics for the
students – at least if the feedback is accompanied with
suggestions or instructions on what to do next on the
basis of the results.
Many of the survey responses regarded feedback
as more of a verification of the task being completed
successfully, and it can be concluded that feedback is
an integral feature of descriptive learning analytics.
Receiving correct answers is considered important, as
is the descriptive assessment of what went well and
what went wrong, as one student responded. The need
for instant, corrective feedback was evident, but it
remained a bit unclear whether this type of feedback
was considered cognitive or rather more behavioural.
Therefore, feedback was chosen as one of the key
topics in the interviews and the interviewees were
asked to describe their notion of good feedback in
more detail. They were also asked to define if the
source of feedback (teacher, peers or learning
platform (automated or auto-generated feedback))
had any significance to them.
The responses were quite univocal: good feedback
is well timed, constructive (cognitive) and supportive.
The first two characteristics were equally important but
the difference between behavioural and cognitive
feedback clearly emerged. Behavioural feedback
should be instantaneous, as one interviewee described:
“In fact it is not really feedback, it is connected to
what came up previously, that when I registrate on a
course, I don’t actually know if I was accepted or not.
[…] That gives no confirmation or such. […] For
myself, I prefer receiving the feedback in this
situation directly from the system. Like “great job,
this is now completed, it is done”. (Interviewee 1,
female)
There were three other interviewees who brought
up similar viewpoints describing instant, automated
feedback:
“It can be continuous feedback, like whenever
you submit an assignment, you would get “Great, xx
% of the course is now completed”. It may be generic,
but it still leaves a good feeling.” (Interviewee 5,
female)
Many of the interviewees distinguished the
automated feedback in the platform as being more
behavioural and the (delayed) manual feedback given
by the teacher as more cognitive and important:
“The correctiveness is probably the priority, in a
sense that if it comes afterwards, at least you know
for the future what went wrong even if the feedback
did not help you in the learning process during the
course”. (Interviewee 4, female)
The responses imply, as has been concluded in
earlier research, that behavioural feedback is just as
important as cognitive feedback because it provides
students opportunities to reflect on the learning
process, thus helping students self-regulate their
learning (namely, monitoring, planning and adapting)
(Sedrakyan et al., 2018).
Cognitive feedback is a bit more flexible in terms
of perfect timing, but nevertheless the time between
assignment submission and receiving feedback
should not be too long as it has a negative effect on
self-regulation, especially if actions are expected on
the basis of the feedback. An interviewee described
the mismatch between personal schedules, deadlines
and received feedback, which led her to drop out of
the course:
“I got constructive feedback of which I realized that
I have to a lot to correct, but right now I am really busy
at work and I have no time to make the corrections.
[…] It was like, the (final) deadline in this assignment
had to be set by myself and I had set it for the day after
tomorrow. I got the feedback a week earlier, so I just
don’t have the time [to make the corrections]. If there
CSEDU 2021 - 13th International Conference on Computer Supported Education
136

had been a possibility to postpone the deadline, then of
course.” (Interviewee 7, female).
The perfect timing of the feedback thus seems to
depend on the quality and content of the feedback.
Another student suggested that the date when
feedback is available should be announced in the
learning platform, to be able to plan the study process
in the course to match with the schedules of personal
life. Such a feature is probably quite easy to add in the
settings of the activity tools in online platforms, and
it could contribute to the data being collected into
learning dashboards for progress monitoring.
The type and purpose of the feedback also affects
the preferences on the feedback source. Cognitive
feedback is expected from the teacher on specific
assignments and overall competence development.
Some suspected that artificial intelligence could not
offer as good feedback as a teacher. The reason was
that the teacher was considered an expert, and the
view of an expert was highly appreciated. Similarly,
if feedback is merely behavioural and confirmative by
nature, it can be automated or auto-generated by the
learning platform:
“I don’t think there is a problem with whether the
feedback comes from the machine or the teacher. It
depends on the quality of the feedback, of course. It
is not certain that you’ll get more than “ok” from
other students or the teacher. So if it [feedback]
comes from the computer or the teacher, it doesn’t
matter.” (Interviewee 6, male)
“It depends on the type of feedback. If you only
do a test in which you choose alternatives, it is ok to
get the feedback from the system. No further
comments are needed. But if the assignment is a
written essay with reference material, it is nice to get
written feedback, not just a numeral grade.”
(Interviewee 3, female)
Nearly all interviewees claimed that it is good to
have multiple sources of feedback. Interestingly
enough, supportiveness was expected mostly from
peer feedback. Peer feedback was also considered as
part of the learning process or as a task for practicing
cognitive skills such as argumentation:
“A few courses have had peer review practices
and with fellow students, they don’t necessarily have
the skills to give feedback. It should be trained more
before practicing it.” (Interviewee 6, male)
Therefore, constructive feedback was not really
expected from peers. The benefits of getting positive
confirmations and different viewpoints were, however,
acknowledged. Peer feedback was suggested to be
incorporated in the learning platform with simple and
easy ways, such as giving star ratings or thumb-ups.
Students preferred fast and effortless ways of giving
peer feedback, since group and individual assignments
were considered arduous and time-consuming.
The importance of peer evaluation lies within co-
regulated learning as students learn to regulate their
efforts when they are being compared to others’
behaviour and outcomes (Sedrakyan et al. 2018).
However, in the survey, only 15% of the respondents
thought it would be useful to have a comparative
report of their progression and competence
development with respect to their peers. 60 % replied
that such a view would not benefit them and 25 %
were not sure if such a function was useful. The issue
was discussed by some of the interviewees; one
student felt peer comparison dashboards might work
because of the competitive element, but another
student regarded it as possibly disturbing from the
point of view of self-regulation.
4.4 Descriptive Analytics: A Must Have
When shown the table 1 during interviews, all of the
students selected descriptive analytics as the most
important and useful category from them. One student
even claimed that descriptive analytics is a norm and
should be available by default, so it should not be a
matter of choice or preference. Another student chose
descriptive analytics as the most important in the
context of independent online studies, but claimed that
in blended learning course, prescriptive analytics is
needed more. However, this overall opinion does not
fully match with the features which the students
selected as their favourites. The summary of their
choices is described in table 2; the number of students
who selected the item is shown in brackets.
There were two choices made outside the
presented table: the other one was an access point for
all material on a single course and the other was a
view based on received feedback (how well the
student had succeeded as compared to the assignment
requirements). These two choices may, however, be
categorized into features of descriptive analytics.
To be able to view and monitor what is done or
undone was the most important feature, as the survey
responses also revealed. Currently, in Haaga-Helia’s
Moodle such as view is offered on a course level (the
course gradebook and on some courses the
progression tracking block). Within the context of the
whole study program, monitoring of one’s
progression is not available in Moodle and that was
one of the issues criticized by the students. They feel
it is not easy to log into another system – or at worst
into multiple systems – to get a comprehensive view
of their studies. This sort of overall view could be
constructed with Moodle’s Learning Plan tool,
Students Expectations on Learning Analytics: Learning Platform Features Supporting Self-regulated Learning
137
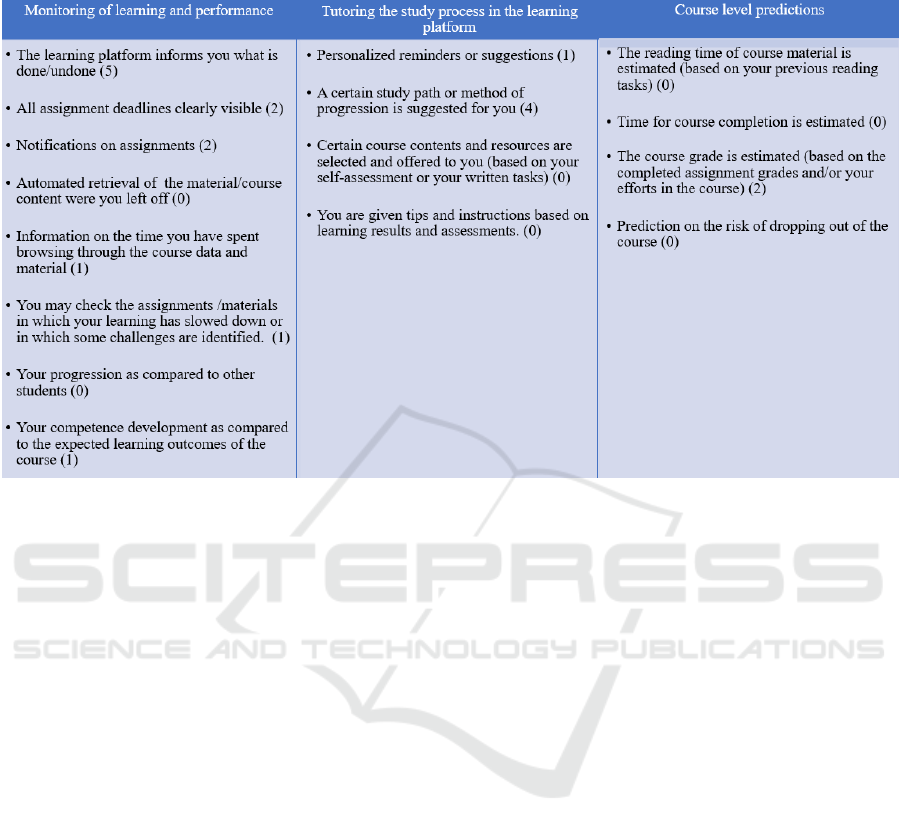
Table 2: The division of actions and features supporting self-regulated learning on the learning platform, the amounts of
student selections in brackets.
complemented by the Competency tool. Or
alternatively, a plugin or an integrated external
software could be used for offering a comprehensive
student dashboard for study progress monitoring on a
study program level. On a course level, the current
tools for tracking progression seemed to be enough,
but students hoped the tools would be used regularly
and consistently in all study units.
Other preferred features of the listed descriptive
analytics were the assignment notifications and view
of upcoming (and past) deadlines. The responses do
not clearly indicate if the Moodle calendar in student
dashboard is in efficient use; but at least it is possible
to use the calendar as a tool for planning and
gathering all the deadlines from all courses in one
location. Students may also mark their own events in
the calendar.
Descriptive analytics and the need for it was
widely discussed and explained by the students in the
interviews. For example, the possibility of monitoring
one’s time usage was an interesting option for most;
clearly it was considered as a potential way of
regulating the personal study process and efforts:
“I like to analyse how I’ve spent my time.
Information on what I’ve used my time for in the
course and how long I’ve spent moving around in the
environment could help me in defining if I have used
my time reasonably.” (Interviewee 7, female)
“Sure, it would be interesting to see how long I’ve
used for a particular task. In my everyday life there is
quite a many interruption.” (Interviewee 6, male)
Another student was more suspicious of the
ability of learning analytics to provide accurate study
time data, simply because she regularly used to
download the course material and read it offline.
Furthermore, being able to identify challenging tasks
or materials was considered useful in principle, but
the students suspected that in practice it would be
difficult to define reliable indicators. As one of the
students remarked, used time and the amounts of
clicks do not necessarily correlate with challenges or
difficulties in the learning process.
4.5 From Descriptive to Prescriptive
Analytics
The interviewees selected suggestions for suitable
study paths and methods of progression as the second
important functionality. Evidently, there is a need for
prescriptive analytics, but this may be due to two
reasons. First, in the survey responses, the courses in
Haaga-Helia’s Moodle were generally considered to
have a bad structure and messy layout. If the course
view is experienced as incoherent, it is
understandable that there is a need for a tool that
could pick out and organize all the important study
material and assignments:
CSEDU 2021 - 13th International Conference on Computer Supported Education
138

“[…] everything that is connected to the course
would be on different pages and then it would
progress page by page or whatever the logic would
be. But it would be sequenced in a way that when you
can do this, you may move forward to this [material].”
Secondly, many students were very busy with
their work and family, and they expected the learning
platform to somehow help them with scheduling by
offering and suggesting ways to proceed with course
selection, for instance. Therefore, the need for
prescriptive analytics is connected with time
management and self-regulation processes, as one of
the interviewees described:
“I have quite a demanding job, I’m in a hurry at
times. To be honest, it is sometimes challenging
because I don’t have the time to focus on which
courses I have to work on and such. So, if there’s
some sort of guidance, as I said in the beginning, or
recommendation available.” (Interviewee 1, female)
Even though the features of prescriptive analytics
were not generally seen as important as the
descriptive features, the tools for guidance and
steering the study process were discussed extensively
by many of the interviewees. For example, when
asked about using chat bots in student advising and
getting further instructions, one of the students
replied:
“It’s essential that I get to go forward. Another
thing as a blended learning student is that I do
assignments and advance my studies quite late in the
evenings or weekends. I don’t presume teachers work
at that time. If a machine can help me, then there’s
additional value to me.” (Interviewee 4, female)
Some students were more prejudiced towards the
usefulness of prescriptive analytics based on
automation:
“I was thinking about getting tips or instructions
based on my learning results. In principle that sounds
fine. But when I think of what Spotify suggests to me
based on what I have listened, it doesn’t really match.
I am a bit sceptical.” (Interviewee 7, female)
Nevertheless, prescriptive analytics is what
should be developed alongside descriptive analytics,
since mere description of performance does not
enhance learning. Tanes and colleagues (2011)
analysed the content of feedback messages which
were sent to students at risk of dropping out, on the
basis of the data signals recorded in the system. They
found out that the messages contained summative
analysis without any instructions or feedback on the
learning process or suggestions on how to overcome
the challenges. Consequently, the messages had no
effect on students’ learning (Tanes et al, 2011).
4.6 Accurate Predictions for
Optimizing the Study Process
Predictive analytics was met with a dual response:
one interviewee considered it the most promising type
of learning analytics where we should head for and
another student thought it mainly helps teachers.
Students also had mixed opinions on predictions or
estimates on study time: some believed it cannot be
accurately predicted because learning strategies,
styles and conditions of studying vary; and others
thought it could help a lot with self-regulation simply
because they would be able to plan how much time
they should reserve for studying. An estimate on
expected reading time or time required for completing
an assignment, a task or the whole course was seen as
a way to make time usage more effective, since it
could be easier to optimize regular studying and
balance it with personal life by using free time slots
efficiently. One of the interviewees suggested a
predictive thermometer tool which could constantly
monitor the study progression on a course level,
providing alerts when the study pace is too slow,
giving suggestions on what to do and demanding
actions and rescheduling if deadlines seem to
approach too fast. Another student speculated that
grade predictions could actually help students set
reasonable learning goals:
“A recommendation feature could be… when a
task has not progressed… if I could set the expectation
for myself, that I go for grade 4 or 5 in this course and
the system predicts that grade 3 is more likely with this
effort. It could recommend additional material for
reading.” (Interviewee 6, male)
Providing predictions on the risk of dropping out
were viewed as potentially beneficial, but only if a
possibility for extra guidance and academic advising
was offered in connection with such predictions. It is
possible that some students would take predictions in
a negative way, as one of the students reflected.
5 CONCLUSIONS
Students seemed to appreciate and expect a wide
range of descriptive analytics available to them. In the
survey responses, the demand for time management
and planning tools was significant. Getting relevant
feedback on time was another major need. On the
basis of the interviews, behavioural feedback
contributing to descriptive learning analytics should
be instantaneous and confirmative and this can be
given by the learning platform or the teacher.
Cognitive feedback was expected to be well timed,
Students Expectations on Learning Analytics: Learning Platform Features Supporting Self-regulated Learning
139

corrective and to some extent also suggestive, and it
was expected mostly from the teacher. Supportive
feedback was expected from peers. When the results
are viewed in the context of the three phases of self-
regulation, it is notable that learning analytics tools
are expected to provide help mostly in the forethought
phase (especially with planning and scheduling). The
support from learning analytics in the performance
phase through comprehensive monitoring and instant
feedback is also appreciated and expected. The need
for learning analytics tools in the self-reflection phase
was less evident.
Of the three types of learning analytics
dimensions, descriptive analytics was considered the
most important and even fundamental. Features of
prescriptive and predictive analytics were met with a
more dubious attitude. The scepticism may be due to
the fact that there are only a few prescriptive and
predictive uses of learning analytics available.
However, as Park and Jo remark, as descriptive
analytics begins to be widely available, it is only
natural to add some cases of predictive analytics into
learning platforms and the student dashboard views
(Park & Jo, 2015). Perhaps the prescriptive analytics
could begin with simple recommendations and subtle
suggestions with comparisons such as “students who
read this material, also watched these videos…” or
“students who got the best grades spent 10 hours
reading this material”. In any case, behaviour-based
student dashboards provide important information to
the students alongside knowledge-based dashboards
(Auvinen et al. 2015), and sequential or procedural
analysis of the student’s actions in the learning
process provide data that could help students find
suitable strategies for self-regulation (Sedrakyan et al,
2018). Learning analytics tools should utilize a
mixture of behavioural and knowledge-based data in
order to provide meaningful descriptive dashboards,
useful and well-timed prescriptive analytics and
feedback as well as reliable predictions on learning.
REFERENCES
Auvinen, T., Hakulinen, L. & Malmi, L. (2015). Increasing
students’ awareness of their behavior in online learning
environments with visualizations and achievement
badges. IEEE Transactions on Learning Technologies,
8(3), 261-273.
Alvarez, I., Espasa, A. & Guasch, T. (2012). The value of
feedback in improving collaborative writing
assignments in an online learning platform. Studies in
Higher Education, 37, 378-400.
Buckinham Shum, S., Ferguson, R. & Martinez-
Maldonado, R. (2019). Human-Centred Learning
Analytics. Journal of Learning Analytics, 6(2), 1-9.
Gröhn, A. & Nevalainen S. 2018. Oppimis-
analytiikkajärjestelmät. Ominaisuuskartoitus.
Publication of the eAMK project.
Guasch, T., Espasa, A., Alvarez, I. & Kirschner, P. A.
(2013). Effects of feedback on collaborative writing in
an online distance education. Distance Education, 34
(3), 324-338.
Hartikainen, S. & Teräs, M. (2020). Käyttäjätarpeiden
kartoitus. Opiskelija-opettajatyöpajat. In Hartikainen,
S., Koskinen. M., & Aksovaara, S. (eds.). Kohti
oppimista tukevaa oppimisanalytiikkaa
ammattikorkea-kouluissa. Jyväskylä University of
Applied Sciences, Publication 274. Jyväskylä
University of Applied Sciences.
Hooli, H. (2020). Students’ experiences of learning
analytics in academic advising for supporting self-
regulated learning. A Master’s Thesis. Oulu:
University of Oulu.
Liu, F., & Cavanaugh, C. (2012). Factors influencing
student academic performance in online high school
algebra. Open Learning: The Journal of Open, Distance
and e-Learning, 27(2), 149–167.
Nussbaumer, A., Hellman, E-C., Gütl, C. & Albert, D.
(2015). A competence-based Service for Supporting
Self-Regulated Learning in Virtual Environments.
Journal of Learning Analytics, 2,1, 101-133.
Park, Y. & Jo, H. (2015). Development of the Learning
Analytics Dashboard to Support Students’ Learning
Performance. Journal of Universal Computer Science
21, 1, 110-133.
Schumacher, C & Ifenthaler, D. (2018). Features students
really expect from learning analytics. Computers in
Human Behavior, 78, 397-407.
Sedrakyan, G., Malmberg, J., Verbert, S., Järvelä, S. &
Kirschner, P. A. (2018). Linking Learning Behavior
Analytics and Learning Science Concepts: Designing a
Learning Analytics Dashboard for Feedback to Support
Learning Regulation. Computers in Human Behavior,
107. https://doi.org/10.1016/j.chb.2018.05.004
Silvola, A., Jylkäs, T. & Muukkonen, H. (2020, August 20).
Opintopolku palvelupolkuna AnalytiikkaÄly-
hankkeessa. Pedaforum presentation. https://analytiik
kaaly.fi/wp-content/uploads/2020/09/SilvolaJylkas-
Muukkonen_PF2020_Opintopolku_palvelupolkuna_A
A_hankkeessa.pdf
Society for Learning Analytics Research (SoLAR). (2020,
November 11). What is Learning Analytics?
https://www.solaresearch.org/about/what-is-learning-
analytics/.
Tanes, Z., Arnold, K. E., King, A. S., & Remnet, M. A.
(2011). Using signals for appropriate feedback:
Perceptions and practices. Computers & Education,
57(4), 2414–2422.
Viberg, O., Hatakka, M., Bälter, O., & Mavroudi, A.
(2018). The current landscape of learning analytics in
higher education. Computers in Human Behavior, 89,
98–110.
Zimmerman, B. (2002). Becoming a Self-Regulated
Learner: An Overview. Theory Into Practice, 2, 63-144.
CSEDU 2021 - 13th International Conference on Computer Supported Education
140
