
Homicide Network Detection based on Social Network Analysis
Victor Chang
1
, Yeqing Mou
2
, Qianwen Ariel Xu
1,2
, Harleen Kaur
3
and Ben S. Liu
4
1
Artificial Intelligence and Information Systems Research Group, School of Computing,
Engineering and Digital Technologies, Teesside University, Middlesbrough, U.K.
2
IBSS, Xi’an Jiaotong-Liverpool University, Suzhou, China
3
Department of Computer Science and Engineering, School of Engineering Sciences and Technology,
Jamia Hamdard, New Delhi, India
4
Department of Marketing, Quinnipiac University, U.S.A.
Keywords: Social Network Analysis, Crime Network Detection, K-core Decomposition, Centrality Analysis.
Abstract: This paper aims to explore the use of social network analysis in identifying the most active suspects and
possible crime gangs in the network. The homicide dataset provided by White & Rosenfeld is employed and
both the victim network and suspects network are structured by the use of Rstudio. This paper finds that the
criminal gang and group of victims in homicide cases could be investigated by conducting centrality analysis
and detecting cliques in these two one-mode networks. Moreover, the same features of victims or suspects
are significant indicators for distinguishing and discovering victim groups or criminal gangs. As suspects or
victims with the same features will be gathered into the same community in the community analysis of SNA,
it is more effective to identify victim groups or criminal gangs by analyzing their characteristics, so that crimes
can be resolved more efficiently or even prevented.
1 INTRODUCTION
Nowadays, the crime rate is increasing rapidly, and
massive data on different categories of crime is
generated every year around the world. This is a huge
challenge for the police departments to collect and
store these data. For example, developed networks
and telecom provide criminals with an accessible and
convenient channel to carry out financial crimes
worldwide with developed networks and telecom.
Numbeo (2021) collects crime data from the majority
of countries in the world and evaluates their overall
level of crime by the crime index. The crime level of
a given country is considered as very low if the crime
index is lower than 20, low if the crime index is
between 20 and 40, moderate if the crime index is
between 40 and 60, high if the crime index is between
60 and 80 and very high if the crime index is higher
than 80. According to the statistics from Numbeo
(2021), among the 135 countries it investigated, only
50 countries’ overall levels of crime are considered as
low or very low, and 23 countries’ overall levels of
crime are considered as high or very high at the same
time. In addition, according to the Statistica (2021),
in 2020, Los Cabos, Mexico, had the highest murder
rate of any city in the world, with 111.3 murders per
100,000 population, and the USA had a significantly
higher homicide rate than the global average. Chinese
Judicial Big Data Research Institute (2019) revealed
that the number of telecoms and network fraud cases
increased by 51.47% from 2015 to 2016.
The
statistics on crime are so surprising; therefore, it is
important to develop an effective method for crime
governance, which can effectively identify suspicious
criminals or criminal gangs to prevent future crimes.
Zhang (2019) states that new opportunities are
available for new crime governance, prevention and
control with big data and social network analysis
(SNA), although crime methods also evolve.
There are different types of widespread crimes
and rampant crime methods during different ages.
They are either influenced by local political policies
or benefited from the development of science and
technology. In China, ten kinds of crimes are induced
into criminal offense cases and both financial crimes
and homicides are two of the ten kinds of a criminal
offense. The residents of St. Louis, Missouri, USA, in
the 1990s, lived in the age of rampant homicides.
White & Rosenfeld (2019) collect the homicides'
relevant data from the police. The dataset records the
suspects (682), victims (569) and witnesses (195),
who included the murders that happened in St. Louis
Chang, V., Mou, Y., Xu, Q., Kaur, H. and Liu, B.
Homicide Network Detection based on Social Network Analysis.
DOI: 10.5220/0010533803290337
In Proceedings of the 6th International Conference on Internet of Things, Big Data and Security (IoTBDS 2021), pages 329-337
ISBN: 978-989-758-504-3
Copyright
c
2021 by SCITEPRESS – Science and Technology Publications, Lda. All rights reser ved
329

and the relation between all roles and each homicide
composes a social network (SN).
This paper will first identify the most active
suspects and possible crime gangs in the network
based on the information mentioned above. The
social network analysis will be conducted from two
aspects, including the centrality analysis and
community detection. Then practical advances for
police to monitor and investigate financial crimes
established on SNA are proposed.
Based on the advanced social network analysis
method, this paper, on the one hand, contributed to
the detection of both a one-mode SN and a bipartite
SN. Firstly, the classical homicide network is
analyzed based on suitable methods. Then, the most
active suspects and potential crime gangs are
detected. On the other hand, all the achievements are
available for the law enforcement agency to monitor
and detect financial fraud cases at a faster pace.
2 LITERATURE REVIEW
2.1 Data Analytics in Crime
Governance
With the development of emerging information
technologies, such as big data analytics, data mining,
machine learning, etc., the methods for crime
governance have become more and more advanced.
Kumar and Nagpal (2019) established a Naive
Bayesian classifier to introduce a solution to deal with
and mitigate the issue of crime incidents. They
proposed this solution to identify the most possible
criminal of a specific crime.
To improve the
effectiveness of crime detection and control of criminal
behavior, Xu et al. (2020) employed techniques of data
mining and machine learning algorithms, e.g., k-means
clustering, with cloud computing to carry out image
processing. Moreover, Bhuyan and Pani (2021)
employed a geographical crime mapping algorithm to
determine areas that are at greater risk, and the artificial
neural network was trained by the data provided by
these areas so that the network can be used to model
the crime trends. Additionally, they adopted Hadoop
software to enhance the approach.
Colladon and Remondi (2017) applied social
network analysis to the area of money laundering
detection and employed some common measures in
SNA, such as degree, closeness and betweenness
centrality, as well as network constraint. In this paper,
we will explore the ability of social network analysis
in identifying the most active suspects and possible
crime gangs in the network. Although this method has
been applied in similar areas, in addition to using the
most basic measures, our research conducts a deeper
study of criminal networks through community
analysis, including the clique analysis and k-core
decomposition.
2.2 Social Network Analysis
Social network refers to a net combined by nodes and
links. From a social network perspective, the human
interaction in the social environment can be considered
as a relationship-based model or principle and social
network a quantitative way to reflect this model. SNA
can be divided into two types, which are complete
network analysis (CNA) and egocentric network
analysis (ENA). A CNA concentrates on all nodes
instead of a specific one and it includes all the relations
among these nodes (Marin and Wellman, 2009). For
example, Cox et al. (2019) apply the complete network
analysis in personal drinking intentions. They use it to
study the impact of misperceptions of peer drinking on
college students’ drinking intentions.
Unlike the CNA, an ENA concentrates on the
network around one node, usually called ego. The
network includes all the nodes connected to the ego
and their relations (Marin and Wellman, 2009). To
distinguish real close friends from
mere acquaintances
in social media friends for marketing purposes, Stolz
and Schlereth (2021) employ the egocentric network
analysis to
predict the strength of real-world
connections through online metrics of similarity
interaction and network data. SNA is applied in many
fields, including Criminology. For example, when core
suspects leave a criminal gang, the influence is
forecasted by (Zhou & Bao, 2014) based on SNA.
Additionally, in the study of hacker social networks,
Décary-Hétu and Dupont (2012) show that SNA is
helpful in two aspects. Firstly, SNA is able to identify
the key players' positions in the network. Moreover,
SNA helps determine how many resources are required
to deal with a target organization.
2.2.1 Centrality Analysis
Centrality analysis is a common concept in SNA and
it describes location information of a node or a person
in a network via the number. Thus, the importance of
every vertex would be measured by centrality divided
into three parts: degree, closeness and betweenness
centrality. The degree centrality presents the number
of other nodes adjacent to a given node and it is used
to measure the local centrality (Scott, 1991). A node
with a high degree of centrality means that the node
is more attractive or active than other nodes.
IoTBDS 2021 - 6th International Conference on Internet of Things, Big Data and Security
330

However, it also means that the node is more
powerful and can negatively impact a group by
withholding or distorting the information.
Betweenness centrality is used to evaluate the
degree of a specified node, which stands on the
shortest paths between other nodes in the graph
(Borgatti, 1995) like that identified in critical path
analysis. A node with a high betweenness centrality
means that it plays a significant part by its
gatekeeping role in the network because it can control
the information dispersal among other nodes.
Closeness centrality (Freeman, 1980) is used to
evaluate the global centrality of nodes by measuring
the distance from other nodes. A node with the
highest closeness centrality indicates that it can get
information most efficiently.
2.2.2 Community Detection
The clique analysis is conducted in our research. For
the given figure G= (V, E) - Among them, the V= {1,
…, n} is the vertex set of Figure G, and E is the edge
set of Figure G. The group of Figure G is a collection
of nodes with connecting edges. A clique is a subplot
of G, where all vertices are directly connected to one
another (Bonacich, 1972). A maximum clique is a
clique with the most significant number of vertices.
In a ‘maximum clique’, the meaning of ‘maximum’ is
not the same as ‘maximal’. A maximum clique must
be maximal as well, but the opposite is not necessarily
true. (Ashay Dharwadker, 2006). A clique is always
maximal because it cannot add a node or vertex unless
it makes it less connected (Kouznetsov and
Tsvetovat, 2019).
Apart from the clique, k-core decomposition is
also an available algorithm applied to execute
community detection among a social network. The
rule of the k-core decomposition is that when a vertex
or a node is removed, the edges connected to it are
removed as well and when a node with degree ≤ k is
removed, the nodes leftover with a new degree ≤ k are
then removed. If a node belongs to the graph with k-
core but removed from the graph with (k+1)-core,
then this k is the node’s K-value. The largest K-value
is the K-value of the graph (Alvarez-Hamelina et al.,
2005). Community refers to the group that shares the
same K-value and K value means that all entities are
linked to at least k other objects in the group (OZGUL
et al., 2010). This means that a community refers to a
cluster and the connections between nodes in this
cluster are closer than those with external nodes. The
nodes have the same feature, and with this respect, the
feature refers to the minimum number of nodes linked
to it. Additionally, the K-core algorithm is a layer
analysis used to evaluate the network structure and
extends from the outer layer to the inner layer of the
expanded network hierarchy.
3 NETWORK ANALYSIS
3.1 Data
White & Rosenfeld (2019) provided the dataset this
paper used, including data on crime and data on sex.
The crime data set has 870 participants involved in
crime events, including 569 victims, 682 suspects and
195 witnesses. Among them, 41 had two identities.
The sex data set recorded the gender of each
individual. After the data collection and management
for SNA, Rstudio was adopted as the tool to perform
the subsequent analysis in terms of visualizing the
victim and suspect networks and measuring the
network metrics.
3.2 SNA based on Victims Network
Both bipartite and one-mode networks are applied in
this part. The one-mode network shown in Figure 1 is
connected by victims. The degree centrality of part
victims is shown in Table 1, as extracted from various
internet sources. The names of victims involved in the
murder case are also visible. The lines in the graph
refer to the person at both ends are involved in the
same homicides as victims. The nodes with the most
significant size and the color in the graph represent
the highest degree.
Figure 1: One Mode Network Connected by Victims.
Homicide Network Detection based on Social Network Analysis
331

Figure 2: Bipartite Network Connected by Victims and Suspects.
Figure 3: Taking Abrams Chad as an example.
IoTBDS 2021 - 6th International Conference on Internet of Things, Big Data and Security
332

Table 1: The Centrality Degree of Each Victim.
Victims Degree
BarryKyle 14
DaleMike 14
ArmandeBrian 7
DicksonCatherine 7
AbramsChad 6
BarronPhoebe 6
Besides, for those crimes with considerable victims or
suspects, the relation between these victims and
suspects is connected and visualized in Fig. 2. This is
a bipartite network combined by victims and the
suspects. The nodes with incoming and outgoing
arrows represent victims and suspects, respectively.
The node with the biggest size or the deepest color
means that the person is involved in the largest
number of homicides as suspects or victims. The
numerical results, including the in-degree and out-
degree of each node, are recorded in Table 2.
Table 2: Taking Abrams Chad as an example to show how
the roles change in different crimes.
Homicides
The Number
of Victims
The Number
of Suspects
X940103 15 unknown
X970531 8 unknown
X940088 7 unknown
X950187 6 1
X940133 6 1
X950227 6 unknown
X940105 5 unknown
X960271 4 4
X940092 4 unknown
X950226 4 unknown
X940117 4 1
X940107 4 2
X970409 4 unknown
X950236 4 1
3.2.1 Degree and Clique Analysis
The homicides with the most significant number of
victims would be detected by degree centrality and it
reveals how many victims are included in the same
homicide. The largest degree of victims is 14 in Table
1, which means that there are 14 persons involved in
this homicide with him. This is the largest number of
victims in the same homicide. Table II revealed that
the top three crimes with the most victims are
homicides X940103, X970531, and X940088.
However, the suspects haven't been locked down yet.
The three maximal blue cliques in Fig. 1 show the
relation between these victims. They only connect
with the other persons who are involved in the same
homicides with them. For those groups in Fig. 1,
which cannot be connected as a clique, implies that
some victims of them fall into more than one murder
case.
Fig. 3 shows that Abrams Chad is a victim as well
as a suspect in a different case as he has both
incoming arrows and outgoing arrows. While being
oppressed in multiple cases, he became a suspect in
the murder of others. Thus, mental health should be
noticed to prevent the negative psychology of victims.
3.3 SNA based on Suspects Network
Suspects connect the one-mode network with the
weight shown in Figure 4 in this part and the
corresponding degree is represented in Table . The
nodes represent suspects and they are connected if
they participated in the same murder case. The
thickness of the nodes’ edges represents the weight,
expressing the number of times two criminal suspects
participated in the same cases. In this graph,
independent points are deleted as the suspects who
have no relationship with others are not the research
target of
this report. Fig. 5 reveals the community
detection situation of this suspect's network based on
the K-core decomposition algorithm and the
interpretation for results is in Table 4.
Table 3: The result summary of the suspects’ centrality.
Suspects Degree Betweenness
Keane Arthur 33 1131.6
Marion Joe 26 424.07
Jones Ezekial 17 105.47
Williamson Bradford 2 344
Fig. 5 and Table 2 show the outcomes of the K-core
algorithm, in which the color and size distinguish the
nodes from each other and form the clusters, and the
number at the center of each node represents the K
value. Taking the largest blue cluster as an example,
the nodes in this cluster are linked to at least 12 other
nodes. A particular instance, X403 (Williamson
Bradford), is presented separately in Fig. 6.
Homicide Network Detection based on Social Network Analysis
333
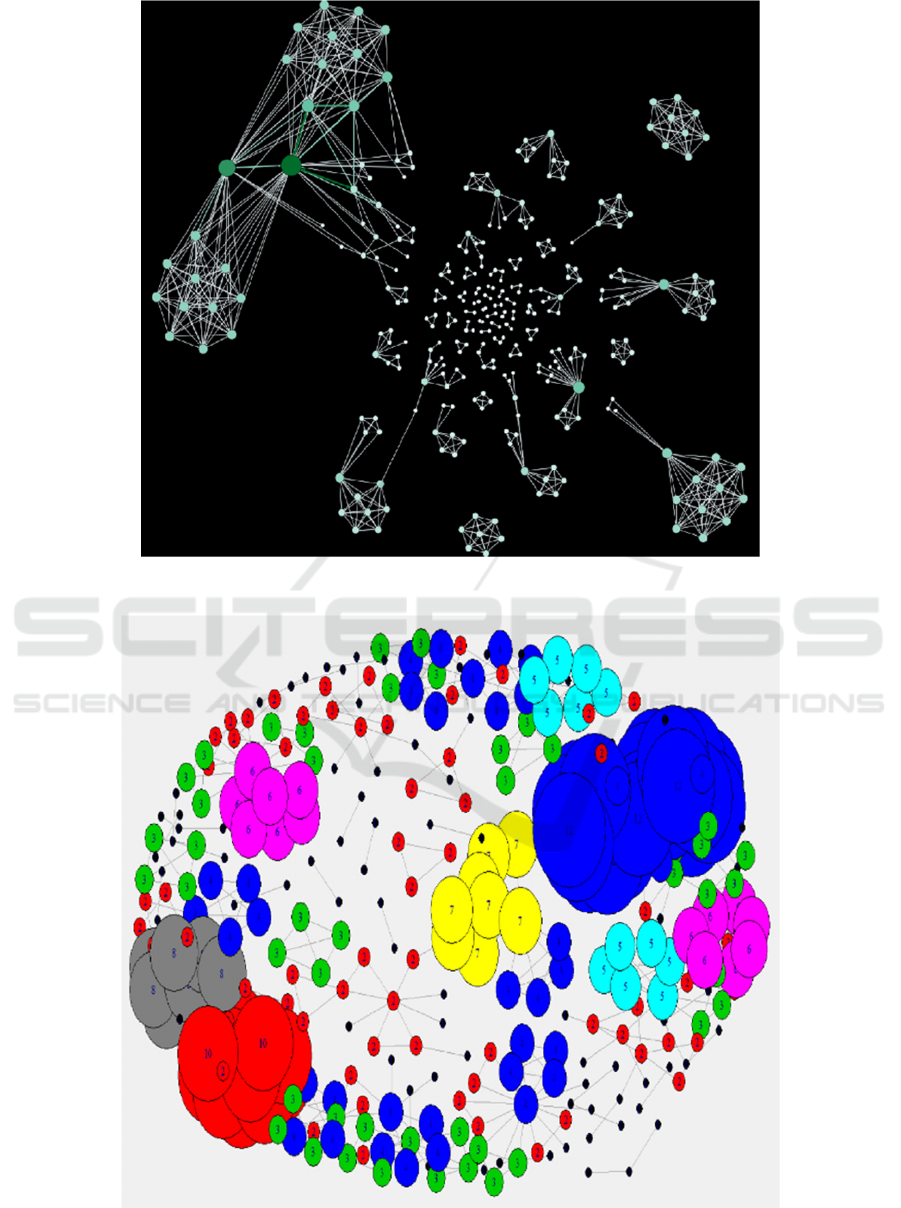
Figure 4: The one-mode network of suspects.
Figure 5: Visualization result of the decomposition.
IoTBDS 2021 - 6th International Conference on Internet of Things, Big Data and Security
334
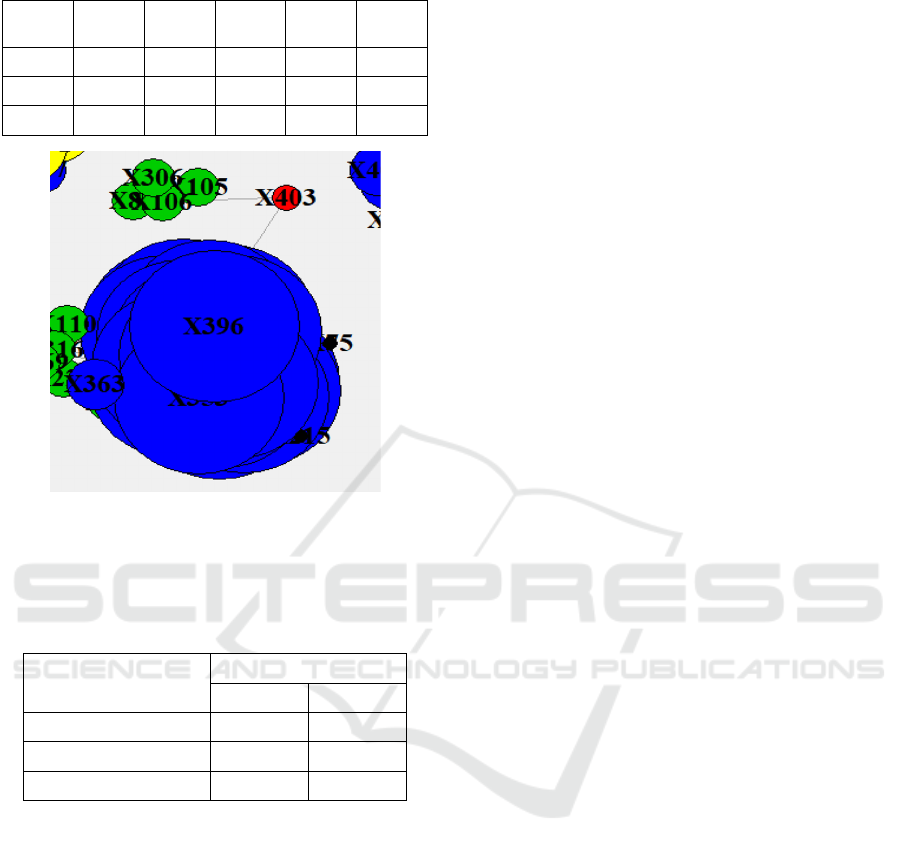
Table 4: Numeric results of the decomposition.
Color Black Red 1 Green Blue 1
Light
blue
k-value 1 2 3 4 5
Color Purple yellow Grey Red 2 Blue 2
k-value 6 7 8 10 12
Figure 6: Taking Williamson Bradford as an example.
The total number of nodes and edges in each network
is shown as follows.
Table 5: Number of Nodes and Edges.
Graph
Total number
Nodes Edges
Victims - Suspects 51 227
Victims - Victims 213 769
Suspects - Suspects 306 657
3.3.1 Degree and Community Analysis
The degree could be used to target the suspects
involved in the homicides with the largest number of
suspects. There are two possibilities for these
individuals. Firstly, they participate in homicides as a
suspect in a vast number of homicides. Secondly,
there is a considerable number of cahoots with them.
In short, they build the most links with others.
Besides, betweenness centrality, an index that reveals
how many nearest distance routes a node throughout
could explain the importance of nodes. Table III
shows that Keane Arthur and Marion Joe are the most
critical suspects and they deserve the most attention
from the police since they connect with the most
suspects and establish the most significant number of
the shortest paths for all suspects.
Fig. 5 and Table 4 conduct community detection.
The k value of the most significant blue nodes is 12
and this means that all nodes in this community
connected with at least 12 suspects. All the nodes
with this feature will be gathered into the same
community and represented as the largest blue nodes.
Keane Arthur and Marion Joe are also induced into
this largest blue group with 33 and 26 as the degree
centrality, respectively, which further improves the
activity of the two suspects. Nevertheless, the
numeric classification is not the absolute indicator
that could be applied to decide the importance or level
of risk of a suspect. Taking Williamson
Bradford(X403) as an example, he is an active
suspect and connects with some crucial suspects.
However, the k- value is 2, which is the second-
lowest value in this network. Fig. 6 shows that this
suspect is related to two crime cases with substantial
K-values, 3 and 12, separately. In other words, he is
familiar with dangerous persons, even though he is
not active.
4 CONCLUSION AND
SUGGESTION
Our paper applies advanced social network analysis
to the area of crime governance. From the homicide
cases analyzed in our research, the criminal gang and
group of victims could be investigated by detecting
cliques in the two one-mode networks, victim
network and suspect network. Our method can also be
applied to other types of crimes, including financial
fraud detection. With the continuous generation of
crime data at present, it is easy to replicate and be
used by the police departments.
On the one hand, for the network connected by
suspects, for criminal gangs, there is a networked
structure among the internal members of the criminal
organization. Gang crime presents a particular social
network characteristic (Zhong et al., 2019). Both
clique and the community results of the K-core
decomposition algorithm are the significant structure
for the recognition of potential criminal gangs. When
a crowd of individuals always shows the same crimes
as suspects, the relation between them could be
displayed by the bold lines in a clique via social
network analysis methods. Besides, relevant features
could be assigned into the suspects' network in the
form of attributes and these common characteristics
are the necessary factors to clarify a criminal gang.
For example, for telecom financial fraud criminal
gangs, the phone number region can be a significant
Homicide Network Detection based on Social Network Analysis
335

clue for distinguishing and discovering the strong
point of criminal gangs. Furthermore, education and
work experience are powerful features to recognize a
criminal gang. All these features could be added as an
additive in practice to detect criminal gangs based on
cliques or communities.
On the other hand, both telecom financial fraud
and homicides are always well-focused, leading to the
same feature of victims in the same fraud case.
According to Ma (2018), the only way to prevent or
reduce this kind of case is to first combat from the
source and then carry out a full chain strike on the
upstream, midstream and downstream links.
In short, first of all, centrality for suspects is a
critical indicator to investigate how dangerous a
suspect is in a criminal case. Degree centrality is not
the only way to detect itself, betweenness and
closeness centrality are too. A better approach should
combine all three so that the system can issue a
certificate to monitor a suspect's activities. Then,
clique and community detection are the two advanced
methods in SNA to investigate criminal gangs. Some
relevant attributes are also a kind of compelling proof
to recognize targeted criminal gangs.
Our research also has several limitations. First of
all, the data we used is secondary data. It is difficult
to confirm the accuracy and integrity of the data,
which may lead to a possible bias in the analysis
results. The second limitation is that the case we
analyzed is limited to homicides. Thus the
effectiveness of this method in detecting other kinds
of crimes may vary. In our future work, we will
collect more crime data on different kinds of crimes
and test the effectiveness of the social network
analysis method.
FUNDING
This work is supported by VC Research (grant
number VCR 0000094).
REFERENCES
Alexander Kouznetsov, Maksim Tsvetovat, 2019, Chapter 4.
Cliques, Clusters and Components. [Online] Available
at: https://www.oreilly.com/library/view/social-network-
analysis/9781449311377/ch04.html [Accessed 26 12
2019].
Alvarez-Hamelin, J. I., Dall'Asta, L., Barrat, A., &
Vespignani, A., 2005. k-core decomposition: A tool for
the visualization of largescale networks. arXiv preprint
cs/0504107.
Bhuyan, H. K., & Pani, S. K. (2021). Crime Predictive
Model Using Big Data Analytics. Intelligent Data
Analytics for Terror Threat Prediction: Architectures,
Methodologies, Techniques and Applications, 57-78.
Bonacich, P., 1972. Factoring and weighting approaches to
status scores and clique identification. Journal of
mathematical sociology, 2(1), 113-120.
Borgatti, S. P., 1995. Centrality and AIDS. Connections,
18(1), 112-114.
Chinese Judicial Big Data Research Institute, 2019. China
Justice Big Data Service Platform. [Online] Available
at: http://data.court.gov.cn/pages/index.html [Accessed
20 7 2019].
Colladon, A. F., & Remondi, E. (2017). Using social
network analysis to prevent money laundering. Expert
Systems with Applications, 67, 49-58.
Cox, M. J., DiBello, A. M., Meisel, M. K., Ott, M. Q.,
Kenney, S. R., Clark, M. A., & Barnett, N. P. (2019).
Do misperceptions of peer drinking influence personal
drinking behavior? Results from a complete social
network of first-year college students. Psychology of
addictive behaviors, 33(3), 297.
Dharwadker, A., 2006. The clique algorithm. Proceedings
of the Institute of Mathematics, 1-41.
Freeman, L. C., 1980. The gatekeeper, pair-dependency and
structural centrality. Quality and Quantity, 14(4), 585-
592.
Kumar, R., & Nagpal, B. (2019). Analysis and prediction
of crime patterns using big data. International Journal
of Information Technology, 11(4), 799-805.
Ma, Z., 2018. The Research of the Detection Difficulty and
Solution for New Internet Crimes Based on Telecom
Fraud. Journal of People’s Public Security University
of China (Social Sciences Edition), 3, pp. 78-86.
Marin, A., & Wellman, B., 2011. Social network analysis:
An introduction. The SAGE handbook of social
network analysis, 11.
Numbeo, 2021. Crime Index by Country 2021. Available
at: https://www.numbeo.com/crime/rankings_by_
country.jsp [Accessed 20 03 2021]
Ozgul, F., Bowerman, C., Erdem, Z. & Atzenbeck, C.,
2010. Comparison of feature-based criminal network
detection models with k-core and n-clique. 2010
International Conference on Advances in Social
Networks Analysis and Mining, pp. 400-401.
Scott, J., 1991. Social Network Analysis: A Handbook
SAGE Publications Ltd. London, UK.
Statista, 2021. Crime and punishment around the world -
Statistics & Facts. Available at:
https://www.statista.com/topics/780/crime/#dossierSu
mmary__chapter1 [Accessed 20 03 2021]
Stolz, S., & Schlereth, C. (2021). Predicting Tie Strength
with Ego Network Structures. Journal of Interactive
Marketing, 54, 40-52.
White, N. & Rosenfeld, R., 2019. KONET. [Online]
Available at: http://moreno.ss.uci.edu/data.html#crime
[Accessed 20 07 2019].
IoTBDS 2021 - 6th International Conference on Internet of Things, Big Data and Security
336

Xu, Z., Cheng, C., & Sugumaran, V. (2020). Big data
analytics of crime prevention and control based on
image processing upon cloud computing. Journal of
Surveillance, Security and Safety, 1(1), 16-33.
Zhang, J., 2019. Progress, Hot Spots and Frontiers in
Criminology Research 2018. Study on Crime and
Rehabilitation, 03, pp. 13-23.
Zhong, H., Zhang, H., Yin, D. & Shen, H., 2019. The rank
of suspects in the criminal gang based on Page Rank.
Journal of Guangxi Normal University (Natural
Science Edition), 7, pp. 79-86.
Zhou, Z. & Bao, L., 2014. Application of social network
analysis in the investigation of gang fraud crime.
Journal of Jiangxi Policy Institute, 5, pp. 39-44.
Homicide Network Detection based on Social Network Analysis
337
