
Streetwise: Mapping Citizens’ Perceived Spatial Qualities
Moreno Colombo
1 a
, Jhonny Pincay
1 b
, Oleg Lavrovsky
2
, Laura Iseli
3
,
Joris Van Wezemael
3,4 c
and Edy Portmann
1 d
1
Human-IST Institute, University of Fribourg, Boulevard de P
´
erolles 90, Fribourg, Switzerland
2
Datalets, K
¨
onizstrasse 298, K
¨
oniz, Switzerland
3
IVO Innenentwicklung, Sternmattstrasse 3, Luzern, Switzerland
4
Institute for Spatial and Landscape Development, ETH Zurich, Stefano-Franscini-Platz 5, 8093 Z
¨
urich, Switzerland
Keywords:
Smart Citizens, Smart City, Crowdsourcing, Neural Networks.
Abstract:
Streetwise is the first map of spatial quality of urban design of Switzerland. Streetwise measures the human
perception of spatial situations and uses crowdsourcing methods for this purpose: a large number of people
are shown pairs of street-level images of public space online; by clicking on an image, they each give an
evaluation about the place they consider has a better atmosphere, which is the focus of this article. With the
gathered data, a machine learning model was trained, which allowed learning features that motivate people
to choose one image over another. The trained model was then used to estimate a score representing the
perceived atmosphere in a large number of images from different urban areas within the Zurich metropolitan
region, which could then be visualized on a map to offer a comprehensive overview of the atmosphere of the
analyzed cities. The accuracy obtained from the evaluation of the machine learning model indicates that the
method followed can perform as well as a group of humans.
1 INTRODUCTION
There are no neutral urban spaces, they influence us
positively or negatively. In the work of the
architecture critics and authors Goldhagen and Gallo
(2017), the importance of spatial qualities for our
coexistence and shaping of feelings and memories is
highlighted. On the other hand, the broken windows
theory states that there is a direct connection between
the measured and perceived atmosphere and crime,
for instance, places that have signs of anti-social
behavior or civil disorder might incite more crime
and disorder (Gau and Pratt, 2010). Furthermore,
people create mental maps of cities built upon the
perception of their surroundings, as it was studied by
Lynch (1960). Collective perception could thus be
leveraged towards building a comprehensive image
of a place and planning better cities.
Gathering perceptions from groups and
individuals can be a rather expensive and
a
https://orcid.org/0000-0002-4127-5591
b
https://orcid.org/0000-0003-2045-8820
c
https://orcid.org/0000-0003-3691-1044
d
https://orcid.org/0000-0001-6448-1139
time-consuming process. Data collection often has to
be completed through surveys and with limited reach
of people. Nevertheless, with the advent of the
Internet and information technologies, tasks such as
reaching broad audiences are less complicated than
in the past. Moreover, the development of machine
learning and artificial intelligence methods has eased
the challenges of making conjectures derived from
existing knowledge. While it is difficult to define
concepts such as atmosphere or comfort in a general
and abstract way, it is feasible for people to judge a
specific and concrete situation in terms of their
quality of stay or their sense of security, for instance.
The Streetwise project seeks to measure the
human perception of spatial situations using a
combination of crowdsourcing (Estell
´
es-Arolas and
Gonz
´
alez-Ladr
´
on-De-Guevara, 2012) and machine
learning. Firstly, a public appeal invites a large
number of people to look at pairs of images of public
spaces through a web application, where a question
related to the perception of the shown environment is
posed, and the image which best answers the asked
question is selected by the participant. The collected
data can then be used to train a machine learning
810
Colombo, M., Pincay, J., Lavrovsky, O., Iseli, L., Van Wezemael, J. and Portmann, E.
Streetwise: Mapping Citizens’ Perceived Spatial Qualities.
DOI: 10.5220/0010532208100818
In Proceedings of the 23rd International Conference on Enterprise Information Systems (ICEIS 2021) - Volume 1, pages 810-818
ISBN: 978-989-758-509-8
Copyright
c
2021 by SCITEPRESS – Science and Technology Publications, Lda. All rights reserved

model that learns to effectively reproduce the same
task on new image pairs.
The Streetwise project aims at creating the first
map of the perceived spatial quality of Switzerland.
In this article, the focus is put on the perceived
atmosphere of several Swiss cities, in other words,
on the answer to the question “Where would you
rather stay?”.
This article is structured in the following way:
Section 2 presents the theories and related works on
which this research work is grounded. Then, Section
3 presents the method followed in the development
of the initiative. Section 4 presents the results of the
implementation of the project. Concluding remarks
and future work are presented in Section 5.
2 THEORETICAL BACKGROUND
This section presents the theories applied in the
development of Streetwise.
2.1 Crowdsourcing
The term crowdsourcing implies diverse practices
and thus diverse definitions exist. Authors
Estell
´
es-Arolas and Gonz
´
alez-Ladr
´
on-De-Guevara
(2012) define it as a type of online participation in
which individuals of different knowledge and
characteristics perform a voluntary task. The crowd
contributes with knowledge and experience; the
participants receive some recognition and the
organizers of the crowdsourcing can utilize the
gathered knowledge to their advantage.
Some examples of platforms and projects which
have been developed with the wisdom of the crowd
include Wikipedia
1
, a collaborative online
encyclopedia and iStockphoto
2
, an image shop
where users can sell their photographs.
Crowdsourced data is a valuable source of
information: it does not compromise participants’
privacy, its initial cost is low, and all parties involved
could benefit from the information and results
derived from it (Barbier et al., 2012). Moreover, data
processing, data mining, and machine learning can
be applied to obtain meaningful insights. Thus,
crowdsourcing was chosen as the main source of data
and insights for the implementation of Streetwise.
1
https://www.wikipedia.org/
2
https://www.istockphoto.com/
2.2 Artificial Neural Networks
Artificial neural networks (ANN) or simply neural
networks are inspired by the way the human brain
works, a large number of neurons interconnected and
processing information (Wang, 2003). Their utility is
centered on the fact that they can perform inferences
learning from previous data. They are nowadays
widely applied to solve pattern recognition, image
segmentation, and face recognition problems for
example.
A neural network composed of multiple layers, is
called deep neural network. One type of deep neural
network that has shown successful application in
image and video recognition projects is the
convolutional neural network (ConvNet) (Simonyan
and Zisserman, 2014; Albawi et al., 2017). ConvNets
are similar to traditional ANNs, the neurons of both
types of networks receive inputs and they perform
operations; however, ConvNets require fewer
parameters to be set than traditional ANNs which
translates in the possibility of solving more
processing-intensive tasks (Albawi et al., 2017;
O’Shea and Nash, 2015).
The emergence of ConvNets is due to their
excellent performance and results in image
processing tasks, facilitated by the development of
large image databases such as ImageNet (Deng et al.,
2009) and the improved processing capacity of the
hardware. Following evidence found in the literature,
Streetwise implements a ConvNet to learn features
that make an image be selected as the one with a
better quality (such as atmosphere) than another for
instance. Further details are provided in section 3.
2.3 Perception of Spatial Qualities
The initiative of Salesses et al. (2013) aimed at
quantifying people’s perception of places in cities to
measure the perceptual inequality of the cities of
Boston, New York, Linz, and Salzburg. In this
project, a person evaluates image pairs and answer
the questions “Which place looks safer?” or “Which
place looks more unique?”; images are then scored
based on their win and loss ratio against other
images. The project gathered 208 738 votes, from
7 872 unique participants. Maps of the urban
perception were constructed. The resulting dataset of
this project is known as Place Pulse (PP).
Another related initiative is by the authors Dubey
et al. (2016) which took inspiration from Salesses
et al. (2013) and tried to overcome the limitation of
having a limited number of votes and a low visual
diversity of places. The dataset used for this project
Streetwise: Mapping Citizens’ Perceived Spatial Qualities
811

was named Place Pulse 2.0 (PP 2.0) which is a
crowdsourced dataset that contains about 1.17
million pairwise comparisons of 100 988 images
from 56 different cities. The dimensions used to rank
the images included among others safety and
liveliness. Moreover, the PP 2.0 was used to train a
convolutional neural network model to select an
image over others in regards to a certain perceptual
dimension. An accuracy of above 73% when
selecting the safer, more liveable, and more beautiful
image in a pairwise comparison was achieved.
Further related efforts include the work of Liu
et al. (2017), who produced urban physical quality
evaluation maps of the city of Beijing with
crowdsourced data and deep convolutional methods,
and the research work of Seresinhe et al. (2017) who
applied deep learning to understand what are the
features that make a place beautiful.
In contrast to past efforts, Streetwise has the goal
of gathering the knowledge from the crowd and
open-source tools to create a map of the perceived
atmosphere of cities in Switzerland.
3 METHODS
The method followed in the development of
Streetwise consists of four stages: i) crowdsourcing;
ii) training; iii) scoring; and iv) visualization. Details
about the methods are presented in the following
sections.
3.1 Crowdsourcing
To conduct the crowdsourcing the following steps
were performed:
• Image Retrieval: The first step consists in
selecting the images for the crowdsourcing. In
Streetwise, Mapillary
3
, a platform that hosts and
publishes street-level imagery and map data, was
used as the source to obtain the images.
Mapillary was chosen given its open terms of use
(Creative Commons Attribution-ShareAlike 4.0
International License) applied to image data.
Since this project was conducted with a partner
interested in building a map of the space quality
of the german-speaking region of Switzerland,
street-level images of several cities in that region
were fetched. To this end, a Python script was
written. To select the areas of interest from where
to retrieve the images the geocode system
3
https://www.mapillary.com/platform
Geohash
4
was used in conjunction with the
functions provided by the Mapillary API. The
images were downloaded in the highest
resolution available and their metadata was also
recorded (e.g., geographical coordinates).
• Image Processing: Depending on the data source,
image filtering, and enhancements are often
necessary. This was the case for Streetwise since
images hosted on Mapillary are uploaded by
voluntary users and taken with different camera
types. Blurry images and the ones that had more
than three vehicles (i.e., cars and buses) were
neglected. Other enhancements included
improving the contrast, brightness, and border
cropping.
• Web Application Development: As an interface to
facilitate data collection for crowdsourcing, an
universally accessible and usable application has
to be developed. In Streetwise, a web application
based on Vue.js
5
and using open-source
technologies was developed
6
. The application
provided an introduction to the users about the
project and some instructions on how to use the
tool, followed by an interface to let users select
from an image pair the one best answer the asked
question. The application offered also the
possibility to not select any of the images by
indicating a reason (e.g., when the images were
not clear or if they were too similar), also it was
possible for the users to flag images (i.e., to
indicate that certain photo should not be used),
this last function was implemented to improve
the dataset for further uses.
The application was built in a way that the
number of image pairs displayed to each
participant and also the asked question can be
adjusted in a straightforward manner, allowing to
use the same crowdsourcing technique for the
analysis of several dimensions of the perceived
city environment or even other tasks.
Given the interest of the supporting partners, the
crowdsourcing collected information about the
perceived atmosphere, meaning that participants had
to answer the question (translated from German)
Where would you rather stay? by selecting between
two images the one they considered to have a nicer
atmosphere.
4
http://geohash.org/
5
https://vuejs.org/
6
https://github.com/Streetwise/streetwise-app
ICEIS 2021 - 23rd International Conference on Enterprise Information Systems
812

3.2 Training
Once the crowdsourcing process is completed, a
training phase takes place. The goal of the training is
to obtain a model that enables to artificially replicate
the crowdsourcing results on new sets of data. The
model should thus allow to identify between two
images in which of the represented places a person
would rather stay. Considering the advantages and
recent developments of ConvNets for image
classification (Simonyan and Zisserman, 2014;
Albawi et al., 2017), and their proven effectiveness in
the estimation of human perceptions (Zhang et al.,
2018), the authors opted for implementing a siamese
convolutional neural network (Chopra et al., 2005) to
learn the features that people take into consideration
when choosing one image over the other.
The branches of the convolutional neural network
correspond to the feature extraction layers of the
VGG19 architecture (Simonyan and Zisserman,
2014), a 19 layers deep convolutional neural network
for object recognition, pre-trained on Imagenet
(Deng et al., 2009). The features extracted by the two
VGG19 branches are then merged by concatenation
and fed to a features comparison subnetwork. This
network applies three fully connected layers, before
computing the final outputs through an additional
dense layer. To improve the generalization power
and reduce the risk of overfitting the network, an
aggressive dropout (Srivastava et al., 2014) with a
probability of a node being dropped of 0.9 and an L2
regularization (LeCun et al., 2015) with λ = 0.001
are applied to the dense layers of the features
comparison subnetwork. The architecture of the
network is illustrated on Figure 1, and its output is
the probability that the image input in the top branch
has a better atmosphere than the other, and vice-versa
in a similar manner as performed in (Dubey et al.,
2016) and Ilic et al. (2019).
The training was executed for binary
classification using softmax loss optimized with
stochastic gradient descent, on an 80/20
training/validation split. The data was augmented in
such a way that any comparison in the original
dataset generated a further comparison with the same
pictures, but in the opposite order (the picture
originally on the left moved to the right and
vice-versa). The ground-truth of the newly generated
data can be consequently easily adapted.
3.3 Scoring
Once the classification model is built and trained, it
is possible to automatically simulate the selection
that a human would do for new image pairs. This
comparison can be used to estimate a score
representing how well the atmosphere perceived in a
certain picture compares with the average
atmosphere of the analyzed area. The following steps
should be performed:
• Image Retrieval: A dataset as complete as
possible for tackling the defined problem is
created. This stage was executed by retrieving
from Mapillary, for the cities to be analyzed, all
available images that were not used in the
crowdsourcing. A similar process to the one of
the training stage was executed. The list of cities
and communities to obtain photos from was
provided by the project partners and included
different types of settlements, from rural areas to
cities. All existing images were downloaded in a
resolution of 320 x 320 pixels and their metadata
was also retrieved and stored.
• Perceived Atmosphere Comparison: The neural
network model previously defined and trained
can be used to compare images pairs to estimate
which one is more likely to be perceived by
people as having a better atmosphere.
• TrueSkill Score Computation: Since an image
can be compared against others a number of
times, using the trained neural network, it is
necessary to define a method to use this
information to compute a score representing the
overall perceived atmosphere of an image. To
achieve this goal, the TrueSkill algorithm was
used (Herbrich et al., 2007). TrueSkill is a
Bayesian method that enables the creation of
ranking scores for players in a game; in this case,
it can be considered that the game player is an
image and that this image wins or loses over
others depending on the result of the comparison.
To give the TrueSkill algorithm enough data to
converge, in this practical application, at least 30
comparisons per image were executed. As an
output of the TrueSkill score computation, every
image gets a score, generally between 0 and 50.
A score around 0 means that the image has an
extremely badly perceived atmosphere (and thus,
a person would not like to stay at that place), and
an around 50 implies that the image has an
excellent perceived atmosphere.
• Result Export: Results of the atmosphere scoring
are exported to GeoJSON format
7
. This format
enables the results to be used by any visualization
tool or programming language. Values such as the
7
https://geojson.org
Streetwise: Mapping Citizens’ Perceived Spatial Qualities
813
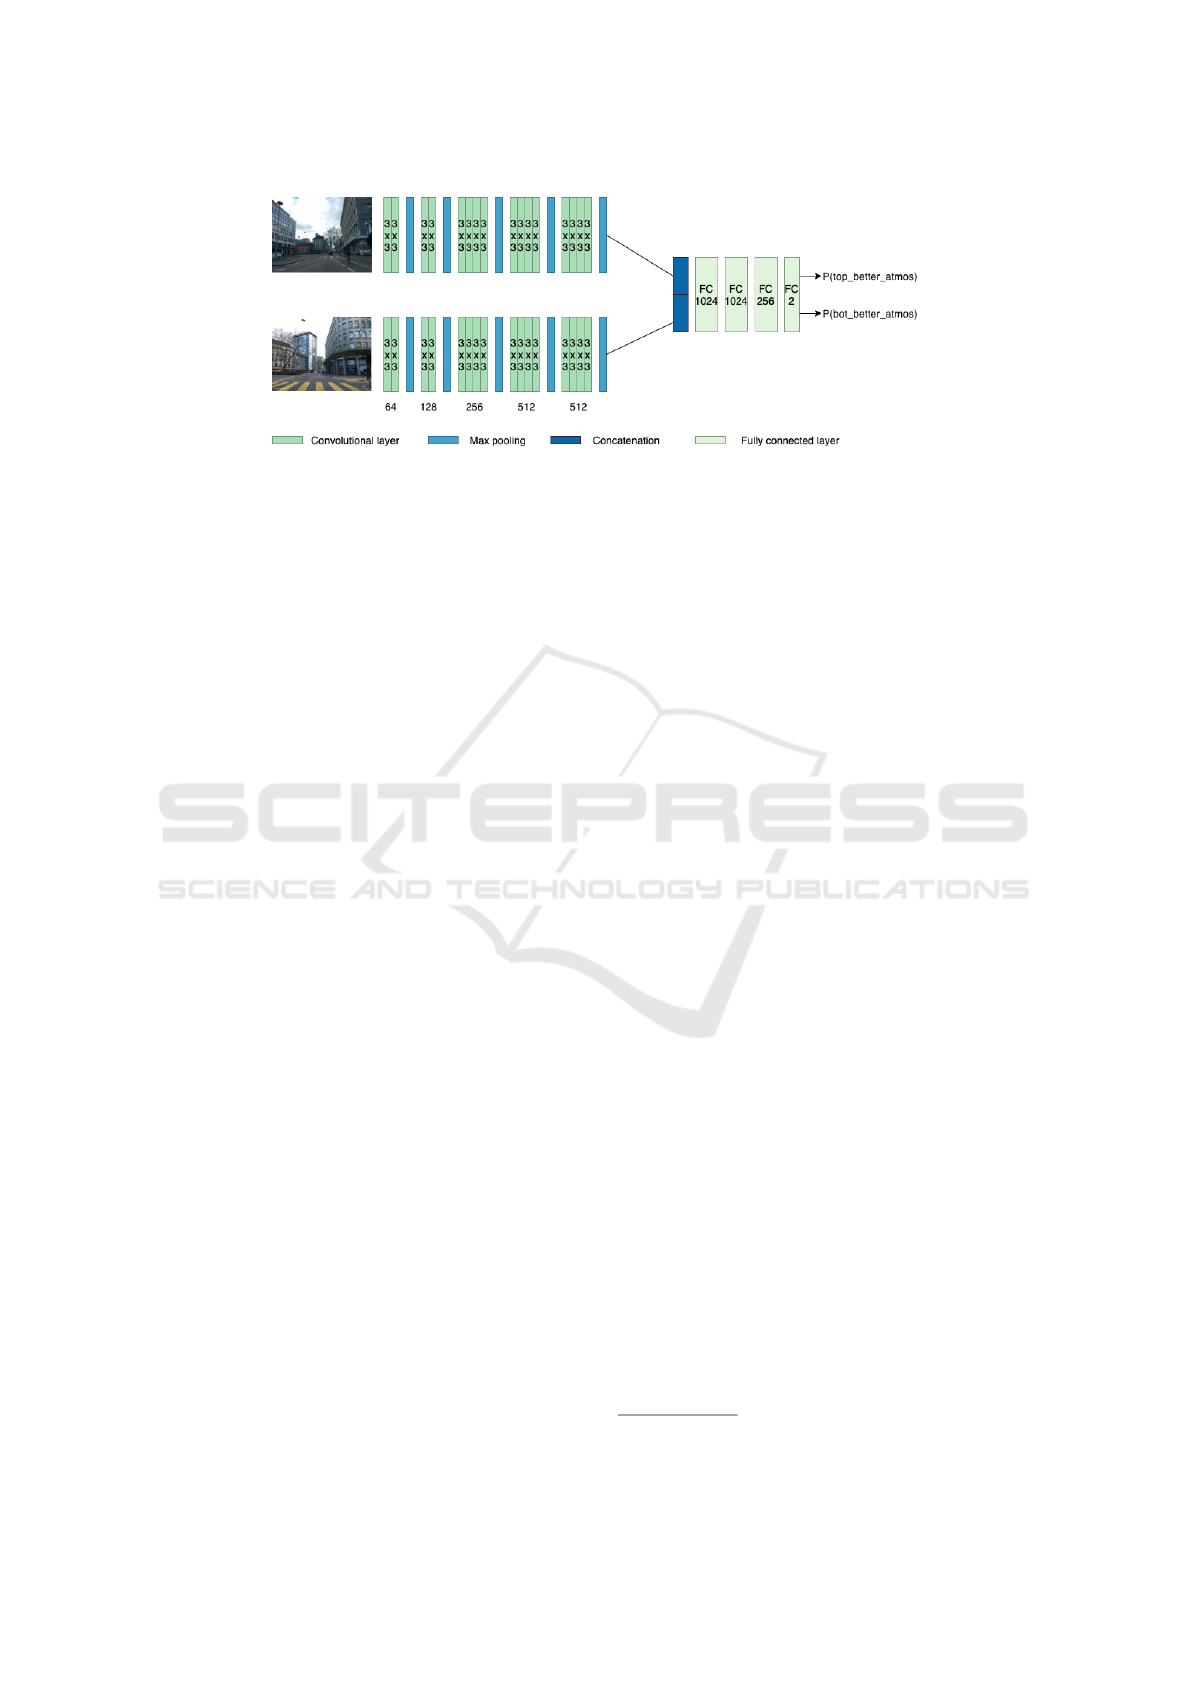
Figure 1: Architecture of the used siamese convolutional network.
end score, id of the image, and coordinates are
provided.
3.4 Visualization
Given the availability of the geographical
coordinates of every picture, it is possible to locate
on a map where they have been taken and thus depict
through colors the score assigned to the atmosphere
perceived in the image taken in that place.
Furthermore, to ease the interpretation of the results,
data aggregation can be performed so it is possible to
have an overview of the perceived atmosphere of a
wider area and not only of a specific point, as well as
to reduce noise in the visualization. Two alternative
data aggregation techniques are explored in this
article: aggregation based on rectangular tessellation,
and aggregation based on fuzzy clustering.
In the aggregation based on rectangular
tessellation, the map is divided into rectangles of
fixed size. All the datapoints spatially belonging to
each rectangle are aggregated and the computed
mean of all their perceived atmosphere scores is used
to give a score to the corresponding rectangle. This
score is used to set the color of the rectangle.
The goal of the aggregation based on fuzzy
clustering is that of providing a heatmap representing
the perceived atmosphere in the whole city area. To
obtain this, a fuzzy clustering algorithm,
fuzzy-c-means (Dunn (1973)), is employed. Clusters
are created based on closeness in position and
associated atmosphere scores of all analyzed points
in a certain city. In the creation of these clusters,
representing similar types of scenarios or situations
that can be found in cities, more importance is given
to the location of points (2 times the atmosphere
score). This choice was made to implicitly encode in
the generated clusters the observation that pictures of
places close to one another are more likely to belong
to the same type of landscape or situation than
pictures with just a similar perceived atmosphere
score. For each of the resulting clusters, its average
score is computed as the mean of the perceived
atmosphere scores of all the data points for which the
membership to that cluster is higher than the
membership to any other cluster. To visualize this
data in the form of a heatmap, points covering the
whole map are generated and initially assumed to
have a neutral perceived atmosphere (TrueSkill score
= 25). Their true perceived atmosphere can then be
estimated by using their proximity to areas with a
known perceived atmosphere. The membership of
the generated points to the obtained clusters is
computed by exploiting their position and the initial
neutral score. Then their true score can be estimated
by computing the average of the scores of the
clusters they belong to, weighted by the membership
to these clusters as follows:
score
p
=
∑
c∈C
µ
c
(p)score
c
With C the set of clusters, score
c
the average score
of cluster c and µ
c
(p) the membership of point p to
the cluster c.
4 RESULTS
The results of the implementation of Streetwise are
presented and discussed in this section.
4.1 Crowdsourcing
In total 3 650 images from 6 different Swiss localities
were retrieved from Mapillary. For the comparison,
the images were paired randomly with the constraint
that all of them were compared a similar number of
times. Moreover, the crowdsourcing took place
between June and October of 2020. Information was
provided on a website
8
and advertisement campaigns
8
https://streetwise.space/
ICEIS 2021 - 23rd International Conference on Enterprise Information Systems
814
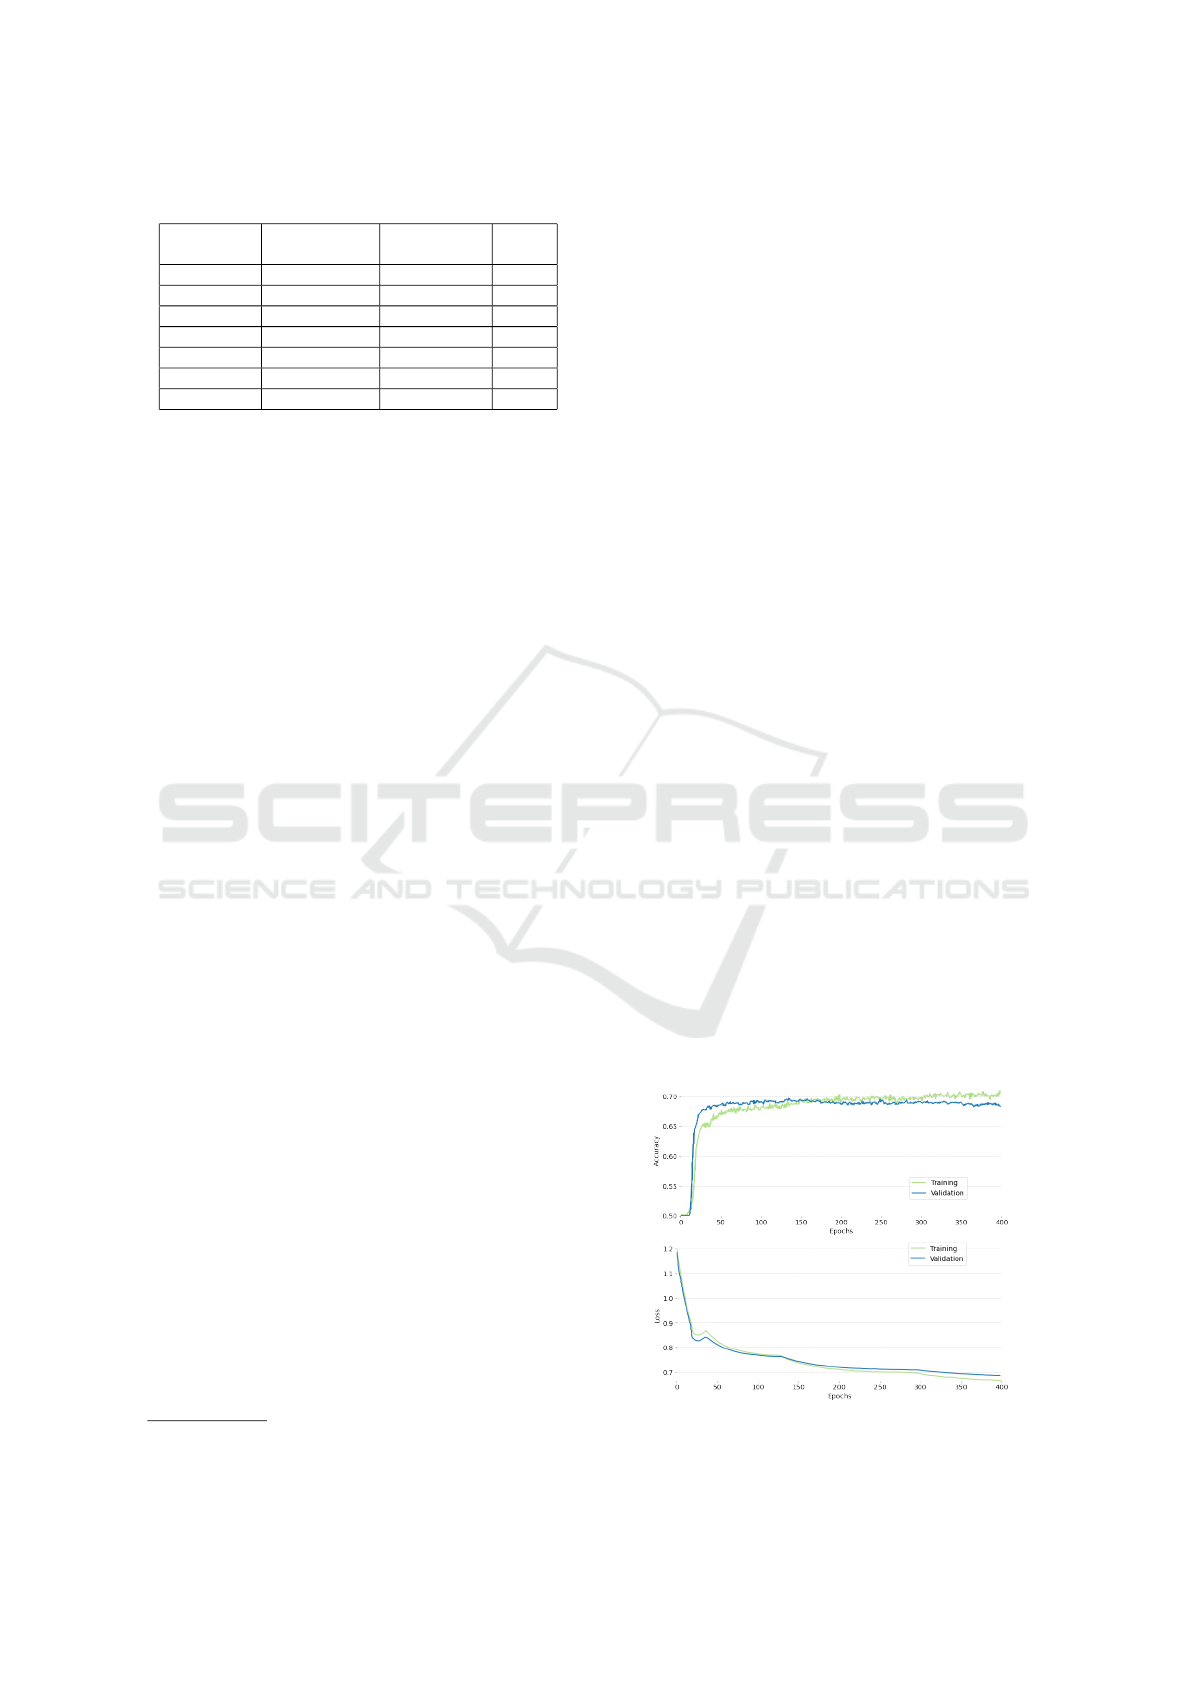
Table 1: Demographics of the participants.
Age range
(years old)
Masculine Part. Feminine Part. Others
12 or younger 6 12 1
13 to 19 73 63 0
20 to 39 423 328 5
40 to 60 355 316 4
61 to 79 88 89 0
80 or older 6 8 0
Not specified 7 1 44
were conducted on social networks, magazines
targeted to elder people, and newsletters of
supporting partners. As part of the campaign, a raffle
of a mobile device among the participants was done.
Every participant was asked to evaluate 10 to 15
image pairs. They had to indicate in which place they
would rather spend some time, by choosing either an
image displayed on the right of the interface or the
one on the left. It was also possible for them to
inform that they could not make a choice (e.g., due to
the images being too hard to evaluate). After the
evaluation process, they were asked for some
demographic data (e.g., age and canton of residence)
however a user didn’t need to provide this
information. Additionally, they were asked if they
would like to evaluate more images, allowing them
to contribute more to the crowdsourcing.
At the end of the crowdsourcing, it was possible
to gather 10 766 evaluations from 1 834 participants.
Details about the number of participants and their
demographic data are presented in Table 1.
Furthermore, since this is an open-source project, the
code of the web application and the scripts used to
retrieve and process the images is freely available on
GitHub
9
.
4.2 Training and Scoring
The results collected by the crowdsourcing campaign
were used to train a siamese convolutional neural
network with the scope to reproduce the behavior of
people in the comparison of the perceived
atmosphere in new image couples. For the training,
transfer learning was applied. Only the last 4 dense
layers of the network were trained using batches of
64 data points with an initial learning rate
lr = 0.0006, reduced by a factor of 2 every time the
validation loss was stagnating for 10 epochs. The
VGG19 layers were frozen for all 400 epochs of the
training phase.
After 400 epochs of training, the model reached
an accuracy of 69.09% and a loss of 0.6853 on the
validation set, using a training set containing 17 225
9
https://github.com/Streetwise
comparisons and a validation set containing 4 306
comparisons. The validation accuracy and loss
curves can be found in Figure 2.
The TrueSkill score for each image in the
validation set was computed thanks to at least 30
pairwise comparisons with other random images
from the same data set, using the trained siamese
ConvNet to assess which image of the pair is the one
most likely to be perceived as having the better
atmosphere. In Figure 3, one can see some examples
of pictures ranked by the TrueSkill score
representing their perceived atmosphere, estimated
with the siamese ConvNet.
4.3 Model Validation
As an evaluation of the performance of the model
when selecting from an image pair the one with a
better-perceived atmosphere with respect to human
performance, an experiment was set. The goal of this
experiment is that of understanding if the 69.09%
accuracy of the model compared to the crowdsourced
data is comparable to the accuracy a single human
would reach in the execution of the same task.
For the experiment, a group of 10 people
evaluated 100 randomly selected image pairs (not
part of the training data) and the same task was
executed by means of the trained siamese ConvNet.
The results obtained by humans could be
compared in couples with one another to see how
much single people agreed with other people’s
assessments, the mean ratio of same answers given
by different people was 60.97% (SD=9.82%), with
the maximum level of agreement of 94% obtained by
a couple, and a minimum of 46%. This data was
compared by the one-on-one comparison of the
results from the ConvNet and those of people, for
which the mean ratio of the same answers given was
Figure 2: Accuracy and loss of the siamese ConvNet on the
training and validation sets with an 80/20 dataset split.
Streetwise: Mapping Citizens’ Perceived Spatial Qualities
815
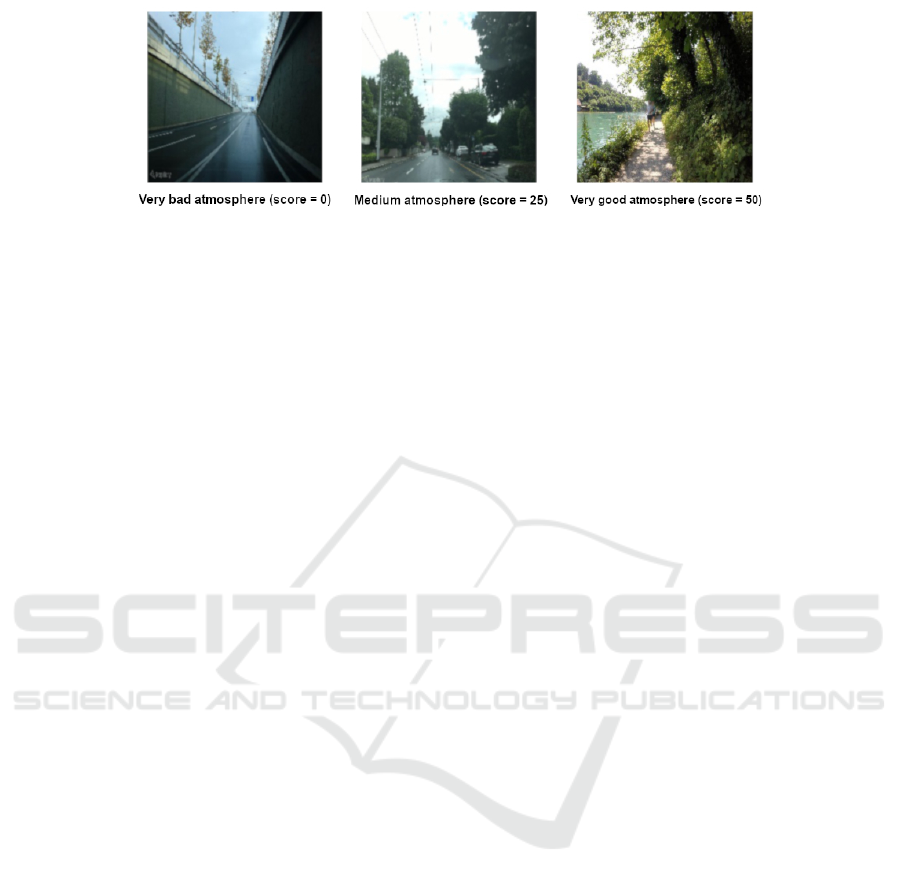
Figure 3: Example of images perceived as having very bad, medium and very good atmosphere, according to their computed
TrueSkill score.
61.00% (SD=6.02%), with the maximum level of
agreement between the model and a person of 69%,
and a minimum of 46%.
Moreover, the results from single humans could
be compared with the average answer (the one which
received the most votes) of all users, except the one
being compared. The mean ratio of the same answers
between single people and the average answer was
68.20% (SD=9.00%), with a maximum of 81% and a
minimum of 56%. The results obtained by the
siamese ConvNet were also compared with the
average answer, obtaining a ratio of the same
answers of 68.00%.
In the light of these results, one can say that
despite the 69.09% accuracy of the siamese ConvNet
on the validation set seems low at first sight, the
developed model performs the comparison of the
perceived atmosphere in two pictures as well as the
average individual. In other words, there is no
significant accuracy difference between employing a
person who compares pictures by hand and using the
trained model.
Erroneous classifications of the model (and of
people) with respect to the average, are given mainly
by a subjectivity factor in the perception of the
atmosphere of a place. This subjectivity factor is
likely to be more moderate in the developed ConvNet
than in humans, as the lower variability in the level
of agreement between the model and individuals
compared to that between pairs of individuals, seems
to suggest. This reduced variability makes the choice
of the ConvNet even more attractive than that of
employing a person for the rating of the perceived
atmosphere of a certain place because it allows
having a better estimate of the accuracy of the final
results.
4.4 Visualization of Results
Given the high density of points (in most of the
selected localities) and to provide to the general
public a more comprehensive overview of the results,
some visualization options were implemented.
The first consisted of displaying dots where the
photos were taken. The color of the dots was assigned
in function of the perceived atmosphere score of the
picture. Figure 4 left shows an example of the map
obtained for the city of Zurich.
The second approach consisted of aggregating the
atmosphere scores using rectangular tessellation,
which gives a lower granularity, but also a less noisy
visualization. Figure 4 center shows an example of
the map obtained with rectangular tessellation
aggregation on the data for the city of Luzern.
The third option consisted of using fuzzy
clustering to estimate a heatmap representing the
perceived atmosphere covering the whole city area
and estimating thus the perceived atmosphere in
areas where data is not available, which could not be
handled by the other two visualization techniques.
Figure 4 right shows an example of the map obtained
with fuzzy clustering aggregation and estimation on
the data for the city of Zug.
The first visualization option has the main
advantage of representing very precisely the data but
is not clearly readable and interpretable because it
contains noise, due to a certain level of subjectivity
in the perception of atmosphere, bad quality of part
of the used image data, and inaccuracies in the
developed comparison neural network. The second
visualization technique allows having a less noisy
output, which can be better interpretable. However,
maps of cities with a sub-optimal street-level
imagery coverage do not give many insights into the
perceived atmosphere of the cities.
The third visualization technique allows showing
natural clusters of places with similar perceived
atmosphere, by still preserving the quality of being
robust to noise in the data. This visualization
technique also provides full coverage of the analyzed
city, which is only an approximation, but one can
argue that because of the relatively fuzzy nature of
the perceived atmosphere, a good estimate is not less
valid than a precise report in this case. This
ICEIS 2021 - 23rd International Conference on Enterprise Information Systems
816

Figure 4: Left: Example of visualization of results using dots representing the atmosphere score in the city of Zurich. Center:
Example of visualization of results aggregated using rectangular tesselation representing the average atmosphere score in
each area in the city of Luzern. Right: Example of visualization of results aggregated using fuzzy clustering representing the
aggregated and estimated atmosphere score in each area in the city of Zug.
visualization technique is a concrete application of
one of the main principles of phenotropics: the fact
of making software “an ever better guesser instead of
a perfect decoder” (Lanier, 2003). In this case, the
fact of trying to fill the gaps in the available data is a
bio-inspired mechanism, which humans tend to
naturally do (Dilks et al., 2009).
5 SUMMARY AND
CONCLUSIONS
The Streetwise research project attempted to create
the first map of perceived spatial quality in terms of
atmosphere of Switzerland. A four-step method was
defined and implemented: i) crowdsourcing, ii)
training, iii) scoring, and iv) visualization.
The crowdsourcing stage had the goal of
gathering people’s perceptions regarding the
atmosphere of a place. Between June and October of
2020, through a web application, users were asked to
answer the question ”Where would you rather stay?”
by selecting one image (left or right) over a pair.
10 766 evaluations from 1 834 users were gathered.
With the collected data, it was possible to train a
neural network, capable of performing the same task
as the humans with an accuracy of 69.08%. The
model enabled the extension of the crowdsourced
dataset and have more comparisons per image.
Afterward, the scoring process took place and
consisted of assigning a perceived atmosphere score
to images that were not used in the training. Lastly,
with the results of the scoring stage, it was possible
to implement a map-based visualization that eases
the identification of zones within a locality where
people would rather spend some time (very good
perceived atmosphere) and also where they would
not like to stay (very bad perceived atmosphere).
Results of the evaluation of the machine learning
model suggest that it performs as well as having an
individual human doing the same task. Additionally,
the model has some clear advantages, especially in
terms of time consumption. For example, for the
scoring of the city of Zurich, approximately 6 million
image comparisons have been executed on a
computer running the model in approximately 8
hours, while more than five months have been used
to collect from people only 25 763 comparisons
during the presented crowdsourcing phase, which
was combined with another campaign.
The results achieved within the Streetwise project
are a valuable source of information that can be
leveraged in the development of urban and touristic
projects for instance. It has been implemented with
open source software and open source data.
Moreover, the implemented neural network
architecture could be further applied in other
contexts. Besides atmosphere, it is feasible too to
identify features from images that make a place be
perceived as safer, more beautiful, or more unique
for example.
Future efforts will be directed towards
implementing explainable artificial techniques to
better understand the features that make a place to be
chosen as having a good atmosphere, and to provide
as well an explanation about the computed scores to
the users. Finding more appropriate ways of
delivering results may be addressed in future work,
one option being linguistic summaries proposed by
Hudec et al. (2020). Concepts such as perceived
atmosphere are of a fuzzy nature, and thus, more
natural ways to aggregate and visualize the data are
to be implemented to represent reality in a better
way. Methods based on fuzzy logic, computing with
Streetwise: Mapping Citizens’ Perceived Spatial Qualities
817

words, and linguistic summarization should provide
the mean to achieve the aforementioned objective.
ACKNOWLEDGEMENT
The authors would like to thank the Metropolitanraum
Z
¨
urich association and cividi GmbH for their support
in the development of this project.
REFERENCES
Albawi, S., Mohammed, T. A., and Al-Zawi, S. (2017).
Understanding of a convolutional neural network. In
2017 International Conference on Engineering and
Technology (ICET), pages 1–6. IEEE.
Barbier, G., Zafarani, R., Gao, H., Fung, G., and Liu,
H. (2012). Maximizing benefits from crowdsourced
data. Computational and Mathematical Organization
Theory, 18(3):257–279.
Chopra, S., Hadsell, R., and LeCun, Y. (2005). Learning
a similarity metric discriminatively, with application
to face verification. In 2005 IEEE Computer
Society Conference on Computer Vision and Pattern
Recognition (CVPR’05), volume 1, pages 539–546.
IEEE.
Deng, J., Dong, W., Socher, R., Li, L.-J., Li, K., and Fei-Fei,
L. (2009). Imagenet: A large-scale hierarchical image
database. In 2009 IEEE conference on computer
vision and pattern recognition, pages 248–255. Ieee.
Dilks, D. D., Baker, C. I., Liu, Y., and Kanwisher, N.
(2009). “referred visual sensations”: Rapid perceptual
elongation after visual cortical deprivation. Journal of
Neuroscience, 29(28):8960–8964.
Dubey, A., Naik, N., Parikh, D., Raskar, R., and
Hidalgo, C. A. (2016). Deep learning the city:
Quantifying urban perception at a global scale. In
European conference on computer vision, pages 196–
212. Springer.
Dunn, J. C. (1973). A fuzzy relative of the isodata process
and its use in detecting compact well-separated
clusters. Journal of Cybernetics, 3(3):32–57.
Estell
´
es-Arolas, E. and Gonz
´
alez-Ladr
´
on-De-Guevara, F.
(2012). Towards an integrated crowdsourcing
definition. Journal of Information science, 38(2):189–
200.
Gau, J. M. and Pratt, T. C. (2010). Revisiting broken
windows theory: Examining the sources of the
discriminant validity of perceived disorder and crime.
Journal of criminal justice, 38(4):758–766.
Goldhagen, S. W. and Gallo, A. (2017). Welcome to your
world: How the built environment shapes our lives.
Harper New York.
Herbrich, R., Minka, T., and Graepel, T. (2007).
Trueskill(tm): A bayesian skill rating system. In
Advances in Neural Information Processing Systems
20, pages 569–576. MIT Press.
Hudec, M., Vu
ˇ
ceti
´
c, M., and
ˇ
Cerm
´
akov
´
a, I. (2020). The
synergy of linguistic summaries, fuzzy functional
dependencies and land coverings for augmenting
informativeness in smart cities. In 2020 28th
Telecommunications Forum (TELFOR), pages 1–4.
IEEE.
Ilic, L., Sawada, M., and Zarzelli, A. (2019). Deep
mapping gentrification in a large canadian city using
deep learning and google street view. PLOS ONE,
14(3):1–21.
Lanier, J. (2003). Why gordian software has convinced me
to believe in the reality of cats and apples. https://
www.edge.org. Visited on Feb. 2021.
LeCun, Y., Bengio, Y., and Hinton, G. (2015). Deep
learning. nature, 521(7553):436–444.
Liu, L., Silva, E. A., Wu, C., and Wang, H. (2017). A
machine learning-based method for the large-scale
evaluation of the qualities of the urban environment.
Computers, Environment and Urban Systems, 65:113–
125.
Lynch, K. (1960). The image of the city, volume 11. MIT
press.
O’Shea, K. and Nash, R. (2015). An introduction
to convolutional neural networks. arXiv preprint
arXiv:1511.08458.
Salesses, P., Schechtner, K., and Hidalgo, C. A. (2013).
The collaborative image of the city: mapping
the inequality of urban perception. PloS one,
8(7):e68400.
Seresinhe, C. I., Preis, T., and Moat, H. S. (2017). Using
deep learning to quantify the beauty of outdoor places.
Royal Society open science, 4(7):170170.
Simonyan, K. and Zisserman, A. (2014). Very
deep convolutional networks for large-scale image
recognition. arXiv preprint arXiv:1409.1556.
Srivastava, N., Hinton, G., Krizhevsky, A., Sutskever, I.,
and Salakhutdinov, R. (2014). Dropout: a simple
way to prevent neural networks from overfitting. The
journal of machine learning research, 15(1):1929–
1958.
Wang, S.-C. (2003). Artificial Neural Network, pages 81–
100. Springer US, Boston, MA.
Zhang, R., Isola, P., Efros, A. A., Shechtman, E., and Wang,
O. (2018). The unreasonable effectiveness of deep
features as a perceptual metric. In Proceedings of
the IEEE conference on computer vision and pattern
recognition, pages 586–595.
ICEIS 2021 - 23rd International Conference on Enterprise Information Systems
818
