
Towards a Rule-based Approach for Estimating the Situation Difficulty
in Driving Scenarios
Maximilian Schukraft
1
, Susanne Rothermel
2
, Juergen Luettin
2
and Lavdim Halilaj
2
1
Robert Bosch Cross-Domain Computing, Renningen, Germany
2
Robert Bosch Corporate Research, Renningen, Germany
Keywords:
Context-aware Difficulty Estimation, Difficulty in Driving Scenarios, Context-aware,
Human-Machine-Interaction.
Abstract:
The task of safe driving poses a huge challenge for drivers in day to day driving situations. Many times, this
task can be very difficult, e.g., due to dense traffic, bad weather conditions, or a risky driving maneuver, and
thus demand high concentration of the driver. The difficulty level escalates by the ever-increasing infotainment
offers inside vehicles or distractions caused by occupants thus making substantial contribution to the driver
distraction. This often results in dangerous driving situations which could be avoided by Advanced Driver
Assistance Systems or highly automated driving systems taking the situation difficulty into account. E.g., an
incoming phone call is postponed during a difficult situation. However, current systems do not consider all
factors that influence the difficulty of a given situation. In this paper, we present an approach for estimating
the difficulty of a driving situation by combining a number of different factors, such as environmental, inside-
vehicle, driver state and personal characteristics, respectively. Our approach follows a rule-based paradigm
to make the difficulty estimation reproducible and adjustable to current traffic rules. It is based on a generic
and modularized architecture to allow integration and abstraction from heterogeneous data sources. Further, a
feedback is provided to the driver or system to explain the contribution of the various factors to the difficulty
status. Finally, we demonstrate the capability of the proposed approach with concrete examples, where we
estimate the difficulty in various driving scenarios and for different drivers.
1 INTRODUCTION
Vehicles with Advanced Driver Assistance Systems
(ADAS) aim to take some work-load of the driver to
improve comfort and efficiency and to enhance driv-
ing safety (Bengler et al., 2014). More advanced
systems, so-called highly automated driving (HAD)
systems, drive almost autonomously but may require
the driver to take-over driving in situations where
the system is not capable to handle the situation
safely (Bazilinskyy et al., 2018). However, ensuring
safety is one of the biggest challenges that remain in
both applications. To drive safely can often be very
difficult, e.g., due to dense traffic, bad weather condi-
tions, or a risky driving maneuver, and thus demand
high concentration of the driver. It requires an un-
derstanding of the current driving situation which in-
cludes perceiving the current traffic situation, com-
prehending their meaning and predicting what could
happen in the near future. Furthermore, it includes the
driver’s capability and physical state, her moment-to-
moment knowledge and understanding of the driving
situation as well as possible distractions like conver-
sation with occupants, using the infotainment system
or smartphone. To ensure safety, a system should
consider a number of different factors that influence
safety. This includes the difficulty level of the driving
situation, environmental condition, driver capability
and current driver state like distraction or sleepiness.
Therefore, these systems should be aware of particu-
larities of driving situations and exploit the informa-
tion from various levels, such as perception, decision
making and action (R
¨
ockl et al., 2007).
In this paper, we present an approach for estimat-
ing the difficulty of a driving situation by combining
the environmental factors (e.g., weather and road con-
ditions, traffic or driving maneuver) and the inside-
vehicle factors (e.g., occupant behavior or loudness).
In addition, the driver state (e.g., drowsiness or at-
tentiveness), as well as the personal characteristics
of the driver (e.g. experience, preferences, abilities)
are considered. Since reproducibility and explainabil-
720
Schukraft, M., Rothermel, S., Luettin, J. and Halilaj, L.
Towards a Rule-based Approach for Estimating the Situation Difficulty in Driving Scenarios.
DOI: 10.5220/0010527807200730
In Proceedings of the 7th International Conference on Vehicle Technology and Intelligent Transport Systems (VEHITS 2021), pages 720-730
ISBN: 978-989-758-513-5
Copyright
c
2021 by SCITEPRESS – Science and Technology Publications, Lda. All rights reserved

ity are crucial for a safety-relevant system, we based
our approach on a rule-based paradigm that conforms
to traffic rules, traffic standards and that can be eas-
ily verified by humans. The approach is based on
a generic architecture comprising a number of com-
ponents for allowing the integration and abstraction
from heterogeneous data sources. Thus, a feedback
can be provided to the driver or system to explain the
impact of the various factors to the difficulty status.
We demonstrate the capability of our approach with
concrete examples estimating the difficulty in various
driving scenarios and for different drivers. As a result,
considering the human factors during difficulty esti-
mation will have an impact on increasing the safety
aspects of ADAS and HAD systems.
The remainder of this paper is structured as fol-
lows: A motivating scenario is described in Section 2.
Related work is outlined in Section 3. Section 4
presents a detailed description of our approach. The
architecture and its main components as well as the
implementation details are shown in Section 5. Sec-
tion 6 demonstrates the application of the approach
with a concrete example. In Section 7, we conclude
the paper and give an outlook of future directions and
possible extensions of this work.
2 MOTIVATION EXAMPLE
Estimating the difficulty status of a driving situation
can make an important contribution to increase safety
and comfort for the driver. As for our motivation ex-
amples, we illustrate the following scenarios, where
difficulty estimation including various personal char-
acteristics is of paramount importance:
• Comfort: Anna, a novice driver, is on her way to
a customer meeting. It is raining heavily and this
makes her feel very uncomfortable. Her adaptive
cruise control (ACC) system detects a difficult sit-
uation and increases the distance to the vehicle
ahead. Sophie is an experienced driver, she is
driving on the highway immediately behind Anna.
She is not having any difficulties with the heavy
rain. The system estimates the situation as less
difficult, so her ACC system chooses the shortest
safe distance to Anna giving her the possibility to
eventually overtake.
• Managing Secondary Tasks: Anna is driving on
the highway, it is drizzling, the traffic density is
on an acceptable level, and she listens to her fa-
vorite music. Due to a small construction site, the
lane is very narrow which makes her feeling very
uncomfortable. In this moment, a call from her
friend is coming in. The system detects a difficult
situation and holds back the information about the
call and displays it when the situation is relaxed
again.
• Misuse Detection: Anna is using an HAD system
that supports hands-free mode. Using driver mon-
itoring camera signals, the systems recognizes
that she is using her mobile phone for a longer
time and not following the traffic situation. This
can lead to a hazardous situation and the system
informs Anna to focus on steering her car.
3 RELATED WORK
Over years, many approaches that deal with specific
topics concerning difficult driving situations coming
from outside the vehicle and driver state have been
presented. Such approaches typically are focusing on
measuring the difficulty level for a particular specific
factor, i.e. environmental related factors.
Outside the Vehicle. (Kita, 2000) proposed an ap-
proach for personalizing the level-of-service (LOS)
for roads by including the perception of the driver for
the driving environment. The effects of weather con-
ditions, light conditions, and road lighting on vehi-
cle speed are analyzed by (J
¨
agerbrand and Sj
¨
obergh,
2016). (Heinzler et al., 2019) present an approach for
detecting and classifying rain and fog using lidar sen-
sors. They do not provide a method for calculating
the difficulty but emphasize the contribution of these
factors to the situation difficulty. (Park et al., 2018)
analyzed the situation complexity resulting from mix-
ing of autonomous and manually driven vehicles us-
ing simulation. They calculate the situation com-
plexity using vehicular data communication via V2X
(Vehicle-to-X). However, they only consider driving
situations and maneuvers for a mix of autonomous
and manually driven vehicles.
Driver State. In (Paxion et al., 2015) and (Paxion
et al., 2014), the authors examine the influence of situ-
ation complexity and driving experience on a driver’s
subjective workload and driving performance. (Brau-
nagel et al., 2017) present a method for detecting sec-
ondary tasks of a driver, e.g., reading, watching a
movie, or being idle when driving. This method could
be integrated in our approach for determining the
driver state w.r.t. attentiveness. A model to represent
driver behavior and situation awareness under haz-
ardous conditions is described in (Kaber et al., 2012).
(Bier et al., 2019) discuss the risks of monotony re-
lated fatigue while driving. (Martinez et al., 2018)
Towards a Rule-based Approach for Estimating the Situation Difficulty in Driving Scenarios
721

present a survey of approaches dealing with the recog-
nition and classification of driving styles. The au-
thors discuss rule-based and data-driven algorithms,
and propose to combine algorithms, depending on the
application. Furthermore, they summarize input sig-
nals that can be used for driving style recognition.
Combining Multiple Factors. (Fazio et al., 2016)
discuss a technique for driving style recognition us-
ing fuzzy logic, considering environmental context,
such as road types (e.g., urban, highway, or city), and
time of day (e.g., morning, evening, or noon). It can
be used to provide classifications of dimensions, such
as the presented driving style recognition. Another
method targeting the estimation of the difficulty level
in a given situation is developed in the aircraft do-
main (Wang et al., 2018). Its main objective is mod-
eling the complexity of air traffic situations with a dy-
namic weighted network approach. Considering the
aircraft, way-points, and airways as nodes, as well as
the relationships among these nodes as edges, a dy-
namic weighted network is constructed. Air traffic sit-
uation complexity is defined as the sum of the weights
of all edges in the network. Our work for situation
difficulty estimation is inspired by this approach.
To the best of our knowledge, there is no approach
in the automotive domain that estimates the difficulty
status of a driving situation, where all important fac-
tors in- and outside the vehicle, as well as the current
state and characteristics of the driver are considered.
4 APPROACH
For safety reasons it is mandatory to achieve re-
quired and reproducible results and to quickly adapt
to country-specific or even changing traffic rules.
Therefore, we conceive an approach following a rule-
based paradigm to comply with the above mentioned
aspects. As a result, it is possible to deliver the reason
for the necessary adaptions to the driver by commu-
nicating the factors mainly contributing to the driv-
ing situation difficulty status (DSDS). In order to esti-
mate the DSDS, our approach combines various fac-
tors from the vehicle environment (e.g., weather and
road conditions, traffic or driving maneuver), the in-
side of the vehicle (e.g., occupant behavior or loud-
ness), the driver state (e.g., drowsiness, posture, or
eye gaze), and personal characteristics of the driver
(e.g. driving experience, preferences, abilities). In the
following, we call such factors difficulty dimensions,
or dimensions for short.
4.1 Difficulty Dimensions
In this section, we describe each category of dimen-
sions relevant for estimating the DSDS in more detail.
The DSDS is influenced by a combination of various
difficulty dimensions, each describing a specific part
of the driver state and vehicle context:
Outside-vehicle Context:
Groups the dimensions related to the environment
outside the vehicle, such as weather condition,
road condition, traffic situation, other traffic par-
ticipants, or driving maneuver.
Inside-vehicle Context:
Comprised of dimensions originating from the
cabin and its passengers, such as the loudness in
the car, unsuitable cabin temperature, or fighting
children on the back seats.
Driver State:
Includes the dimensions describing the current
state of the driver, such as attentiveness, fatigue,
drowsiness, or seating position.
A dimension is characterized by three levels: 1) the
observable difficulty level; 2) the personal ability
level; and 3) the personal difficulty level. These lev-
els are further classified into dimension-specific diffi-
culty intervals.
Observable Difficulty Level:
The observable difficulty level of a given dimen-
sion describes the degree of difficulty that is mea-
sured, e.q., by sensors or video cameras, or calcu-
lated by services such as drowsiness detection.
Personal Ability Level:
The personal ability level is used to personalize
the DSDS estimation. It depends on rather static
driver characteristics, such as driving experience
or driver type. E.g., a novice driver can handle
only light rain, whereas a more experienced driver
can easily handle even the heavy rain. The values
of this level can be obtained e.g., by asking the
driver for a self-assessment, using common-sense
information, or analyzing the driving behavior.
Personal Difficulty Level:
Describes how difficult a dimension is perceived
by a driver. It is estimated from the measured ob-
servable difficulty level, the personal ability of the
driver to handle the situation caused by the spe-
cific dimension, and additional factors relevant to
the overall situation.
4.2 Estimating the DSDS
Our DSDS estimation is based on the principles pre-
sented by (Wang et al., 2018). We consider the dif-
VEHITS 2021 - 7th International Conference on Vehicle Technology and Intelligent Transport Systems
722

ficulty status of the situation as a vector of difficulty
dimensions, where each value describes the personal
difficulty level of a dimension. The process of the
DSDS estimation comprises three consecutive steps:
1. Compute the personal difficulty levels of each di-
mension;
2. Normalize the personal difficulty levels of each
dimension; and
3. Compute the DSDS based on the obtained values.
4.2.1 Estimating the Personal Difficulty Level
The personal difficulty level for a specific dimension
is estimated based on the dimension’s observable dif-
ficulty level and personal ability level. While the ob-
servable difficulty level is an objective measure, the
personal ability is a subjective attribute and should be
adapted to the overall situation, taking into account a
maximum value for the personal ability level and the
number of dimensions.
Including the Maximum Allowed Personal Ability
Level in the Estimation. The maximum personal
ability level should only be a fraction of the maxi-
mum observable difficulty level, depending on a given
weight. This restriction is to prevent the user from be-
ing too self-confident in assessing her abilities, since
it is unlikely that a driver can easily handle extremely
difficult situations.
Let i be the index for dimension i, p
basic
i
the ba-
sic personal ability level, e.g., specified by the driver.
Let e
max
i
be the maximum observable difficulty level,
and w
maxAbility
i
≥ 1 a weight for defining the maxi-
mum personal ability level. Then the maximum al-
lowed personal ability level p
max
i
is calculated using
the equation:
p
max
i
= min(p
basic
i
,
e
max
i
w
maxAbility
i
) (1)
Including the Number of Dimensions in the
Estimation. Depending on the driver experience
and her ability to handle a particular situation, the per-
sonal ability of a specific dimension decreases with
the number of dimensions and thus increases the per-
ceived difficulty. For instance, if it is dark and heavy
rain, the situation is mostly perceived as more difficult
than if it would be only dark without rain.
The higher the number n of difficulty dimensions,
the lower the personal ability level for a single dimen-
sion should be considered. This is expressed by the
weight factor w
experience
i
≥ 0. For a very experienced
driver, this must not necessarily be the case, which
can be defined by setting the weight to w
experience
i
= 0.
The personal ability level p
i
is finally adapted to the
number of dimensions using the equation:
p
i
=
p
max
i
n
w
experience
i
(2)
Estimate Personal Difficulty Level of each
Individual Dimension. The personal difficulty
level of a dimension is the difference between the
observable difficulty level and the adapted personal
ability level.
Let e
i
(t) be the observable difficulty level of di-
mension i at time t, and p
i
, the adapted personal abil-
ity level calculated from equation 2. Then the per-
sonal difficulty level d
i
(t) of dimension i at time t is
estimated using equation:
d
i
(t) = max(0, (e
i
(t) − p
i
)) (3)
4.2.2 Normalizing the Personal Difficulty Level
The dimensions can have different maximum per-
sonal difficulty levels, see also section 4.1. In order
to obtain comparable values for all dimensions, we
normalize these levels in the interval [0, 1].
Let min
i
and max
i
be the minimum and maximum
values, respectively, of the personal difficulty level of
dimension i. Then the personal difficulty levels for
given dimensions are normalized to [0, 1] using fea-
ture scaling provided in equation:
d
i
(t) →
d
i
(t) − min
i
max
i
− min
i
(4)
4.2.3 Estimating DSDS
Let
−→
D (t) be the difficulty vector for time t:
−→
D (t) = (d
1
(t), d
2
(t), . . . , d
n
(t)) (5)
The DSDS at time t is the L2-norm of the diffi-
culty vector and estimated using equation:
DSDS(t) = ||
−→
D (t)|| =
q
(d
1
(t))
2
+ . . . + (d
n
(t))
2
(6)
4.3 Algorithm
In Algorithm 1, we show the procedure and the inter-
mediate steps for estimating the DSDS. This proce-
dure is repeated each time, when the observable diffi-
culty level of a dimension is changed.
Towards a Rule-based Approach for Estimating the Situation Difficulty in Driving Scenarios
723
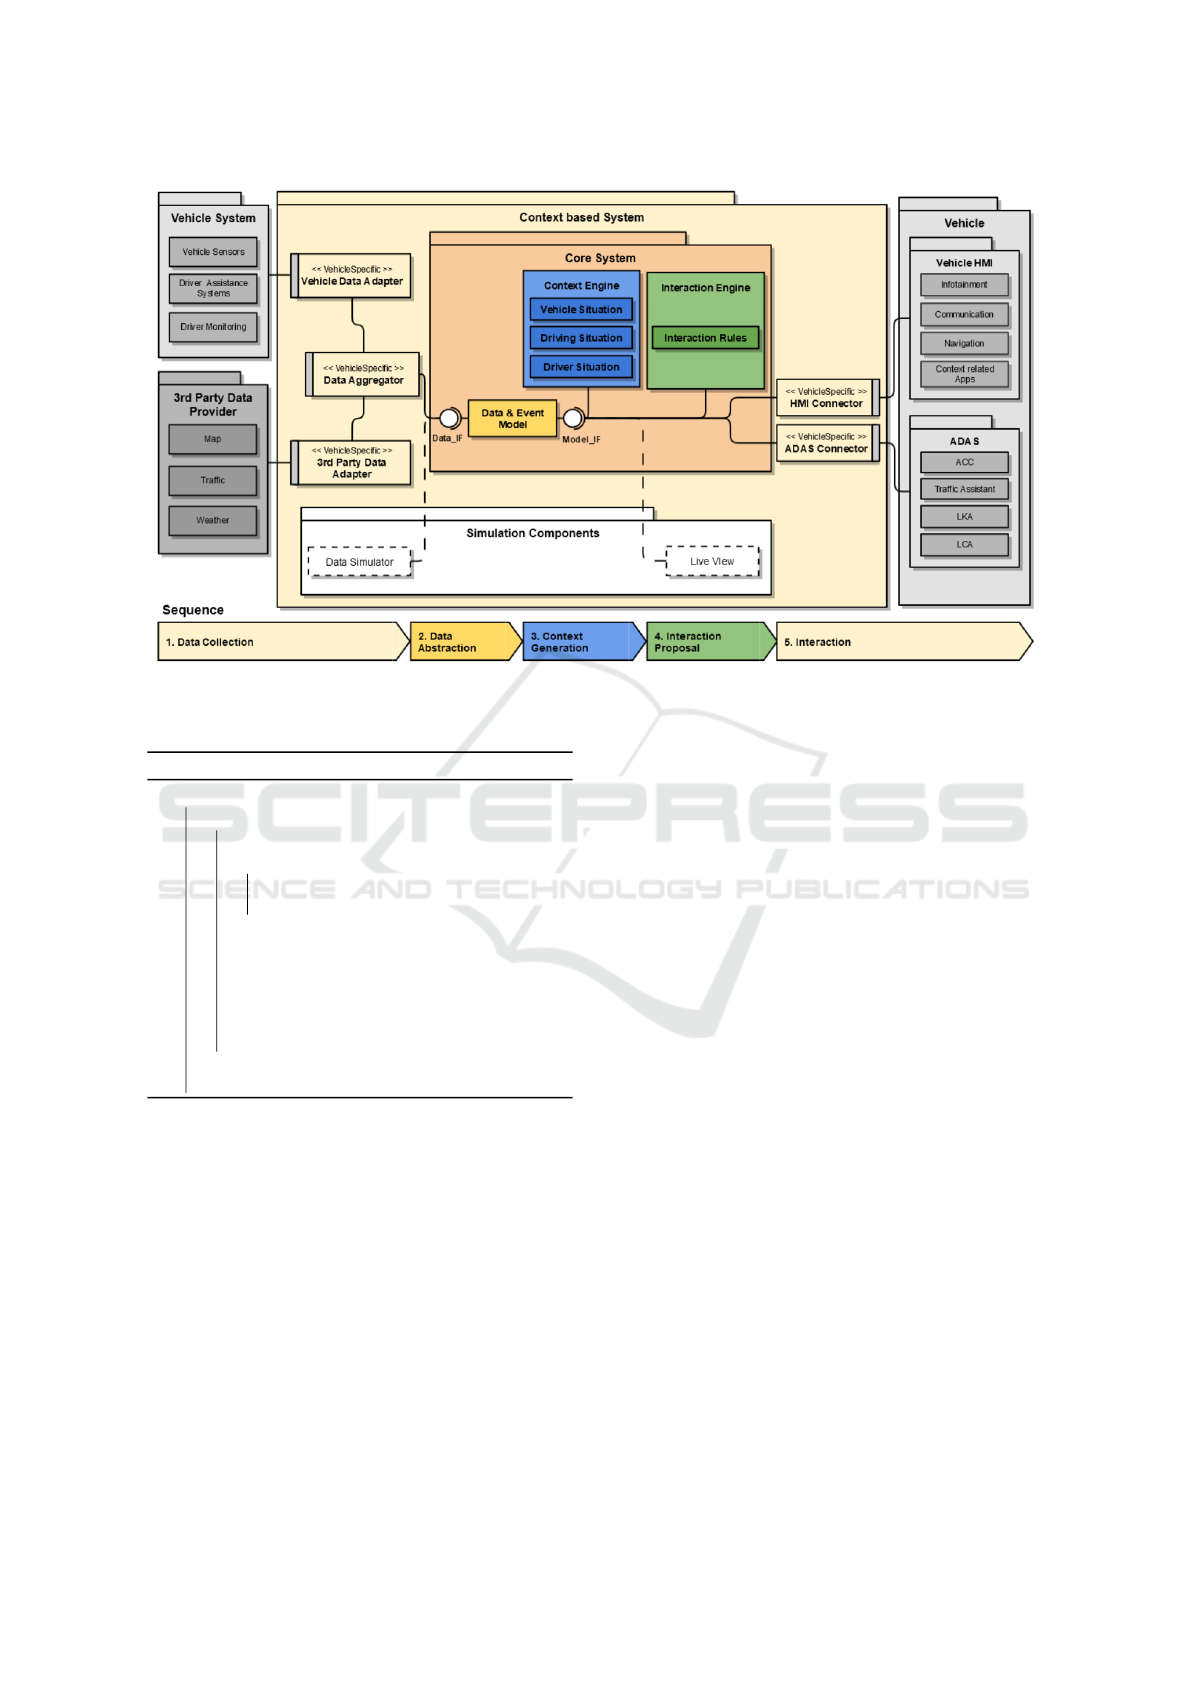
Figure 1: General Architecture. It is comprised of five main steps: 1) Data Collection; 2) Data Abstraction; 3) Context
Generation; 4) Interaction Proposal; and 5) Interaction. In each step, a number of components connected to each other
perform dedicated tasks.
Algorithm 1: Estimating the DSDS.
estimateDSDS (dimensions[])
foreach dimension do
if dimension’s abilityLevel conditions
changed then
adapt ability Level according to
eq. 1 and 2;
end
estimate dimension’s personal
difficulty level according to eq. 3;
Normalize dimension’s personal
difficulty level according to eq. 4;
Estimate dsds according to eq. 6;
end
return dsds
5 ARCHITECTURE AND
IMPLEMENTATION
The architecture of our approach, illustrated in Fig-
ure 1, follows generic and modularized principles to
allow integration from heterogeneous data sources
and data abstraction. This results in a service based,
decoupled and extendable structure that can be used
for realizing multiple different use cases. It consists
of five consecutive steps: 1) Data Collection; 2) Data
Abstraction; 3) Context Generation; 4) Interaction
Proposal; and 5) Interaction.
Data Collection. Different data providers such as
vehicle systems (e.g. sensors, ADAS, driver monitor-
ing) or other 3rd party data sources (e.g. maps, traffic,
weather) can be connected to the context based system
via adapters. This way, only the adapter modules have
to be adjusted for each type of vehicle or for including
a new type of data source. The data aggregator com-
ponent converts the vehicle-specific or source-specific
data into a well-defined, common data structure, de-
fined by the data and event model. It can be used to
combine different low level data to a required infor-
mation item (e.g. speed, rain level), or simply adapt
the values to fulfill the required unit definition (e.g.
convert km/h to m/s). As a result, the context based
system is decoupled from specific data sources.
Data Abstraction. The data and event model de-
fines a common data structure for the core system and
acts as a publish subscribe broker. It provides a uni-
fied data and model interface where a number of dif-
ferent components can be integrated. The data inter-
face serves as an interface to retrieve new data from
the data sources. The model interface is considered
as the interface where different components can sub-
scribe to or publish new content to the data and event
model. An additional data access component can be
included to regulate which component is allowed to
subscribe to certain information or to publish certain
information to the data and event model.
VEHITS 2021 - 7th International Conference on Vehicle Technology and Intelligent Transport Systems
724

Context Generation. The context engine consists
of one or multiple services that subscribe to the model
interface and processes data in order to publish en-
riched context information back to the data model.
This can for example be the estimation of the driving
situation difficulty presented in this paper.
Interaction Proposal. The interaction engine may
include one or multiple services that subscribe to the
aggregated context information and define interaction
proposals based on the context (e.g., a proposal to
postpone an incoming call at a difficult situation).
Interaction. The HMI and ADAS connectors
are vehicle-specific components that act as data
abstraction layer and map the interaction proposal
to a data format supported by the vehicle. This way
our context based system can be used for different
vehicles by only adapting the HMI and ADAS
Connector.
Additional components can be integrated in order
to perform specific tasks related to the type of vehi-
cle or more generic investigations about information
flow among components. For instance, a simulation
component can be used to simulate data, gain insights,
or demonstrate the context based system without the
need to be connected to a vehicle.
5.1 Implementation
We developed a prototype to estimate the DSDS, fo-
cusing on exploring different configurations of the
context and visualizing the impact of these configu-
rations. For this reason, a simplified data and event
model, the context engine, and the simulation com-
ponents are used. Furthermore, a web socket server
is established to enable the communication between
these components. As a result, it is possible to deploy
the different components on different devices. E.g.,
deploying the components on different devices allows
us to estimate the DSDS on one device and use an-
other device, such as a tablet, to simulate the input
data and display the results. The communication via
web sockets is also used to update the estimation of
the DSDS and to forward the results in order to re-
trieve the displayed values in the respective chart.
The prototype is implemented as a NodeJS web-
based solution using version 13.8.0, and the follow-
ing libraries: Express v4.17.1, WebSocket v6.14.5,
and HTML5. For visualization of the diagrams, we
used Chart.js v2.9.0 and Chartjs-gauge v0.2.0. The
estimation of the driving situation difficulty is imple-
mented via Typescript. A number of web-based forms
are developed to enable configuration of different sce-
narios. For example, the SimulationConfig is a form
for simulating input data, as well as changing the per-
sonal ability of a driver. Other forms contain charts
to display the results in an explainable way and gain
insights into the driving situation difficulty estima-
tion. Some examples of the gauge charts and the radar
charts are displayed in Figure 2. The gauge chart
displays the result of the DSDS estimation, where a
value of 1 or higher (dark red area) indicate that the
highest amount of concentration is required from the
driver and no disturbance like secondary tasks should
be performed. The radar chart visualizes the observ-
able difficulty level, the personal ability level and the
resulting personal difficulty level for each dimension.
6 APPLICATION
We applied our approach presented above to estimate
driving situation difficulty status as a basic require-
ment to enhance vehicle systems, such as adaptive
HMI systems, ADAS, or HAD systems.. An adaptive
HMI system helps the driver in two ways:
• Visualization: by adapting the content to be dis-
played according the difficulty of the current driv-
ing situation. For instance, the new content is re-
duced to the absolute minimum during a difficult
driving situation. Additional content, such as mu-
sic playlists, will be displayed in a less difficult
driving situation.
• Interaction: adapting the interaction between
driver and vehicle w.r.t. the situation difficulty.
For example, to reduce the distraction of the
driver, the notification for an incoming call is
postponed in a difficult driving situation. If the
situation is less difficult again, the missed phone
call and a proposal to call back is communicated.
An ADAS can increase the comfort and safety for
the driver. We chose: 1) the adaptive cruise control
(ACC); and 2) the misuse detection as example appli-
cations for our approach. First, an ACC automates the
longitudinal control of the vehicle, while the driver is
still in charge and has to supervise the situation. For
example, in a driving situation with a high personal
difficulty level, such as heavy rain, the minimal dis-
tance to the vehicle in front is enlarged. Second, if the
driver is not focused on the traffic ahead, a misuse de-
tection system warns the driver earlier in difficult sit-
uations. For instance, if the driver is turning his head
to the rear or scrolling through a playlist, depending
on the situation difficulty, the system alerts the driver
to turn the attention back to the driving situation.
Towards a Rule-based Approach for Estimating the Situation Difficulty in Driving Scenarios
725

Table 1: Example dimensions and observable difficulty
classification.
Dimension Classification Explanation
Rain level
rl
0: rl = 0 no rain
1: 0% < rl < 33% light rain
2: 33% ≤ rl <
66%
heavy rain
3: 66% ≤ rl ≤
100%
cloud-burst
Lane
width lw
0: lw ≥ nw norm
1: lw < (nw − ot)
OR lw < (nw −
mr)
narrow
2: lw ≤ vw very narrow
Traffic
density td
td = 0: LOS A Low density
td = 1: LOS B Moderate
td = 2: LOSC High
td = 3: LOS D Very high
Loudness
level ll
0: ll ≤ 60dB quiet
1: ll ≤ 70dB below com-
fort
2: ll ≤ 80dB above com-
fort
3: ll ≤ 90dB just below
max
4: ll ≥ 90dB above max
Eyes
off-road
time eo
0: eo < 0.6sec not distracted
1: eo < 1sec slightly distr.
2: eo < 1.3sec moderately
distracted
3: eo < 1.6sec considerably
distracted
4: eo < 2sec highly distr.
5: eo ≥ 2sec extremely
distr.
In the following, we show the applicability of the
two examples mentioned above and the obtained re-
sults which can be used in an adaptive HMI system.
6.1 Use Case Description
Anna and Sophie both own a vehicle having function-
alities of adaptive HMI, ACC, and misuse detection.
Since they are driving at the same time on the
federate autobahn from Frankfurt to Stuttgart, the
outside-vehicle context is the same for both of them.
However, the inside-vehicle context and the driver
state and its characteristics is typically different.
6.2 Difficulty Dimensions
Without loss of generality, we concentrated on the fol-
lowing dimensions.
Outside-vehicle Context. This context comprises
the largest part of dimensions. For simplicity reasons,
we use only the traffic density, the rain level, and the
lane width as measurement. For the rain level, clas-
sifications suggested by (Michenfelder et al., 2007)
or (Beritelli et al., 2018) are used. The observable
difficulty level can be measured by a rain sensor. For
the lane width classification, we use country-specific
norms that define a norm width nw for each road type.
It includes the vehicle width vw, a movement range
mr, and an oncoming traffic tolerance ot. We refer to
a lane as narrow, if either mr or ot is missing. E.g., in
Germany, the norm width is defined as nw = 3, 5m for
rural roads, and nw = 3, 75m for motorways. The ob-
servable difficulty level could be measured by video
camera and lidar using computer vision technologies
(e.g., (Li et al., 2018)). For the traffic density, clas-
sifications are suggested by the spatial organization
of transportation and mobility (Rodrigue, 2020). It
defines six levels of service (LOS) from free flow
(LOS A) to congestion (LOS F). Authors in (Pa-
padimitriou et al., 2010) suggested to reduce the six
density classes to three classes, based on further user
studies. In our approach, we use the first four classes
presented by (Rodrigue, 2020), since we do not clas-
sify congestion as extremely difficult. The observable
difficulty level can be measured by video cameras as
described in (Ma and Qian, 2019).
Inside-vehicle Context. Regarding the context oc-
curring in vehicle, we use only the loudness level in
the car (e.g., from music or talking passengers), al-
though additional measures such as the source of dis-
traction (e.g., music, news, conversations with pas-
sengers, telephone calls, screaming kids, and many
more) could also be considered. This challenge level
can be measured e.g., by a microphone. In our ap-
proach, we use classifications suggested by the Amer-
ican Speech-Language-Hearing Association (ASHA,
2021), and University of Michigan (Berger et al.,
2015). The classification depends on two thresholds:
1) the maximum loudness handled by the driver with
a little effort; and 2) the threshold of discomfort. For
use case demonstration, respective manually defined
values are used. However, since both thresholds are
personalized values, we foresee they could be learned
via Machine Learning algorithms.
Driver State. As a driver state, we only use the eye
gaze direction although additional dimensions such as
fatigue, seating position, driver drowsiness, and could
be easily included as well. In order to measure the
observable difficulty level, we use the so-called eyes-
off-road time which can be detected by a video cam-
VEHITS 2021 - 7th International Conference on Vehicle Technology and Intelligent Transport Systems
726
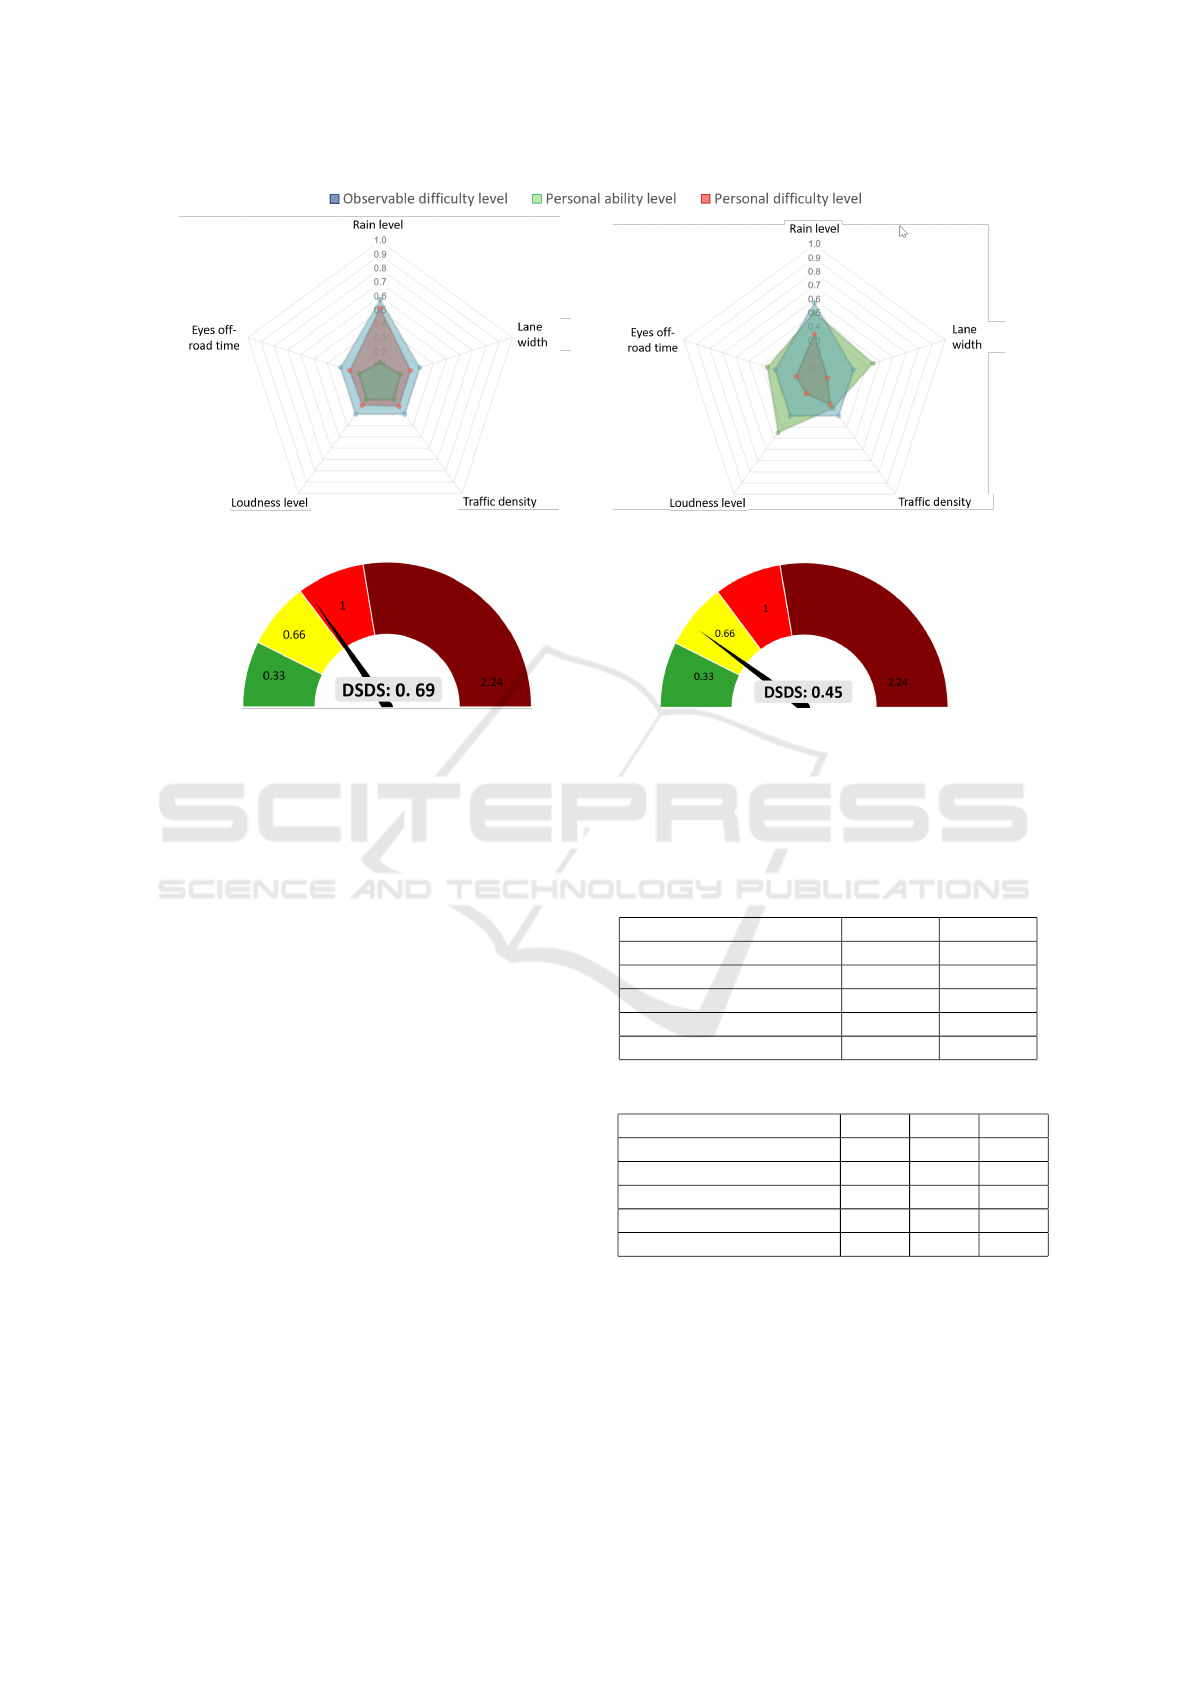
(a) Dimension levels of a novice driver with heavy rain. (b) Dimension levels of an experienced driver with heavy rain.
(c) DSDS for a novice driver with heavy rain. (d) DSDS for an experienced driver with heavy rain.
Figure 2: Situation 1: DSDS and dimension levels for a novice driver with low abilities and an experienced driver with mid
abilities. The observed difficulty level for rain is in the mid range, all other observed difficulty levels are in the lower range.
era tracking the driver’s eye-gaze. The classification
used here are based on the National Highway Traf-
fic Safety Administration (NHTSA) (NHTSA, 2013;
NHTSA, 2014), and a 100-Car Naturalistic Driving
Study (Simons-Morton et al., 2014). These classifi-
cations w.r.t. the observable difficulty levels are sum-
marized in Table 1. In order to refine the classifica-
tion, we divided each interval into ten sub-intervals.
For example, an observed loudness difficulty level
ll = 2.7 describes a loudness level much higher than
the comfort level.
Driver Profiles: Personal Ability Levels. Table 2
shows the personal abilities of Anna and Sophie.
Anna is a novice driver with low personal capabili-
ties. Sophie is a more experienced driver with moder-
ate personal abilities.
6.3 Discussion
The approaches listed in section 3 are tailored to spe-
cific situations such as driver attentiveness, driving
style, or weather conditions; considering only a small
number of dimensions. It would be a high effort to ex-
tend them by new dimensions, whenever new dimen-
sions are emerging. Our approach can handle a huge
number of dimensions. It is extensible and can eas-
ily be adapted to completely new situations by adding
classifications for the necessary dimensions.
Table 2: Personal abilities for Anna and Sophie.
Personal ability level Anna Sophie
Rain level [0..100] 13.0 51
Lane width [0..2] 0.3 0.9
Traffic density [0..3] 0.5 0.7
Loudness level [0..4] 0.7 1.8
Eyes off-road time [0..5] 0.8 1.8
Table 3: Observable difficulty levels of the given situations.
Observable diffic. level Sit. 1 Sit. 2 Sit. 3
Rain level [0..100] 58 38 38
Lane width [0..2] 0.6 0.8 0.8
Traffic density [0..3] 0.9 1.2 1.2
Loudness level [0..4] 1.2 1.6 1.6
Eyes off-road time [0..5] 1.5 2 5
In the following, we discuss the results of the
DSDS for three situations. In each situation, the ef-
fect of one of the aforementioned HMI or ADAS sys-
tems on the two drivers is described in detail. Table 3
shows the observable difficulty levels for the three sit-
uations described in the following.
Towards a Rule-based Approach for Estimating the Situation Difficulty in Driving Scenarios
727
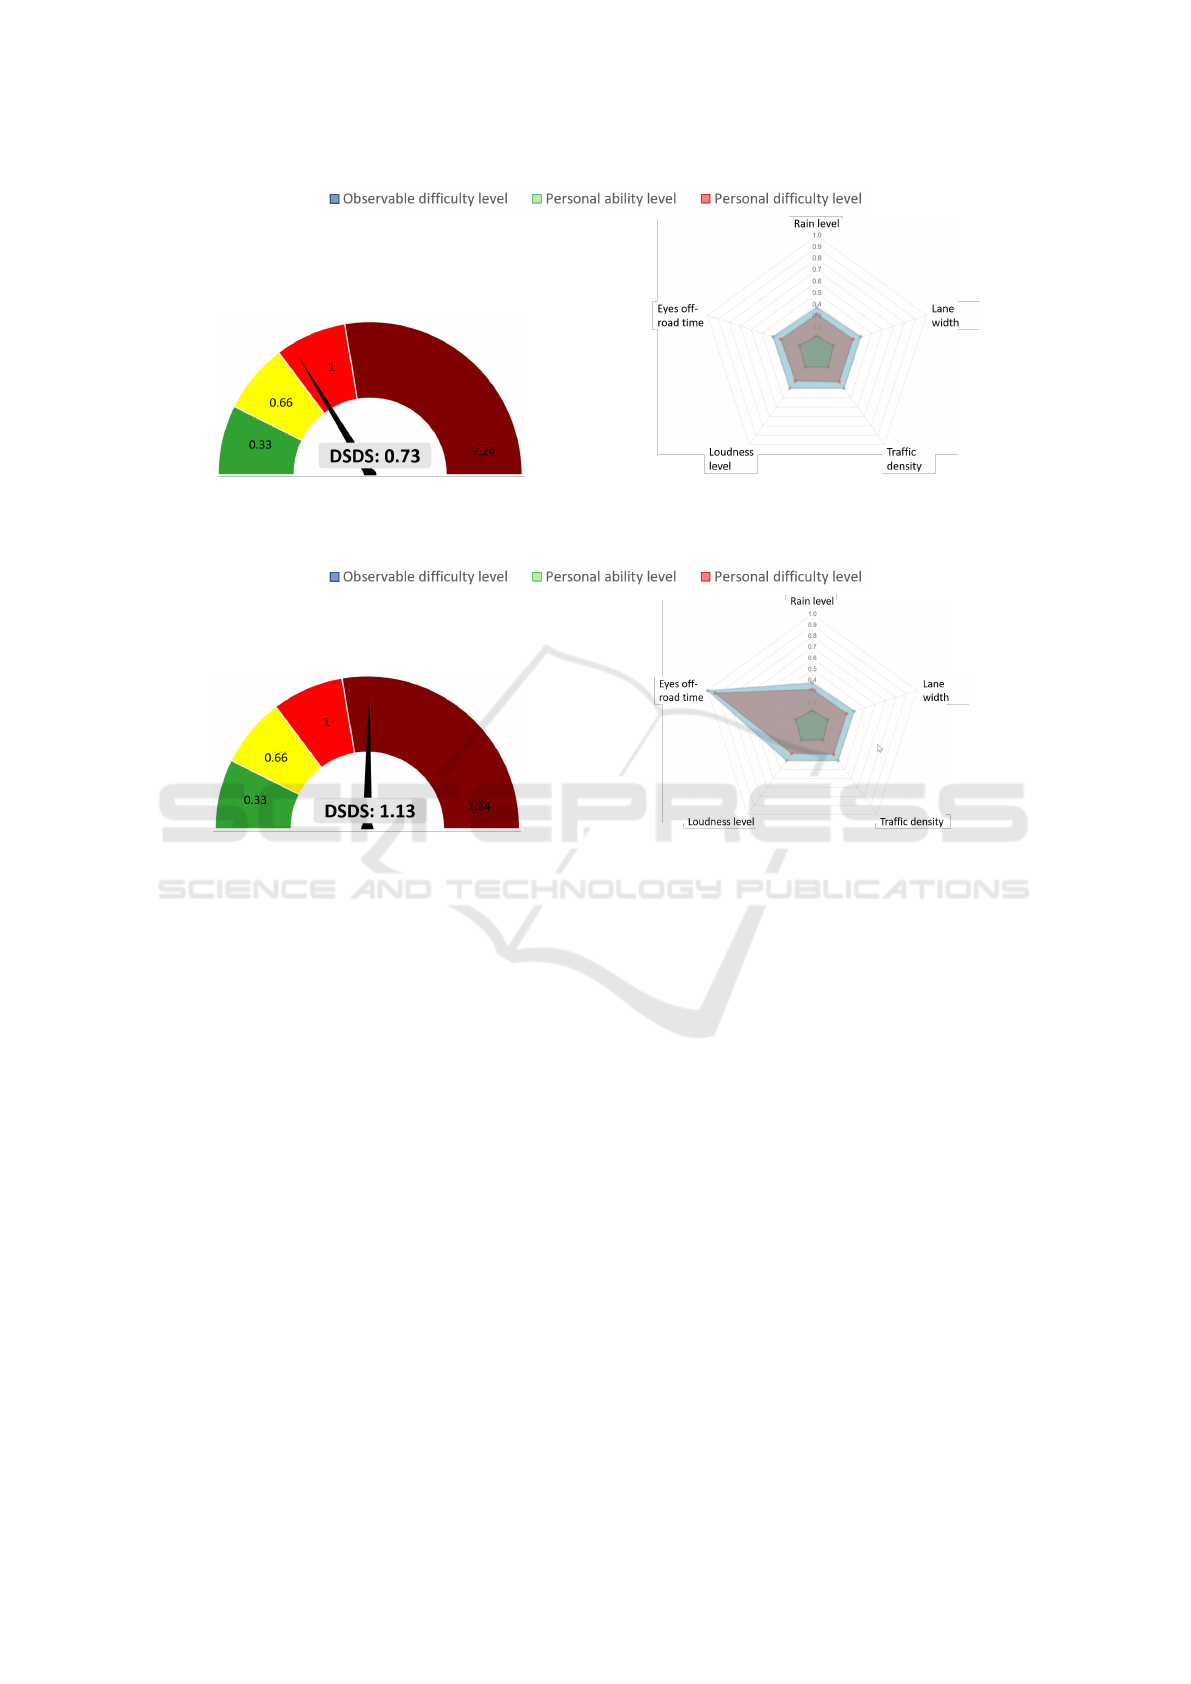
(a) DSDS for the novice driver. (b) Difficulty levels the novice driver.
Figure 3: Situation 2: DSDS and difficulty levels for the novice driver. All observed difficulty levels are in the low to mid
range, but the DSDS sums up to high difficulty.
(a) DSDS for the novice driver. (b) Difficulty levels for the novice driver.
Figure 4: Situation 3: DSDS and difficulty levels for the novice driver. The observed difficulty level of the eyes off-road time
has reached the maximum value 1. All other observed difficulty levels are in the low to mid range, resulting in a DSDS > 1.
Situation 1. Same Observable Difficulty Level and
Different Personal Ability Levels. In this situa-
tion, it is raining heavily, the rain sensor provides a
value of 58% whereas all other difficulties are in the
lower range. Figure 2 depicts the DSDS and the dif-
ficulty levels for Anna and Sophie. In the spider de-
picted in Figure 2a, we can see that for Anna as a
novice driver: the green area showing her personal
abilities is quite small. The personal difficulty level
(red area) for the rain dimension is nearly the ob-
served difficulty level (blue area). This results in a
high DSDS for Anna, as shown in Figure 2c. Based
on these values, the ACC of Anna’s vehicle can in-
crease the distance to the vehicle in front. On the
other hand, Sophie is an experienced driver, as de-
picted in Figure 2b. Her personal abilities are higher
compared to Anna, so the personal difficulty level of
the rain dimension is less than the observed difficulty
level which results in a much lower DSDS as shown
in Figure 2d. The ACC of Sophie’s vehicle can toler-
ate a small distance to the vehicle in front, considering
that is still safe.
Situation 2. Many Moderate Difficulties Sum up
to a Difficult Situation. Table 3 shows the observ-
able difficulty levels for the second situation. Each
of the observable difficulty levels alone would be be-
tween the green and the yellow area. But all together,
they result in a difficult situation. The DSDS of 0.73
is in the red area, as illustrated in Figure 3. Anna’s
adaptive HMI postpones the information about the in-
coming call until the situation difficulty decreases.
Situation 3. Extremely Difficult Situations Need
Time-critical Actions. The driving situation is the
same as in situation two, except that Anna is using her
mobile for more than two seconds. The system esti-
mates a DSDS of 1.13 lying in the dark red area, as
shown in Figure 4. The dark red area indicates a sit-
uation difficulty higher than the maximum difficulty
level of one dimension. The misuse detection sys-
tem prompts her to immediately concentrate back on
steering the vehicle.
VEHITS 2021 - 7th International Conference on Vehicle Technology and Intelligent Transport Systems
728

7 CONCLUSIONS AND
OUTLOOK
In this paper, we describe an approach for estimat-
ing the situation difficulty in driving scenarios by
combining important factors like traffic density, road
conditions, environmental factors, inside-vehicle dis-
tractions, driver capabilities and driver state. It is
based on a rule-based paradigm for difficulty esti-
mation which has several advantages. The rules are
reproducible and easily verifiable playing an impor-
tant role in safety relevant systems. Further, a holis-
tic architecture composed of various loosely-coupled
components is designed with the objective of allow-
ing the integration of heterogeneous data sources. Fi-
nally, we demonstrated our approach in three con-
crete situations where calculating DSDS including
personal characteristics could have a high impact on
the road safety. For simplicity, we have used dis-
crete values for the individual factors for a number of
difficulty dimensions that impact situation difficulty.
These could be extended to continuous-valued func-
tions, like a sigmoid function or could be learned if
sufficient training data is available.
As future work, we will work on including Fuzzy
Logic algorithms to provide classifications for a di-
mension’s observable difficulty levels. Next, we will
investigate adopting machine learning techniques re-
garding individual difficulty dimensions. Particularly
for cases where rules cannot be defined with sufficient
evidence and where enough data is available for train-
ing, learning based methods could be applied. An-
other direction of further analysis is related to the ma-
turity of sensors to determine the necessary parame-
ters and knowledge about their influence in the over-
all situation difficulty which can vary from domain to
domain. For example, much research has been done
for eye-gaze tracking and determining its influence in
driving, whereas in other areas like the quantification
and analysis of driver distraction by music, conver-
sation and others is less well known. How much in-
dividual capabilities and experience manifest them-
selves in day-to-day driving situations is subject of
current research (Kaber et al., 2012). But how these
are influenced by other factors like conversations, in-
fotainment or other distractions is unclear. Further-
more, we would like to learn individual capabilities,
how they change over time, and how they are influ-
enced by other factors.
REFERENCES
ASHA (2021). Loud noise dangers. https://www.
asha.org/public/hearing/loud-noise-dangers/.
Bazilinskyy, P., Petermeijer, S. M., Petrovych, V., Dodou,
D., and Winter, J. D. (2018). Take-over requests in
highly automated driving: A crowdsourcing survey
on auditory, vibrotactile, and visual displays. Trans-
portation Research Part F-traffic Psychology and Be-
haviour, 56:82–98.
Bengler, K., Dietmayer, K., F
¨
arber, B., Maurer, M., Stiller,
C., and Winner, H. (2014). Three decades of driver
assistance systems: Review and future perspectives.
IEEE Intell. Transport. Sys. Magazine, 6:6–22.
Berger, E., Neitzel, R., and Kladden, C.(2015).
Noise navigatortm sound level database with
over 1700 measurement values. https://multime
dia.3m.com/mws/media/888553O/noise-navigator-
sound-level-hearing-protection-database.pdf.
Beritelli, F., Capizzi, G., Sciuto, G. L., Napoli, C., and
Scaglione, F. (2018). Rainfall estimation based on the
intensity of the received signal in a lte/4g mobile ter-
minal by using a probabilistic neural network. IEEE
Access, 6:30865–30873.
Bier, L., Emele, M., Gut, K., Kulenovic, J., Rzany, D., Pe-
ter, M., and Abendroth, B. (2019). Preventing the risks
of monotony related fatigue while driving through
gamification. European Transport Research Review.
Braunagel, C., Geisler, D., Rosenstiel, W., and Kasneci, E.
(2017). Online recognition of driver-activity based on
visual scanpath classification. IEEE Intelligent Trans-
portation Systems Magazine, 9(4):23–36.
Fazio, P., Santamaria, A. F., Rango, F. D., Tropea, M., and
Serianni, A. (2016). A new application for analyz-
ing driving behaviour and environment characteriza-
tion in transportation systems based on a fuzzy logic
approach. In Unmanned Systems Technology XVIII,
volume 9837, pages 49 – 61. International Society for
Optics and Photonics, SPIE.
Heinzler, R., Schindler, P., Seekircher, J., Ritter, W., and
Stork, W. (2019). Weather influence and classification
with automotive lidar sensors. In 2019 IEEE Intelli-
gent Vehicles Symposium (IV), pages 1527–1534.
J
¨
agerbrand, A. and Sj
¨
obergh, J. (2016). Effects of weather
conditions, light conditions, and road lighting on ve-
hicle speed. SpringerPlus, 5.
Kaber, D., Zhang, Y., Jin, S., Mosaly, P., and Garner, M.
(2012). Effects of hazard exposure and roadway com-
plexity on young and older driver situation awareness
and performance. Transportation Research Part F-
traffic Psychology and Behaviour, 15:600–611.
Kita, H. (2000). Level-of-service measure of road traffic
based on the driver’s perception. Transportation re-
search circular, pages 53–62.
Li, B., Song, D., Li, H., Pike, A., and Carlson, P. (2018).
Lane marking quality assessment for autonomous
driving. In 2018 IEEE/RSJ International Conference
on Intelligent Robots and Systems (IROS).
Ma, W. and Qian, S. (2019). High-resolution traffic sensing
with autonomous vehicles.
Towards a Rule-based Approach for Estimating the Situation Difficulty in Driving Scenarios
729

Martinez, C. M., Heucke, M., Wang, F., Gao, B., and Cao,
D. (2018). Driving style recognition for intelligent ve-
hicle control and advanced driver assistance: A sur-
vey. IEEE Transactions on Intelligent Transportation
Systems, 19:666–676.
Michenfelder, G., Riehl, G., Burkart, M., and Roth, K.
(2007). Rain sensor.
NHTSA (2013). Driver behavior during visual-manual sec-
ondary task performance: Occlusion method versus
simulated driving.
NHTSA (2014). Visual-manual nhtsa driver distraction
guidelines for in-vehicle electronic devices.
Papadimitriou, E., Mylona, V., and Golias, J. (2010). Per-
ceived level of service, driver, and traffic characteris-
tics: Piecewise linear model. Journal of Transporta-
tion Engineering, 136.
Park, Y., Yang, J. H., and Lim, S. (2018). Development of
complexity index and predictions of accident risks for
mixed autonomous driving levels. In IEEE Int. Conf.
on Sys., Man, and Cybernetics (SMC).
Paxion, J., Galy, E., and Berthelon, C. (2014). Mental work-
load and driving. Frontiers in Psychology, 5.
Paxion, J., Galy, E., and Berthelon, C. (2015). Overload de-
pending on driving experience and situation complex-
ity: Which strategies faced with a pedestrian crossing?
Applied Ergonomics, 51:343–349.
R
¨
ockl, M., Robertson, P., Frank, K., and Strang, T. (2007).
An architecture for situation-aware driver assistance
systems. 2007 IEEE 65th Vehicular Technology Con-
ference - VTC2007-Spring, pages 2555–2559.
Rodrigue, J.-P. (2020). The Geography of Transport Sys-
tems. Routledge, New York.
Simons-Morton, B. G., Guo, F., Klauer, S. G., Ehsani, J. P.,
and Pradhan, A. K. (2014). Keep your eyes on the
road: Young driver crash risk increases according to
duration of distraction. Journal of Adolescent Health,
54(5, Supplement):61 –67.
Wang, H., Song, Z., and Wen, R. (2018). Modeling air traf-
fic situation complexity with a dynamic weighted net-
work approach. Journal of Advanced Transportation.
VEHITS 2021 - 7th International Conference on Vehicle Technology and Intelligent Transport Systems
730
