
Data Mining, Business Intelligence, Grid and Utility Computing:
A Bibliometric Review of the Literature from 2015 to 2020
Ernani Damasceno
1,2,3 a
, Ana Azevedo
2b
and Manuel Pérez-Cota
3c
1
Department of Computing, Federal Institute of Triangulo Mineiro, Campus Paracatu, Brazil
2
CEOS.PP, ISCAP, Polytechnic of Porto, Porto, Portugal
3
Higher School of Computer Science, Vigo University, Vigo, Spain
Keywords: Bibliometric Review, Data Mining, Business Intelligence, Grid and Utility Computing, Systematic Review,
Essential Science Indicators.
Abstract: Bibliometric review is a type of systematic review used to analyze a wide range of articles or scientific
publications using statistical tools to identify trends in many articles. However, there are some areas of study
that are more consolidated with a wide range of studies, such as Data Mining (DM) and Business Intelligence
(BI). New tools are being researched to provide a more effective way of using technologies in organizations,
namely, Grid Computing (GC) and Utility Computing (UC). Thus, this article aims at showing analysis of
publications databases in order to verify whether there are studies on DM and BI together with GC and UC
from 2015 to 2020. The purpose is to demonstrate not only the quantity but also some aspects, such as relations
between topics, number of publications per year, main countries and institutions, research network and H5
index from Google Scholar. Finally, the results are shown through the number of publications, percentages,
and the most relevant subjects, based on Essential Science Indicators based on Essential Science Indicators,
which determine the influences of countries, institutes, and authors in a specific field of study.
1 INTRODUCTION
It is essential that researchers become increasingly
critical and try to understand the things that are
requested, noting why they are requested. We are
going through a moment of transition in which new
international requirements are imposed so that
science can be developed correctly (Liao, Tang, Li, &
Lev, 2018). Essential Science Indicators (ESI) are
analytical databases built based on the academic
literature and their references. Accordingly,
researchers can understand the development and
influence of some noted scientists, research
institutions, countries (or regions) and academic
journals in a certain field. It is known that the amount
of information is large and, as new studies appear
every day, scientific articles are used to support new
research. Hence, there are concerns regarding where
the researcher brings information. It is possible to
filter the scientific information through a systematic
a
https://orcid.org/0000-0002-7298-4681
b
https://orcid.org/0000-0003-0882-3426
c
https://orcid.org/0000-0003-0471-6981
search. The systematic search seeks to understand
what the search process was, that is, what steps were
used to find the information. Bibliometric
performance analysis evaluates the impact of
scientific output based on publications and their
citations, while science mapping illustrates the
intellectual structure of the journal and the evolution
of the main research themes (López-Robles, Otegi-
Olaso, Arcos, Gamboa-Rosales, & Gamboa-Rosales,
2018). However, when the subject is selected, it is
important to highlight how the national and
international literature are approaching a specific
subject, for example, who are the researchers, what
are the titles, what are the journals, if there is any
predominant journal for a particular subject, if there
is any country that is more dedicated to the subject.
Considering these aspects, Bibliometric Analysis has
been used in various fields. The application of
bibliometric techniques has become much simpler as
online databases with bibliographic data have
Damasceno, E., Azevedo, A. and Pérez-Cota, M.
Data Mining, Business Intelligence, Grid and Utility Computing: A Bibliometric Review of the Literature from 2015 to 2020.
DOI: 10.5220/0010527303670373
In Proceedings of the 23rd International Conference on Enterprise Information Systems (ICEIS 2021) - Volume 1, pages 367-373
ISBN: 978-989-758-509-8
Copyright
c
2021 by SCITEPRESS – Science and Technology Publications, Lda. All rights reserved
367

emerged, and software has been developed to support
the handling of bibliometric data and the visual
representation of bibliometric networks (Walsh &
Renaud, 2017). Over the years, an increasing number
of indicators and tools have been developed to
quantify the research performance and contributions
of authors, journals, institutions, and countries
(Kaffash, Nguyen, & Zhu, 2020).
This study aims to determine the evolution of
publications from 2015 to 2020, see the most
productive authors and the most relevant research
networks in the fields presented. More recent
publications were included because they are
considered more relevant. Additionally, the aspects
considered are influential institutions, journals,
countries, and areas. It is intended to verify that there
are few studies related to concepts already widely
used, such as Data Mining (DM) and Business
Intelligence (BI), in conjunction with new ones,
namely, Grid Computing (GC) and Utility
Computing (UC). As a result, provide guidance
regarding the number of studies that are being carried
out in the area to help future researchers to see how
much it is necessary to improve studies in these fields.
The remainder of this paper is organized as follows.
Section 2 presents the background describing the
main characteristics of DM, BI, GC, UC, and related
works. Section 3 presents the methods used in this
study. Section 4 presents the results of the study.
Finally, Section 5 concludes the paper.
2 BACKGROUND
In this section, a brief introduction to DM, BI, GC,
and UC is presented. Following that, concepts and
main characteristics are explained in order to
understand the general definitions of each subject and
the relation between them in the organizational
context. However, only recent publications were
listed because the objective of this paper is to present
the current scenario of the concepts.
2.1 Data Mining (DM)
The concept of DM is already immensely popular
around the world in different areas, such as business
activities and the realm of commerce. To avoid
misconceptions or misunderstandings, it is important
to explain what DM is about. DM is a technique that
allows patterns or models to be obtained from the
gathered data. This technique is applied in various
environments, such as in biological fields,
educational and financial applications, industry,
police, and political processes (Viloria, et al., 2019).
In addition, DM is the incorporation of quantitative
methods called mathematical methods, which may
include mathematical equations, algorithms, some
prominent methodologies of traditional logistic
regression, neural networks, classification, and
clustering. Endorsing DM is intended to provide real
solutions for decision makers to develop their
businesses (Rahim, et al., 2018).
2.2 Data Mining and Business
Intelligence
In today's modern business world, companies
generate a large amount of data. Because of this large
amount of data, it is difficult to obtain a global view
of how the company is doing in all its activities
without having to look at several reports in different
locations. What organizations really need to do is
bring these disparate data sources together and
analyze them together to get a clearer picture. Thus,
BI acts as a strategic factor for a company or
organization, generating a competitive advantage that
provides privileged information to respond to
business problems (Monsalve, Carreño, Gutiérrez,
Molina, & Rangel, 2019). In the past, everything was
stored in spreadsheets and local databases. However,
in the online era, there are social media and cloud-
based business services, all of which generate large
amounts of data. Therein lies the biggest challenge for
BI. Trying to solve this problem, if DM processes are
added to BI, it is possible to create social media
mining and use it to identify influential customers in
a social networking site, detect implicit or hidden
groups in a social networking site, perceive customer
opinions related to their product or service’s
satisfaction for proactive planning, develop
recommendation systems to maintain existing
customers and gain new ones, or build and strengthen
trust among customers or between customers and
other stakeholders (Kurnia & Suharjito, 2018).
2.3 Grid and Utility Computing Tools
GC enables access to distributed heterogeneous
resources using web services. These resources can be
data sources (files, databases, web sites, etc.),
computing resources (multiprocessors,
supercomputers, clusters) and application resources
(scientific applications, information management
services, etc.) (Liu, Pacitti, Valduriez, & Mattoso,
2015). Equally, UC helps reduce initial investment.
As the computing requirements for an individual or
an organization change, the billing changes
ICEIS 2021 - 23rd International Conference on Enterprise Information Systems
368
accordingly without incurring any additional costs. If
usage is reduced, billing will also be reduced
accordingly (Malik, Wani, & Rashid, 2018). Both GC
and UC are branches of cloud computing; therefore,
an emerging field of computer science that takes the
IT sector to a new level. In addition, cloud computing
is an advancement of various combined technologies,
such as Distributed Computing, Utility Computing,
Virtualization, to provide IT resources and services
over the Internet on pay as per use manner (Haris &
Khan, 2018).
2.4 Related Works
Bibliometric reviews analyze an extensive amount of
published research by using statistical tools to
determine trends and citations and/or co-citations of
a particular theme by year, country, author, journal,
method, theory, and research problem (Paul &
Criado, 2020). To understand these relevant aspects,
this paper presents an overview of the publications in
Google Scholar, checking the number of bibliometric
publications concerning GC and UC.
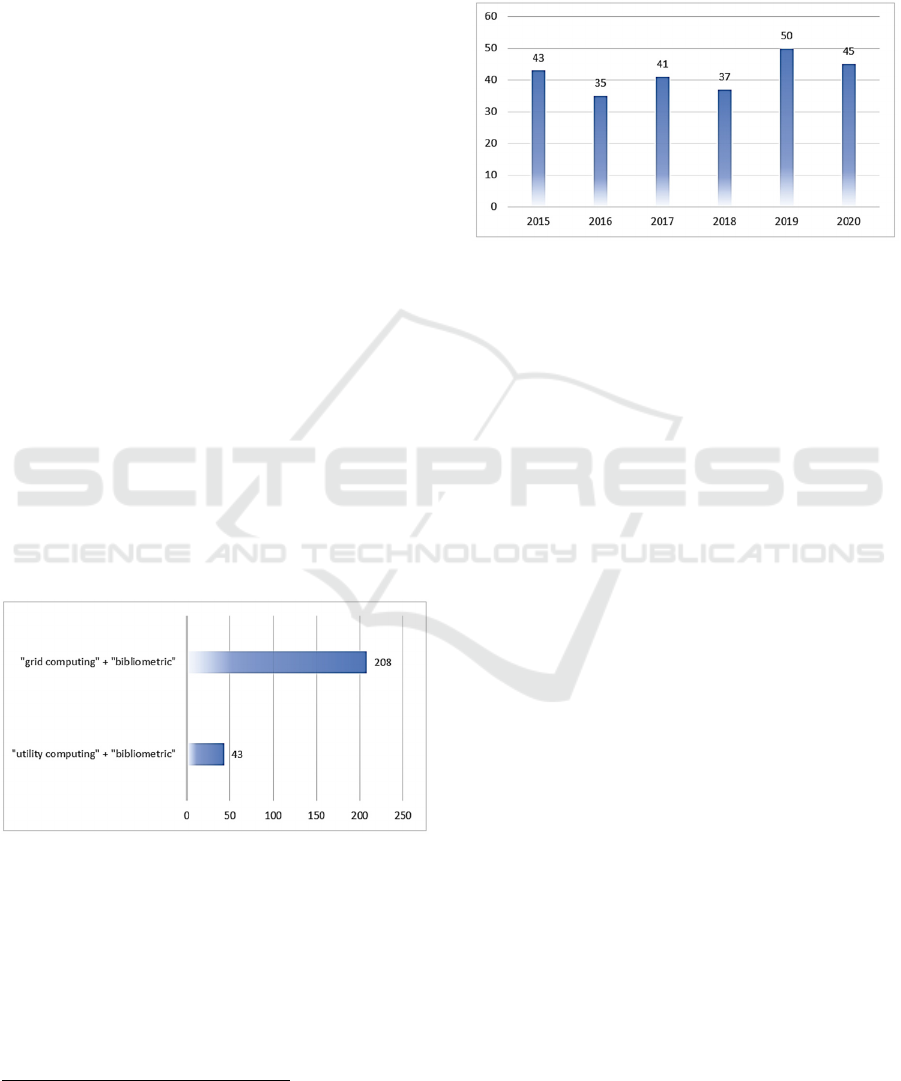
This analysis aims to demonstrate the number of
bibliometric publications found in specific subjects in
Google Scholar, such as GC and UC. Then, the
keywords used were “grid computing” +
“bibliometric” and “utility computing” +
“bibliometric” for the last five years.
Figure 1 illustrates that there are more
bibliometric articles on GC than on UC. It is also
important to see when the articles were published.
Figure 1: Number of publications by search.
Figure 2 demonstrates the number of publications
since 2015 and, as can be observed, there is not much
variation in the number of publications.
Following the analysis, Google Scholar metrics
provide an easy way for authors to quickly gauge the
visibility and influence of recent articles in scholarly
publications. The metric used in this study is the h5-
1
https://endnote.com/
index, which consists of the h-index for articles
published in the last five years. It is the largest
number h such that h articles published in 2015-2019
have at least h citations each. For example, a
publication with five articles cited by, respectively,
17, 9, 6, 3, and 2, has an h-index of 3.
Figure 2: Number of publications per year.
3 METHODS
To achieve the aims of this study, a bibliometric
review of the four topics, BI, DM, GC and UC, was
adopted. First, searches for publications that address
topics separately were carried out, and then searches
were conducted with articles that make relationships
between subjects. The analysis was conducted
through citations; that is, article citations were
downloaded from different academic databases, such
as Google Scholar, Web of Science, Library of
Congress, PubMed, SciELO and Scopus. In this type
of analysis, it is necessary to search for a large amount
of data; therefore, EndNote
1
software was used to
speed up the data collection process.
The bibliometric review method was used with
the keywords "grid computing" + "data mining",
"utility computing" + "data mining", "grid
computing" + "business intelligence" and "utility
computing" + "business intelligence” from 2015 to
2020. Explaining, the choice of these keyword
combinations is corroborated in view of the fact that
DM has proved to be a phenomenally robust tool,
which smoothens the analysis and interpretation of
large volumes of complex data. As a result, given the
complexities involved in operating and maintaining
grid environments efficiently and the ability of data
mining to analyze and interpret large volumes of data,
it is obvious that ‘mining grid data’ could be a
solution to improving the performance, operation and
maintenance of grid computing environments
Data Mining, Business Intelligence, Grid and Utility Computing: A Bibliometric Review of the Literature from 2015 to 2020
369
(Hussain, Naser, Begum, Shaik, & Shaik, 2015). Grid
enables organizations to create a managed, shared grid
computing environment for processing large volumes
of data and analytic programs (Ruzgas & Dabulytė-
Bagdonavičienė, 2017). Finally, it is understood that
the combination of these issues is important to
understand how organizations are using new tools
together with those already established. In summary,
the combination of these issues is important to
understand how organizations use these new tools
together with those already established. The search
aims to show if there are publications using the topics
together, as it is known that each subject researched in
isolation brings many publications.
After data collection, all data were transferred to
Microsoft Excel
2
in different spreadsheets organized
by journals, and formulas and functions were inserted
to filter the data. To demonstrate better visualization,
many graphics were created with the intention of
illustrating the data to facilitate analysis. In addition,
the analysis will also show the most cited journals
using the Google Scholar H5 Index, according to the
four topics mentioned above. It is important to
emphasize that all searches were filtered and the non-
relevant articles, with missing information and other
languages besides English, were not considered; thus,
they were rejected.
In summary, a deep analysis was conducted in the
most relevant database, considering meaningful
aspects such as the number and percentage of
publications by year, number of authors and who are
more productive and influential countries.
Additionally, a research network between significant
authors was created using the VOSviewer software.
In conclusion, we tried to use criteria in a
standardized way, because with that, it is understood
that there is a greater contribution of these issues that
still have much to develop.
4 RESULTS
Main results of the study are introduced in this
section.
4.1 Publications Databases
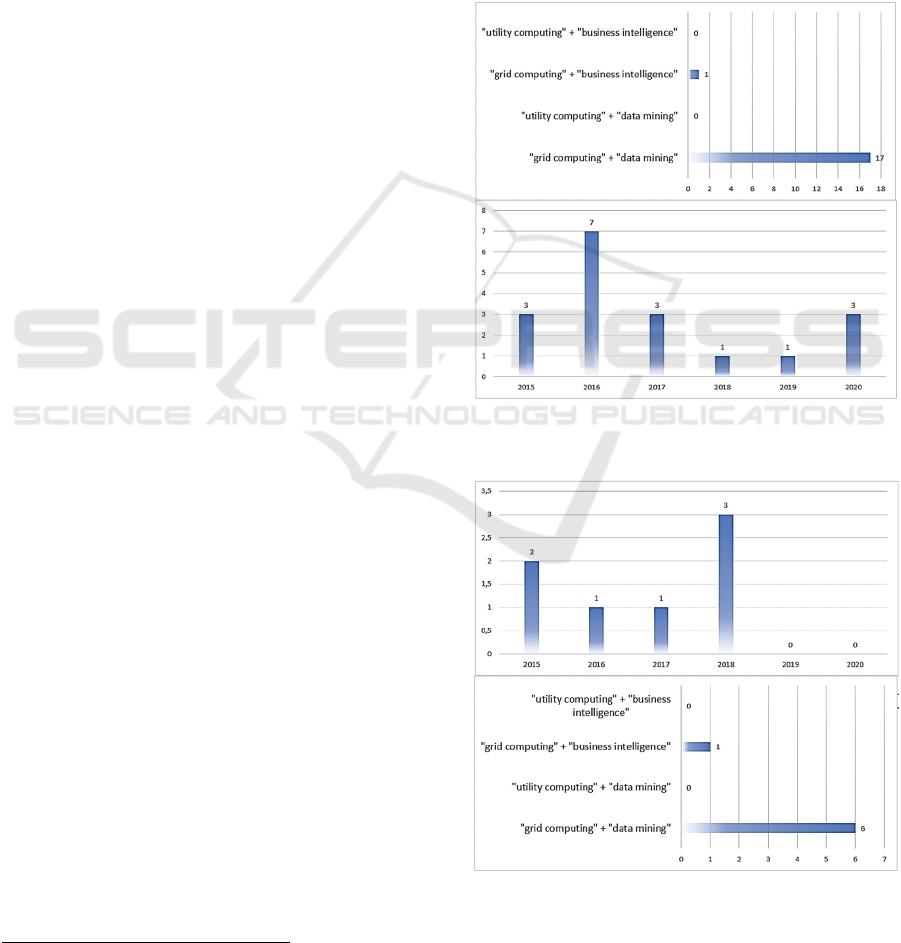
Figure 3 shows how many citations were found in
Web of Science according to the keywords These
searches yielded only 18 results in total. From the
analysis, it can be observed that the number of
publications on “grid computing” + “data mining”
2
https://www.microsoft.com/
has 17 registers. It is important to note that the
keywords “utility computing” + “data mining”, and
“utility computing” + “business intelligence” did
not have any results.
More analysis was performed at the Library of
Congress, as shown in figure 4. 7 results were found.
It is important to highlight that "utility computing" +
"data mining" and "utility computing" + "business
intelligence" searches found no results. These results
corroborate those obtained from the Web of Science.
In addition, there are no publications published in
2019 and 2020.
Figure 3: Number of publications per year and by search in
Web of Science.
Figure 4: Number of publications per year and by search in
Library of Congress.
ICEIS 2021 - 23rd International Conference on Enterprise Information Systems
370
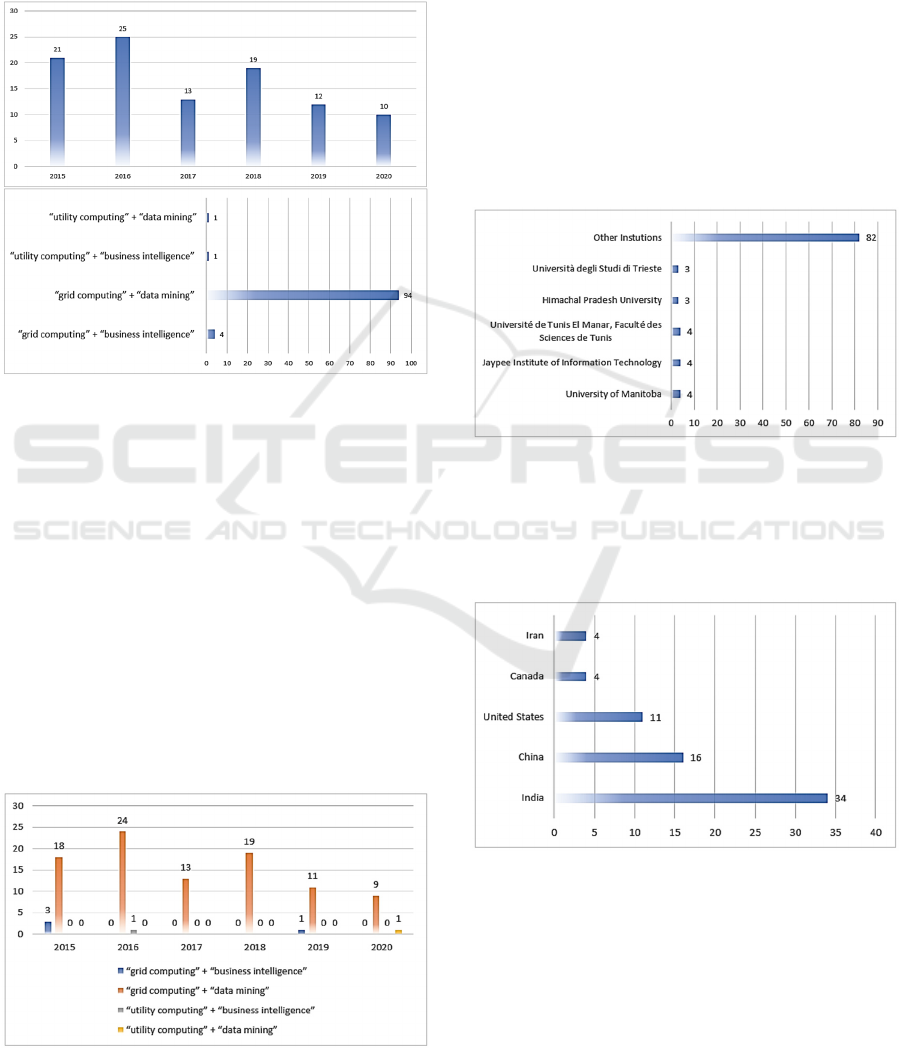
Searches were also performed on Scopus using
the same keywords. One hundred results were found
(Figure 5), but only “grid computing” + “data
mining” keywords have a significant number of
publications. As shown in Figure 5, the number of
publications over the years has remained balanced,
showing some interest of researchers in these areas.
Figure 5: Number of publications by search and per year in
Scopus.
Finally, searches were made with the four
keywords in PubMed and SciELO, but the databases
retrieved zero results.
The Scopus database is more important in GC and
UC; thus a deeper analysis of Scopus is presented
below.
4.2 Deeper Analysis in Scopus
This search shows a deeper analysis of the Scopus
database, showing the distribution of publications per
year, main authors, institutions, and countries from
2015 to 2020. In addition, research networks will be
presented because this analysis applied to the study of
Figure 6: Number of publications and percentages per year.
the social agents responsible for scientific
publications allows us to identify the number of
members in the network, the intensity of the
relationship between them and the most relevant
members of the network (Andrés, 2009).
Figure 6 shows the distribution of publications
from 2015 to 2020. Some of the associations had no
results and the average number of publications in
general was regular, proving that more research is
necessary in this area.
Figure 7 presents the distribution of the
institutions in the search. There can be observed that
there are 5 institutions with 4 or 3 publications, and
82 institutions with 2 or 1 publications. This reveals
that there are no institutions that clearly stand out
from the others.
Figure 7: Top five institutions and percentages.
Figure 8 presents the countries that contribute the
most to the progress of research in this area. India,
China and the United States were the most relevant
countries.
Figure 8: Total number of publications and percentage per
country.
Subsequently, the authors’ research networks
were analyzed. The dimensions on which the research
networks were assessed were the authors. The
criterion for belonging to a given network was to have
published a significant number of papers in co-
authorship (Andrés, 2009). To create the authors'
Data Mining, Business Intelligence, Grid and Utility Computing: A Bibliometric Review of the Literature from 2015 to 2020
371
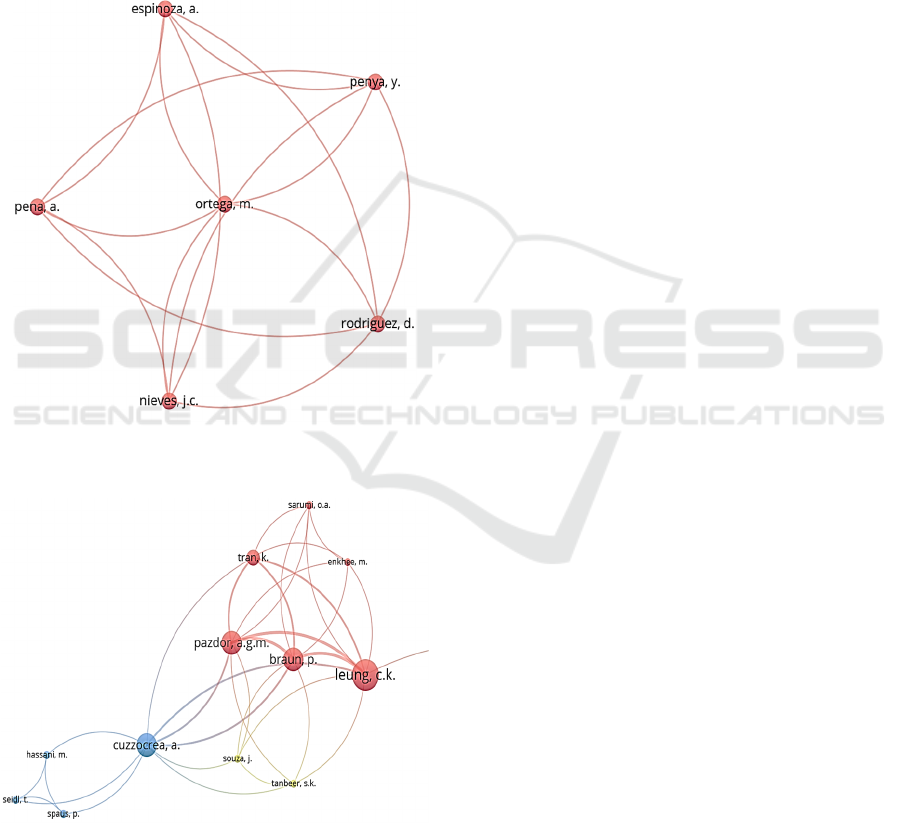
research networks, VOSviewer software was used
through the data downloaded from the Scopus
platform. Figures 9 and 10 show the research
networks for the four topics. The thickness of the
lines shows the strength of the connections between
the authors, and the size of the edges shows the
authors with more publications.
In Figure 9, although the number of publications is
insufficient to generate a graph with significant
connections, we can verify that Ortega, A is the
author that connects all the other authors of the
research network for GC + BI.
Figure 9: Research network of Grid Computing and
Business Intelligence authors.
Figure 10: Research network of Grid Computing and Data
Mining authors.
In figure 10, we can verify that Leugh, C. K.;
Braun, P.; and Pazdor, A.G.M. and Cuzzocrea, A., are
the most representative authors of the research
network for GC + DM. Two research networks can be
identified (one represented in blue and the other
represented in red) connected by the author
Cuzzocrea, A.
5 CONCLUSION AND
DISCUSSION
This study makes a pertinent contribution to the
bibliometric analysis. This systematic review
assumes that the researcher follows strict criteria and
a specific methodology to collect and analyze data
from these sources. This study was conducted based
on the results obtained after a bibliometric review,
which helped identify the scope that has given greater
relevance to issues such as DM, BI, GC and UC.
Describing, the relevance of these correlated terms is
due to the fact that there are not enough studies about
this aspect as a way of improving organizations. As a
result, the low number of papers presupposes that few
companies have been using these tools together,
which emphasizes the importance of addressing these
issues in research agendas.
This article analyzes publications between 2015
and 2020, conducted in thousands of publications,
and it was possible to use software such as EndNote,
VOSviewer and Microsoft Excel to obtain and
analyze all data using formulas and functions. It is
important to highlight that bibliometric reviews
cannot be random searches. In other words, different
data sources display different results. Therefore, it is
necessary for the researcher to establish where the
information was extracted from, creating tables and
figures for better visualization. It was observed that
there are not many publications in the area, mainly
concerning utility computing, with only two
publications. Grid computing is more relevant, so we
can infer that the use of grid computing is preferred
to the use of utility computing. Overall, the authors
consider that despite and because of the low number
of publications in the area, this is an area of research
that deserves more attention, because grid and utility
computing is gaining momentum, and it is of
paramount importance to produce research that study
the implementation of data mining and business
intelligence using these types of tools.
There were some limitations to this study. One
main limitation is the low number of publications
available. In addition, when analyzing the Google
Scholar h5-index, the year 2020 was not available at
the time of the search.
ICEIS 2021 - 23rd International Conference on Enterprise Information Systems
372

For future research directions, there is a need to
clarify the differences and similarities of grid
computing and utility computing to determine
whether there is really a need to distinguish between
the two. Another direction for the research is two
consider other related keywords in the search such as
“Cloud Computing”, “SaaS”, and IoT, in order to
obtain more relevant studies.
ACKNOWLEDGEMENTS
This work is financed by portuguese national funds
through FCT - Fundação para a Ciência e Tecnologia,
under the project UIDB/05422/2020.
REFERENCES
Andrés, A. (2009). Measuring Academic Research - How
to undertake a bibliometric study. Oxford, Cambridge,
New Delhi: Chandos Publishing.
Haris, M., & Khan, R. Z. (2018, November 30). A
Systematic Review on Cloud Computing. International
Journal of Computer Sciences and Engineering -
IJCSE, pp. 635-639.
Hussain, M. A., Naser, M., Begum, A., Shaik, N., & Shaik,
M. (2015). DataMining with Grid Computing
Concepts. American Journal of Engineering Research
(AJER), pp. 256-260.
Kaffash, S., Nguyen, A. T., & Zhu, J. (2020, July 06). Big
data algorithms and applications in intelligent
transportation system: A review and bibliometric
analysis. International Journal of Production
Economics, pp. 1-15.
Kurnia, P. F., & Suharjito. (2018). Business Intelligence
Model to Analyze Social Media Information.
ScienceDirect: 3rd International Conference on
Computer Science and Computational Intelligence
2018, pp. 5-14.
Liao, H., Tang, M., Li, Z., & Lev, B. (2018, November 09).
Bibliometric analysis for highly cited papers in
operations research and management science from
2008 to 2017 based on Essential Science Indicators.
Omega - The International Journal of Management
Science, pp. 1-13.
Liu, J., Pacitti, E., Valduriez, P., & Mattoso, M. (2015,
March 8). A Survey of Data-Intensive Scientific
Workflow Management. Journal of Grid Computing,
pp. 457-493.
López-Robles, J. R., Otegi-Olaso, J. R., Arcos, R.,
Gamboa-Rosales, N. K., & Gamboa-Rosales, H. (2018,
December 27). Mapping the structure and evolution of
JISIB: A bibliometric analysis of articles published in
the Journal of Intelligence Studies in Business between
2011 and 2017. Journal of Intelligence Studies in
Business, pp. 9-21.
Malik, M. I., Wani, S. H., & Rashid, A. (2018, April). Cloud
Computing-Technologies. International Journal of
Advanced Research in Computer Science, pp. 379-384.
Monsalve, E. J., Carreño, M. C., Gutiérrez, E. D., Molina,
L. H., & Rangel, J. C. (2019). Theorization on case
studies in business intelligence management on
intellectual capital. Journal of Physics: IV International
Congress / Days of Applied Mathematics, pp. 1-6.
Paul, J., & Criado, A. R. (2020). The art of writing literature
review: What do we know and what do we need to
know? International Business Review, pp. 1-7.
Rahim, R., Zufria, I., Kurniasih, N., Simargolang, M. Y.,
Hasibuan, A., Sutiksno, D. U., GS, A. D. (2018). C4.5
Classification Data Mining for Inventory Control.
International Journal of Engineering & Technology, pp.
68-72.
Ruzgas, T., & Dabulytė-Bagdonavičienė, J. (2017).
Business Intelligence for Big Data Analytics.
International Journal of Computer Applications
Technology and Research, pp. 1-8.
Viloria, A., Acuña, G. C., Franco, D. J., Hernández-Palma,
H., Fuentes, J. P., & Rambal, E. P. (2019, August 19-
21). Integration of Data Mining Techniques to
PostgreSQL Database Manager System. International
Workshop on Applying Data Mining Techniques to E-
Learning and Pedagogical Approaches (ADMEPA), pp.
575-580.
Walsh, I., & Renaud, A. (2017). Reviewing the literature in
the IS field: Two bibliometric techniques to guide
readings and help the interpretation of the literature.
Systèmes d'Information et Management, pp. 75-117.
Data Mining, Business Intelligence, Grid and Utility Computing: A Bibliometric Review of the Literature from 2015 to 2020
373
