
Identifying and Resolving Conflicts in Requirements by
Stakeholders: A Clustering Approach
Ishaya Gambo
1,2 a
and Kuldar Taveter
1b
1
Institute of Computer Science, University of Tartu, Estonia
2
Department of Computer Science & Engineering, Obafemi Awolowo University, Ile-Ife, Nigeria
Keywords: Conflict Resolution, Requirements Engineering, Clustering Algorithm, Delphi Method.
Abstract: Conflicts in requirements are genuine analysis and design problems that require appropriate methods to
reconcile different views, goals, and expectations by stakeholders. The research question addressed in this
paper is how can conflicts in requirements elicited from different stakeholders be solved to avoid failure of
the resulting software-intensive system? We propose a framework for conflict identification and resolution
based on expert-based and clustering techniques for conflict resolution. The research method is a mixture of
quantitative and qualitative methods by employing clustering and expert-based techniques for conflict
resolution. The results demonstrate two essential features of conflict resolution in requirements engineering:
(i) the ability to cater for a large volume of requirements in a multi-stakeholder setting; and (ii) the ability to
effectively make precise decisions for minimizing conflicts between prioritized sets of requirements expressed
by the stakeholders. The framework and the interactive system have been validated in analyzing requirements
for a pharmacy information system. The contributions of the paper are an expert-based framework for
resolving conflicts and an interactive system that empirically proves the adequacy of the framework. The
main threat to validity is that the developed framework is yet to be validated in other problem domains.
1 INTRODUCTION
Identification and resolution of conflicts are genuine
problems in requirements engineering (RE) that can
positively impact many application domains. It is
relevant in the world that relies heavily on
successfully solving complex design problems
involving many different stakeholders. Resolving
conflicts in requirements helps to increase the
economic value of software-intensive systems
designed to tackle such problems. Consequently,
requirements engineers have to manage many diverse
expectations, desires, goals, motivations, and
emotions by stakeholders, especially in conflicting
situations.
Remarkably, our research views conflicts as
harnessing positive aspects of the problem domain,
meaning that conflicts should be reconciled rather
than suppressed (Deutsch, 1973). Due to the conflicts
involving many diverse stakeholders, requirements
engineers face several difficulties when deciding
a
https://orcid.org/0000-0002-1289-9266
b
https://orcid.org/0000-0003-3074-7618
about the priorities and order of implementing the
requirements (Ahmad, 2008; Gupta and Gupta,
2018).
Against the background described in the two
preceding paragraphs, conflict in requirements can be
defined as the disagreement between two or more
viewpoints by various stakeholders on some
decisions or values proposed in a software
engineering process (Aldekhail, 2016). Conflicts are
unavoidable, especially at the RE stage since it deals
with humans (Maalej and Thurimella, 2009; Castro-
Herrera and Cleland-Huang, 2010) whose needs are
virtually insatiable. In this context, humans are
different stakeholders working collaboratively (Kwan
and Damian, 2011), whose views require
harmonization. Different stakeholders have similar
needs but different viewpoints on how these might be
implemented. Conflicts emerge because stakeholders
seek to achieve mismatching goals (Boehm et al.,
2000).
158
Gambo, I. and Taveter, K.
Identifying and Resolving Conflicts in Requirements by Stakeholders: A Clustering Approach.
DOI: 10.5220/0010526901580169
In Proceedings of the 16th International Conference on Evaluation of Novel Approaches to Software Engineering (ENASE 2021), pages 158-169
ISBN: 978-989-758-508-1
Copyright
c
2021 by SCITEPRESS – Science and Technology Publications, Lda. All rights reserved

Conflicts in requirements can be caused by
different conceptualizations and interpretations of the
given problem domain by various stakeholders. Also,
a conflict in requirements can occur due to the
perception of an interest that is frustrated by another
interest (Barchiesi, 2014). This kind of conflict can be
integrated with resentment and divergence of
interests, making negotiation difficult in the process
(Saaty, 1990).
This paper is concerned with identifying and
resolving conflicts between expectations by multiple
stakeholders. The importance of identifying and
resolving conflicts in requirements is well-known in
practice and acknowledged by the RE research
community (Van Lamsweerde et al., 1998;
Bendjenna et al., 2012). The paper aims to improve
the resolution of conflicts in requirements elicited
from different stakeholders.
The research question addressed by the paper is:
How can the conflicts that arise from
requirements elicited from different stakeholders
in a given problem domain be resolved in order to
avoid failure in the resulting software-intensive
system? Here the failure means that all stakeholders
are not satisfied, and the system becomes difficult to
use. This question is answered analytically in Section
2 and empirically in Sections 3 and 4 of this paper.
This paper has three contributions. (i)
Methodologically, we have developed a framework
that combines expert-based and clustering techniques
for resolving conflicts in requirements. We have also
evaluated the framework in a real-life case study. (ii)
Practically, we have developed an interactive system
that empirically provides evidence to support the
adequacy of our framework. We have evaluated the
interactive system with the experts and other
stakeholders of the chosen problem domain. (iii)
Analytically, we have presented a dataset of
requirements with their weight scales, which could
form the basis for resolving conflicting views by
stakeholders by means of applying scientific criteria.
The rest of this paper is structured as follows. In
Section 2, we discuss the research methodology
explaining the approaches used. Section 3 describes
the empirical analysis and the conflict resolution
system implemented by us that confirms the strength
of the framework put forward by us. The model
validation process is discussed in Section 4, and the
results are described in Section 5. Section 6 presents
the discussion. The related work is reviewed in
Section 7. Finally, the threats to validity are analyzed
in Section 8, and the conclusions and future work are
presented in Section 9.
2 RESEARCH METHODOLOGY
In this study, we employed quantitative and
qualitative case study research approaches (Yin,
2017; Coolican, 2009). Our research is based on both
positivist (quantitative) and interpretivist (qualitative)
philosophies by respectively employing clustering
and expert-based techniques for conflict resolution in
RE. The positivist (quantitative) aspect considers the
phenomenon that is measurable by using statistical
instruments. This is complemented by the
interpretivist (qualitative) approach that helps to
understand the phenomenon without searching for
determinism or universal laws (Rombach et al., 1993)
and supports the interpretation of outcomes based on
the context, participants, and resources.
We used in our research the statistical instruments
embedded in the Delphi method (Keeney et al., 2011)
and developed the clustering technique used for
measuring the similarity of requirements. While the
Delphi technique provides support for setting
priorities and gaining consensus on an issue, the
clustering approach offers the potential to coordinate
consequently and proficiently large numbers of
requests by different stakeholders and organize the
resulting requirements into a coherent structure.
We modified the Delphi technique for filtering
and ranking of requirements and for a considerable
reduction of duplication. The modified Delphi
method is an expert-based technique that ensures the
reliability and creativity of various ideas explored and
relevant information for decision making. The
modified Delphi process was conducted in two (2)
rounds that had the following respective purposes: (i)
setting priorities; (ii) gaining consensus. The choice
of the Delphi method was based on this technique
being widely recognized as a "consensus-building
tool" (Shyyan et al., 2013), which has been applied as
a means of cognition and inquiry in a variety of fields
including RE.
The modified Delphi technique is similar to the
full Delphi method in terms of procedure (i.e., a series
of rounds with selected experts) and intent (i.e., to
predict future events and arrive at a consensus). In our
case, the significant modification consists of the
stages described in our reconciliation framework in
section 2.1.
We engaged experts to resolve the conflicting
requirements. The experts who were engaged in the
modified Delphi process were the pharmacists. They
were selected based on the number of years of
experience. They had the same background and
training, but as humans, had different values that
made conflicts between their viewpoints inevitable.
Identifying and Resolving Conflicts in Requirements by Stakeholders: A Clustering Approach
159
2.1 The Reconciliation Framework
The Reconciliation Framework developed by us
consists of streamlined methods for describing and
reconciling stakeholders' views about the system
being designed. The framework suggests a process
flow that is iterative and incremental. It offers an
evolutionary feel that is essential in modern software
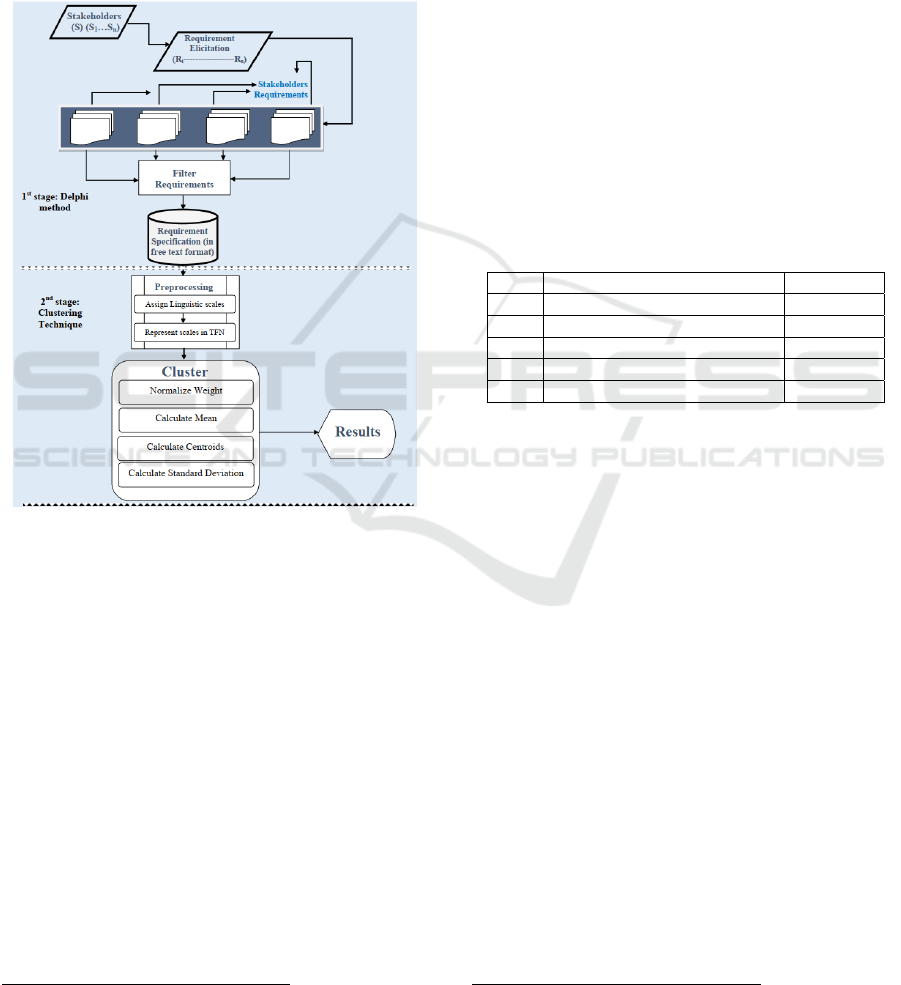
engineering processes. Figure 1 describes the basic
flow of the Reconciliation Framework.
Figure 1: The flow of the Reconciliation Framework.
The Reconciliation Framework consists of the
two stages represented in Figure 1:
1. The first stage of the framework employs the
modified Delphi method. This stage consists of the
following steps that are performed in two
iterations:
(a) Elicit requirements using qualitative
interviews, quantitative surveys, brainstorming
sessions, focus group approaches, scenario
generation, and/or other elicitation techniques;
(b) Filter the lists of requirements by synthesizing
a master list of requirements. The master list of
requirements is drawn from interviews with
selected experts with related competency
profiles. The master list of requirements
expresses the opinions by the experts and the
expectations extracted from the interviews.
3
https://doi.org/10.5281/zenodo.4603841
2. The second stage of the framework comprises the
identification of conflicts and the application of the
clustering approach. This stage consists of the
following steps:
(a) Prioritize the requirements based on the
stakeholders' ranking scales expressed by
linguistic variables shown in Table 1. The
corresponding weight values for the linguistic
variables used for rating the requirements are
presented in Table 1. In our case study, the
ranking scales captured for each stakeholder on
each requirement analyzed in the second stage
of the framework are presented in Appendix A
3
.
(b) Obtain the preference weights for requirements
prioritized by different stakeholders using the
weight scales described in Table 1. In our case
study, the weights assigned by each
stakeholder to each requirement in the second
stage of the framework are presented in
Appendix B
4
.
Table 1: Ranking and weight scales.
No Linguistic variables Weight
1 Very High (VH) 5
2 High (H) 4
3 Medium (M) 3
4 Low (L) 2
5 Very Low (VL) 1
We will explain in Section 2.2 how the
Reconciliation Framework depicted in Figure 1 is
used for identifying and resolving conflicts between
requirements.
2.2 Conflict Identification and
Resolution
We applied Kendall's Coefficient of Concordance
(KCoC) (Kendall and Smith, 1939) to identify the
existence of conflicts based on the weights assigned
to each requirement by each stakeholder. KCoC is a
statistical test for evaluating consensus and
conducting several rankings for N objects or
individuals. Given k sets of rankings, KCoC was used
to determine the associations among these rankings.
It also served as a measure of agreement among the
stakeholders. We denote KCoC as W and define it as
follows:
Definition 1: Let us assume that the m number of
stakeholders has assigned a weight to the k number of
requirements ranging from 1 to k. Let r
ij
stand for the
rating that the stakeholder j gives to the requirement
4
https://doi.org/10.5281/zenodo.4603824
ENASE 2021 - 16th International Conference on Evaluation of Novel Approaches to Software Engineering
160

i. For each requirement i, let 𝑅
=
∑
𝑟𝑖𝑗
and let 𝑅
be the mean of the R
i
, and let R be the squared
deviation (Siegel and Castellan, 1988), that is:
𝑅 =
∑
(
𝑅
− 𝑅
)
(1)
Now W is defined by:
𝑊=
∑(
)
(
)/
(2)
where K is the number of sets of rankings, i.e., the
number of stakeholders; N is the number of
requirements ranked; R
i
is the average weight
assigned to the ith requirement. R is the average (or
grand mean) of the weights assigned across all
requirements.
Based on the Wilcoxon Rank Sum Test (Siegel
and Castellan, 1988), if all the stakeholders are in a
complete agreement (that is, they give the same rating
to each of the requirements), then by Definition 1, W
= 1. If all the values of Ri are the same (that is, if the
stakeholders are in a complete disagreement), then by
Definition 1, W = 0. Most often, 0 ≤ W ≤ 1.
We used Algorithm 1 presented below based on
equation (2) to identify the existence of conflicts.
When computing the value of W, we arranged the
dataset into a k x N table with each row representing
the weights assigned by a particular stakeholder to N
requirements. After that, each column of the table was
summed up and divided by k to find the average rank
Algorithm 1: Algorithm for conflict identification.
Input: k: number of stakeholders (integer); D[row][col]: data
set in form of k*n; n: number of requirements (integer); R
i
average of the weight; R average of all objects
Output: W
BEGIN
Display “Enter number of stakeholders”;
Enter k
Display “Enter number of requirements”;
Enter n;
//initialize the dimension of data set
D[k][n];
1: Foreach (int i=0, i<k, i++) //iteration until n, form i to k
2: foreach (int j =0, j<=n, j++)
3: r
ij
+= j*(j+1)/2;
4: enter D[i][j];
5: endforeach
6: R
i
= r
ij
;
7: 𝑹
+ = R
i
;
8: R = (R
i
- R
i
)
2
;
9: W = R / (n(n
2
– 1) / 12);
10: If (W=0)
11: Message “There are conflicting expectations”;
12: elseif (W = 1)
13: Message “No conflict”;
14: Endif;
15: Endforeach
16: Return message;
17: END
R
i
. The resulting average ranks were then summed
and divided by k to obtain the mean value of the
values of R
i.
We expressed each of the average ranks
as a deviation from the grand mean. This way, we
computed W, according to equation (2).
In equation (2), N(N2 – 1)/12 is the maximum
possible sum of the squared deviations: the numerator
which would denote a seamless understanding among
the k rankings. If W = 0, it means that there are
conflicting expectations based on the subjective
weights assigned by each stakeholder, i.e., there is a
conflict. If W = 1, it means that the stakeholders agree
about the weights they assigned to each requirement,
i.e., there is no conflict. Values between 0 and 1 are
approximated to the values 0 and 1 to represent the
variability ratio for evaluating consensus (Kendall
and Smith, 1939). In our case, the KCoC was
calculated to be 0.000115598 ≈ 0.00, which by
approximation is 0.
We used the K-Means clustering algorithm (Tan
et al., 2006; Balabantaray et al., 2015) to resolve
conflicts by grouping the datasets of requirements
based on the weights assigned to them into classes of
similar requirements which are called clusters. The
weights assigned to the requirements R
i
…R
n
by each
stakeholder S
i
represent the attributes. Each
stakeholder represents an instance in a class (cluster)
as specified in the dataset. In this paper, the K-Means
algorithm is represented as Algorithm 2 below.
We used the clustering approach to establish a
plan for conflict resolution. Two major activities of
the clustering approach are data preprocessing and
data clustering. We preprocessed the dataset and
applied Algorithm 2 (Tan et al., 2006; Balabantaray
et al., 2015) to divide the requirements into clusters.
Algorithm 2 calculates distances between each point
of the dataset and the center by utilizing the Euclidean
distance measure (Tan et al., 2006; Hennig et al.,
2015). In addition, Algorithm 2 automatically
normalizes numerical attributes in the process of
computing the Euclidean distance (Das et al., 2007;
Chawla and Gionis, 2013; Tan et al., 2006).
We used Algorithm 2 to obtain the clusters and the
set of the most desirable requirements. First, the
algorithm takes the number of clusters K as input and
generates the initial clusters from the dataset.
Secondly, the algorithm computes each cluster's
average in the dataset to determine the relative
closeness degrees and consistency indexes of the
cluster's requirements. Also, Algorithm 2 assigns each
individual record in the dataset to the most similar
cluster using the Euclidean Distance Measure (Hennig
et al., 2015). Algorithm 2 is iterative and ensures the
evolvement of stable clusters (Haraty et al., 2015).
Identifying and Resolving Conflicts in Requirements by Stakeholders: A Clustering Approach
161

Algorithm 2: The K-Means algorithm for clustering.
Input: k: number of clusters (integer); D[row][col]: data set in
form of k*n; n: number of object (integer); random_value
(integer); sum (integer); sum_cluster (integer)
Output: the set of clusters
BEGIN
Display “Enter number of clusters”;
Enter k
Display “Enter number of objects”;
Enter n;
//initialize the dimension of data set
D[k][n];
1: Foreach (int i=0, i<k, i++) //iteration until ii from 0 to k
2: foreach (int j =0, j<n, j++)
3: Enter D[i] [j];
4: random_value=rand(1 to k+1) // calculate random
value of objects entered
5: //initial cluster centers
6: Foreach (int k=0, k<random_value, k++)
7: cluster_centers [k] = D [i][j];
8: endforeach
9: dist = square((k-i)
2
+ (k-j)
2
); //determine which k
(clusters) is closer
10: if(dist=j)
11: sum +=i;
12: endif
13: endforeach
14: sum_cluster +=sum;
15: endforeach
16: return sum_cluster;
17: END
We used Algorithm 2 to obtain the clusters and the
set of the most desirable requirements. First, the
algorithm takes the number of clusters K as input and
generates the initial clusters from the dataset.
Secondly, the algorithm computes each cluster's
average in the dataset to determine the relative
closeness degrees and consistency indexes of the
cluster's requirements. Also, Algorithm 2 assigns
each individual record in the dataset to the most
similar cluster using the Euclidean Distance Measure
(Hennig et al., 2015). Algorithm 2 is iterative and
ensures the evolvement of stable clusters (Haraty et
al., 2015).
3 EMPIRICAL EVALUATION
We applied the research methodology described in
Section 2 to the case study of requirements
engineering for the Pharmacy Information Systems to
be developed for the Obafemi Awolowo University
Teaching Hospital Complex (OAUTHC). We
adopted the case study approach (Yin, 2017;
Coolican, 2009) for the data collection and analysis
5
https://doi.org/10.5281/zenodo.4603848
6
https://doi.org/10.5281/zenodo.4603824
process. The case study approach involved multiple
data collection methods such as interviews, a
workshop, scenario generation, and document
analysis.
The interview process followed the principles
outlined by Yin (2017) and Coolican (2009). The
interviews consisted of predefined questions and open
discussion. Thirty staff members from ten sub-units of
the Pharmacy Department were interviewed (see
Appendix 2
5
). After the interviews, the first author
conducted a workshop session with heads of the sub-
units to determine the requirements that emerged from
the interviews into a master list of requirements.
We used the dataset that was ranked by the
stakeholders and was made available in a spreadsheet
format (requirement-datasetN.csv)
6
as the input data
for clustering. The Euclidean distance between
individual requirements and clusters was computed
for each element in the dataset, as is explained in
Section 2. Appendix 1
7
shows the normal distribution
of the first twenty-five (25) requirements with their
corresponding minimum and maximum values, the
mean and standard deviation (stdev). The distribution
indicates that the data is in its normalized form, which
allows the data to be scaled to fall within a specified
range for clustering. Normalizing the dataset helped
to determine the Euclidian distance sensitive to
differences in the attributes' magnitude or scales (De
Souto et al., 2008).
We completed the empirical evaluation of the
Reconciliation Framework described in Section 2.1
by means of an interactive system, "Requirement
Clustering for Conflict Resolution" (ReqCCR)
designed and implemented by us (Gambo, 2016).
ReqCCR generates a list of prioritized requirements
organized into clusters based on relative weights
assigned to the requirements elicited from the
stakeholders. The normalized dataset of requirements
was used as an input to the ReqCCR tool.
During the clustering process, we set for the
ReqCCR system the total number of clusters K as 5.
We clustered one hundred and one (101)
requirements by means of Algorithm 2, which has
been implemented by the ReqCCR system, resulting
in 5 clusters
8
.
3.1 Analysis of Clusters
Algorithm 2 split the requirements R
i
…R
n
into k
clusters in which each requirement belongs to the
cluster with the nearest mean. The analysis of clusters
7
https://doi.org/10.5281/zenodo.4603860
8
https://doi.org/10.5281/zenodo.4603866
ENASE 2021 - 16th International Conference on Evaluation of Novel Approaches to Software Engineering
162
requires examining the cluster centroids (Faber,
1994). The cluster centroids are the mean vectors for
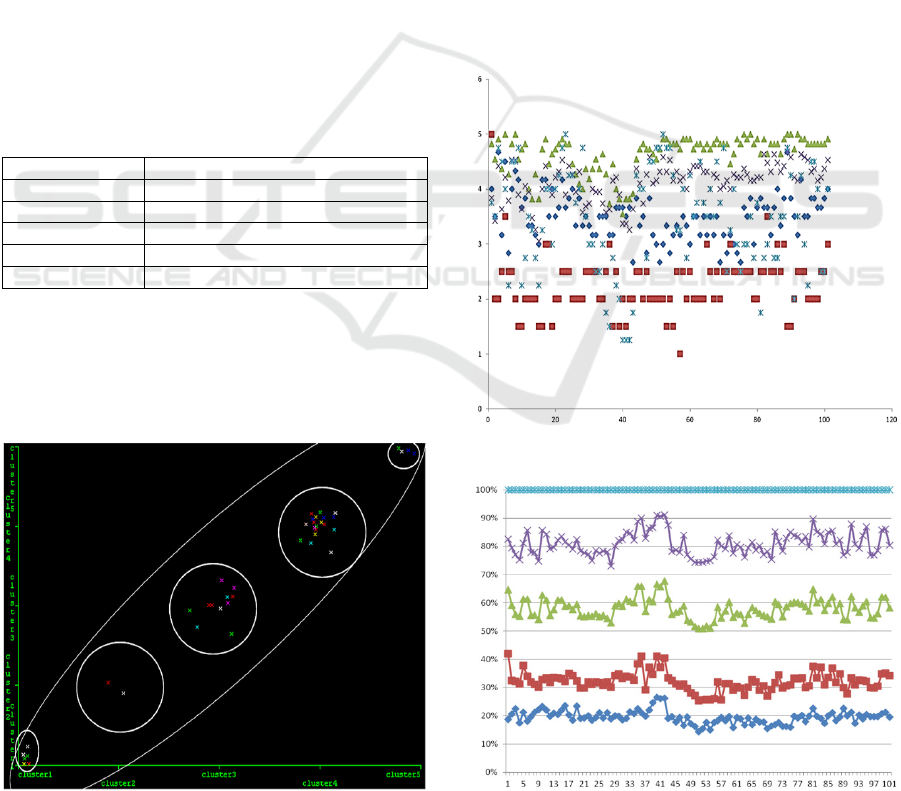
each cluster. Table 2 shows the cluster output
consisting of the numbers of clustered instances and
their relative percentages. They respectively express
the numbers and percentages of requirements
assigned to different clusters. For example, cluster 4
had 45% of the overall clustered instances.
The implementation of Algorithm 2 considered
the means of weights assigned to the requirements by
the stakeholders and their stdev so that each cluster
was defined by the mean, forming its center and stdev,
forming its perimeter or radius. The stdev for each
requirement in a cluster indicates how tightly the
given clustered requirement is located around the
centroid of the cluster's dataset. We used the "mean
of means" to assess how the values are spread either
above or below the mean. We hypothesize that a high
stdev value, as indicated in each cluster, implies that
the data is not tightly clustered (i.e., is less reliable
and consistent), while a low stdev value indicates that
the data is clustered tightly around the mean.
Table 2: Cluster output showing the clustered instances and
percentages.
Cluster number Clustered instances and percentage
1 6 (14%)
2 2 (5%)
3 11 (26%)
4 19 (45%)
5 4 (10%)
3.2 Clustering Output
Five different clusters
8
resulted from the normalized
dataset
7
that was used as an input for Algorithm 2,
implemented by the ReqCCR system.
Figure 2: Visualized cluster assignments.
In the five clusters determined by the algorithm, each
instance of the elicited requirements belongs to one
and only one cluster. The five clusters
8
reflected the
responses by the stakeholders based on the weights
they had assigned to each requirement.
Figure 2 visualizes cluster assignments, and
Figure 3 shows a scattered chart comparing a
selection of cluster centroids, where centroids of each
cluster are represented as separate points. The x-axis
in Figure 2 represents the clusters, and the y-axis
indicates the number of instances in each cluster. The
x-axis in Figure 3 represents the number of instances,
while the y-axis represents the clusters. As is reflected
by Figure 3, clusters 3 and 4 have the highest values
of cluster centroids, which have been respectively
indicated by the green triangles (Δ) and purple cross
shapes (×). The centroids of cluster 4 are closer to
each other, and cluster 4 is also the cluster with the
highest number of clustered instances. On the other
hand, the centroids of cluster 2 indicated by the red
rectangles ( ) are far from each other.
Figure 3: A scattered chart comparing cluster centroids.
Figure 4: Percentages of cluster centroids.
Identifying and Resolving Conflicts in Requirements by Stakeholders: A Clustering Approach
163

Figure 4 shows how the percentages of cluster
centroids contributed overtime during the iteration.
This indicates the ordered categorization of the
clusters. The x-axis represents the numbers of
instances, and the y-axis represents the percentages of
the cluster centroids.
3.3 Selecting the Clusters
We used the following techniques to decide on the
final results:
(1). Inspecting the stdev value to eliminate clusters
with relatively high stdev values. In the context of
our research, the stdev value measures how well
the stakeholders agree with each other. The lower
the stdev value, the stronger is the agreement
level. A low stdev value implies that most of the
requirements' instances are exceptionally close to
the centroids and more reliable. A high stdev
value implies that the instances are spread out
(Han et al., 2014; Steinbach et al., 2005). The
stdev value for each instance in a cluster
determines how dispersed (spread out) the data is
from the cluster's centroid. Therefore, the stdev
value establishes the centroid, giving a
meaningful representation of the dataset. For
example, the stdev value 0 would mean that every
instance is exactly equal to the centroid. The
closer the stdev is to 0, the more reliable the
centroid is. Also, the stdev value close to 0
indicates very little volatility in the sample.
(2). Computing the average of each cluster's stdev
value to determine the clusters with the highest
and lowest stdev values. As a result, the average
stdev values for the clusters 1, 2, 3, 4 and 5 are
respectively 0.95, 0.78, 0.61, 0.86 and 1.31.
Thus, the cluster with the highest stdev value is
cluster 5, while the one with the lowest stdev
value is cluster 3. Also, by inspection, 81.19%
of all the attributes with the lowest stdev value
belong to cluster 3, while 18.81% of all the
attributes with the lowest stdev value belong to
other clusters (i.e., 1, 2, 4, and 5).
(3). Inspecting the number of instances assigned to
each cluster. As is reflected by Table 2, clusters
1, 2, and 4 have a few instances allocated to them,
making these clusters inappropriate for any
meaningful decision. Clusters 3 and 4 have 11
and 19 instances allocated to them, respectively.
3.3.1 Resolution on the Final Cluster Output
By comparing the average stdev value of each cluster
with the cluster's corresponding average centroid
value, cluster 3 appeared to be the most reliable one.
We observed that eighty-two (82) requirements out of
the one hundred and one (101) requirements in cluster
3 had the lowest stdev value within all of the five
clusters, while the remaining nineteen (19)
requirements had the lowest stdev value within the
clusters 1, 2, 4 and 5.
Secondly, even though cluster 4 had the highest
number of instances assigned, this was not the most
reliable and suitable criterion for decision-making.
Instead of that, a decision on which cluster to use was
based on the cluster with the lowest average stdev
value. Deciding by the cluster outputs
8
, cluster 3
appears to be the most reliable one because, for each
requirement instance, the stdev value is very low (i.e.,
between 0.00 to 1.50) compared to the other clusters.
4 MODEL VALIDATION
The confusion matrix in Table 3 summarises our
model validation results. The confusion matrix shown
in Table 3 contains information about the actual and
predicted classifications used as a measure of the
model performance
Table 3: Confusion matrix of K-Means clustering.
Predicted
Actual
4 0 0 4 0
1 2 0 0 0
0 0 11 0 0
0 0 0 15 0
1 0 0 0 4
In Table 3, the columns are the predicted values,
and the rows are the actual values. In addition, we
used the recall and precision values as the respective
metrics to evaluate the completeness and consistency
of the model for the data presented in the matrix. The
following statements explain the implications of the
confusion matrix shown in Table 3:
In cluster 1, 4 predicted requirement instances
out of the 8 actual instances were correctly
clustered;
In cluster 2, 2 predicted requirement instances
out of the 3 actual instances were correctly
clustered;
In cluster 3, all of the predicted requirement
instances (11) were correctly clustered;
In cluster 4, all of the predicted requirement
instances (15) were correctly clustered;
In cluster 5, 4 predicted requirement instances
out of the 5 actual instances were correctly
clustered;
ENASE 2021 - 16th International Conference on Evaluation of Novel Approaches to Software Engineering
164
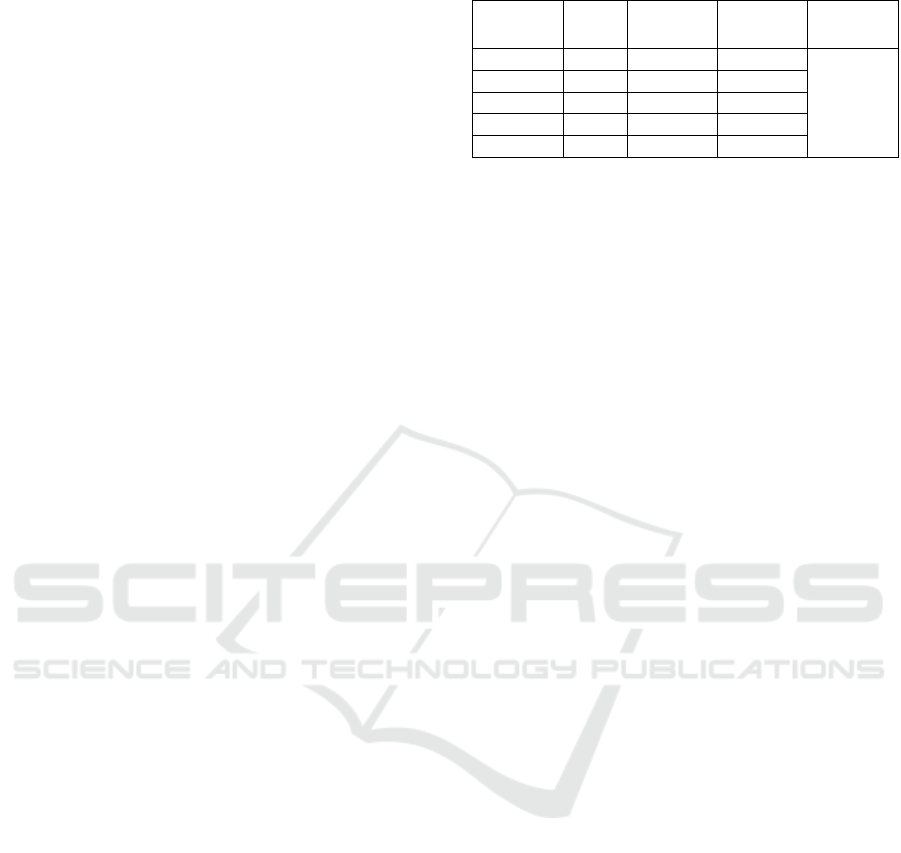
There were 6 incorrectly clustered requirement
instances, which is 14.29 % of the entire dataset.
We calculated the recall and precision rates based
on the preceding statements and computed the F-
Measure conveying the balance between the recall
and precision. The recall, denoted by R, also known
as sensitivity, is the proportion of the actual positive
cases that have been correctly identified. The
precision, denoted by P, is the proportion of the
positive cases that have been correctly identified. We
also calculated the F-Measure that is the degree of the
test's accuracy, to determine the harmonic mean of the
recall R and precision P for each of the clusters for
which the recall and precision have been calculated.
We also evaluated the accuracy of the model to
determine the total number of correct predictions
using equation 6. The accuracy was useful in
determining whether the resolution resulting from the
model reflected the opinions by the stakeholders. The
equations that were respectively used for calculating
R, P, F-Measure, and Accuracy are presented as the
formulae 3, 4, 5, and 6 below:
R = TP/(TP+ FN) (3)
P = TP/(TP+ FP) (4)
F-Measure = 2*(P*R)/(P+R) (5)
Accuracy = (TP+TN)/(TP+TN+FP+FN) (6)
In equations 3 to 6, TP is the number of true
positives, FN is the number of false negatives, FP is
the number of false positives, and TN is the number
of true negatives.
5 RESULTS
The performance evaluation results of implementing
Algorithm 2 are shown in Table 4. We used the recall
and precision values as metrics to evaluate the
completeness and consistency of the five clusters
8
.
Cluster 3 appeared to be the most effective one with
the value 1 (100%) of both the recall and precision.
With the choice of cluster 3 for the final resolution,
this result demonstrated that the model is complete
and consistent. The total value of false negative
requirement instances defines the number of
incorrectly clustered instances, which was 6.0
(14.29%).
Table 4: Performance evaluation results.
No. of
Cluster
Recall Precision F-Measure
Accuracy
of model
Cluster 1 0.50 0.67 0.57
= 0.857 =
85.71%
Cluster 2 0.67 1.00 0.80
Cluster 3 1.00 1.00 1.00
Cluster 4 1.00 0.78 0.88
Cluster 5 0.80 1.00 0.89
Clusters 3 and 4 had the 100% recall, while
clusters 1, 2, and 5 had the 50%, 66.7%, and 80%
recalls, respectively. Consequently, all of the positive
cases correctly identified by the model belong to
clusters 3 and 4. However, the performance
evaluation indicated 100% precision for clusters 2, 3,
and 5, respectively, while clusters 1 and 4 had 66.7%
and 78.95% precisions, respectively. The F-measure
shows that the harmonic means of precision and recall
were 0.57, 0.80, 1.00, 0.88, and 0.89 for the
respective clusters 1, 2, 3, 4, and 5.
The F-Measure of cluster 3 – with the value of
1.00 (100%) – is the most effective and reliable one.
This value of the F-Measure strongly indicates that all
of the instances belonging to cluster 3 were correctly
clustered. Consequently, inspecting and comparing
both the recall and precision proves that cluster 3 has
the highest percentage of positive cases correctly
identified. This outcome justifies why cluster 3 is the
most reliable one for the final resolution.
In conclusion, the Reconciliation Framework
developed by us for resolving conflicts in
requirements achieved an overall accuracy of
85.71%. Moreover, this approach can cater for as
many requirements as needed for any software
engineering project. It can be adapted to solve a wide
variety of decision-making and selection problems
about the order of implementing requirements.
6 DISCUSSION
In the case study conducted by us, the value of
Kendall's Coefficient of Concordance W was
calculated by using equation (2) based on the dataset
consisting of one hundred and one (101) requirements
elicited from forty-two (42) stakeholders. The resulting
value of W was 0.000115598 ≈ 0.00. This value of W
indicated some level of disagreement between the
subjective views by the stakeholders, which means
there are conflicts in the stakeholders' expectations.
After the clustering analysis, cluster 3 emerged as
the final solution based on the conditions outlined in
Identifying and Resolving Conflicts in Requirements by Stakeholders: A Clustering Approach
165

Section 3.3. The final solution
9
is presented in the order
of priorities assigned to all of the requirements. In
particular, 77 requirements had a "very high" priority,
corresponding to 76.24% of the entire set of
requirements. On the other hand, 24 requirements had
a "high" priority, corresponding to 23.76% of the entire
set of requirements. The evaluation of the model for
completeness and consistency indicated the 100%
recall and precision of the final solution (cluster 3), and
the 85.7% accuracy of the resulting model.
Theoretically, our research confirmed that there is
no perfect system. However, with 14.29% of
incorrectly clustered instances, the experts in our case
study – the pharmacists – agreed that the results were
good enough for resolving the conflicting subjective
views that arose during the requirements analysis.
7 RELATED WORK
Earlier work on conflicts in RE focused on the
identification and resolution of requirements in
general terms (Barchiesi et al., 2014; Hartwell, 1991;
Kim et al., 2007). For example, Ross et al. (2006) and
Barchiesi et al. (2014) have observed that conflicts
are resolved through negotiations involving human
participants. Nevertheless, the negotiation approach
could not deliver expected satisfaction by the
stakeholders (Nuseibeh and Easterbrook, 2000). In
the study by Boehm et al. (1995), the Win-Win
technique was introduced to cater to risks and
reconcile uncertainties through a negotiation
approach. Still, the approach suffers from some
setbacks in selecting a resolution plan and scalability.
Other research works have focused on conflicts in
particular kinds of requirements and systems, such as:
conflicts among non-functional requirements (Poort
and de With, 2004; Liu, 2010); conflicts in pervasive
computing systems (Khaled et al., 2017); compliance
requirements (Maxwell et al., 2011); requirements
classification (Yang et al., 2005), web application
requirements (Escalona et al., 2013); contextual
requirements (Ali et al., 2013); requirements in
aspect-oriented RE (Brito et al., 2013), and
requirements in goal-oriented RE (Van Lamsweerde
et al., 1998).
The formal and heuristical approach used by van
Lamsweerde et al. (1998) focused on identifying
conflicts between requirements by multiple
stakeholders specified as goals. The method by van
Lamsweerde et al. (1998) deals with matching these
goals with existing domain-specific divergence
9
https://doi.org/10.5281/zenodo.4603873
patterns, which was based on previous experiences in
conflict detection.
While some of the techniques – such as the one
by Van Lamsweerde et al. (1998) mentioned above –
just uncover conflicts, some other researchers (Viana
et al., 2017; Mairiza et al., 2013) have proposed
frameworks that are yet to be implemented and
evaluated in real-life case studies.
Veerappa and Letier (2011) applied the clustering
techniques in RE by grouping requirements into
clusters to determine their similarities to understand
the preferences by the stakeholders and explain the
relationships between the requirements. Clustering
techniques have also been used for decomposing the
systems (Hisa and Yaung, 1988; Yaung, 1992),
modularizing the software (Al-Otaiby et al., 2005),
requirements reuse (Lim, 1994; Benavides et al.,
2006), and requirements quality improvement (Davis
et al., 1993; Lim, 1994; Zhang and Zhao, 2006).
Differently from these research works, we used a
clustering approach to establish the framework for the
practical conflict resolution process for requirements.
8 THREATS TO VALIDITY
The Reconciliation Framework developed in this
paper to identify and resolve conflicts in requirements
has two kinds of threats to validity.
Internal Validity. The first threat to internal validity
is eliciting, analyzing, and understanding the views
by the stakeholders while trying to identify the
existence of conflicts. We mitigated this by involving
experts – pharmacists – in the process prescribed by
the Reconciliation Framework, who have many years
of experience in the problem domain. Although these
experts have common backgrounds and training, they
can coherently explain the views by different
stakeholders to avoid the exclusion of view(s) and
obtain consensus.
Another threat to internal validity is the
presentation and acceptance of our results. We
mitigated this by demonstrating the interactive
system to the experts of the problem domain. We
showcased the scientific process inherent in the
solution to justify the resolution procedure. Since the
exerts involved in our case study were scientifically
inclined, they agreed with the results.
ENASE 2021 - 16th International Conference on Evaluation of Novel Approaches to Software Engineering
166

External Validity. A threat to external validity is that
the developed framework is yet to be validated in
other problem domains within and outside the
healthcare domain. Also, even while our research was
conducted in the healthcare domain, the research was
confined to only a subset of this problem domain.
However, we anticipate that our case study's overall
results can be repeated to identify and resolve
conflicts in a different problem domain where a large
number of stakeholders are involved. Besides, we
have explained and demonstrated our approach to
some software engineers. They have provided
positive feedback indicating that the framework
proposed by us is required to determine the order of
the requirements to be implemented during the
software engineering process (Gambo, 2016).
9 CONCLUSIONS AND FUTURE
WORK
The research work reported in this paper has
developed the Reconciliation Framework for
identifying and resolving conflicts in requirements.
The approach employed by us consists of the
combination of the modified Delphi method and the
clustering technique. The application of the
algorithms presented in this paper to resolving
conflicts in requirements is a notable contribution.
We presented a dataset of requirements according to
their weight scales and used these scales as the basis
for resolving conflicting subjective views by
stakeholders in RE.
Our framework classifies the ranked requirements
by computing the centroids and standard deviations
for each requirement. This implies that software
engineers can use our framework to determine the
most valued and least valued requirements, which
will help in planning for software releases to avoid
breaches of contracts and agreements and will
increase trust. Our research results also demonstrate
that the framework can accommodate large sets of
requirements by multiple stakeholders by resolving
conflicts between these requirements at a very high
level of precision. An important advantage of our
approach is proposing an alternative measure to arrive
at a consensus between the stakeholders.
Finally, we know that it is essential to evaluate the
scalability of the framework proposed by us and our
prototype tool with an increasing number of
requirements and stakeholders in other real-life
projects. Further research can also combine our
strategy with the methods and tools for data mining
and analysis. Specifically, we envisage that additional
techniques and algorithms can complement the
spectrum of existing techniques and algorithms in
addressing conflicts between goal-oriented
requirements elicited for socio-technical systems
(STS) in several domains. In this area, a special
feature of goal-oriented requirements can be
exploited, which relates requirements to each other
within a hierarchy of goals (Miller et al., 2014). As a
side effect, an increase in the number of goals within
a goal hierarchy will exponentially increase the
volume of requirements to be analyzed and
reconciled. Additionally, it will be useful to draw on
some of the literature in psychology to address some
of the challenges stakeholders face in dealing with
their goals individually and collectively. In particular,
we observed that since emotions are individually
constructed (Taveter et al., 2019), there is a need to
investigate, discover and reconcile conflicts that are
usually present when eliciting emotional or affective
requirements for STS.
ACKNOWLEDGEMENTS
The research reported in this paper has been
supported by the Mobilitas Pluss Postdoctoral
Researcher Grant MOBJD343 awarded to the first
author.
REFERENCES
Ahmad, S., 2008, March. Negotiation in the requirements
elicitation and analysis process. In the 19th Australian
Conference Proceedings on Software Engineering,
(ASWEC 2008), Australia, 683- 689.
Al-Otaiby, T. N., AlSherif, M., Bond, W. P., 2005. Toward
Software Requirements Modularization using
Hierarchical Clustering Techniques. In Proceedings of
the 43rd Annual Southeast Regional Conference–Volume
2 (Kennesaw, Georgia, March 18–20), 223–228.
Aldekhail, M., Chikh, A. and Ziani, D., 2016. Software
requirements conflict identification: review and
recommendations. In the International Journal of
Advanced Computer Science and Applications, 7(10),
326-335.
Ali, R., Dalpiaz, F. and Giorgini, P., 2013. Reasoning with
contextual requirements: Detecting inconsistency and
conflicts. Information and Software Technology, 55(1),
35-57.
Balabantaray, R.C., Sarma, C. and Jha, M., 2015. Document
clustering using k-means and k-medoids. arXiv preprint
arXiv:1502.07938.
Barchiesi, M.A., Costa, R. and Greco, M., 2014. Enhancing
conflict resolution through an AHP-based methodology.
Identifying and Resolving Conflicts in Requirements by Stakeholders: A Clustering Approach
167

In International Journal of Management and Decision
Making, 13(1), 17-41.
Benavides, D., Cortés, A. R., Trinidad, P., and Segura, S.,
2006. A Survey on the Automated Analyses of Feature
Models. In Jornadas De Ingenieria del Software Bases
de Datos (JISBD), 367-376.
Bendjenna, H., Charrel, P.J. and Zarour, N.E., 2012. Using
AHP method to resolve conflicts between non-functional
concerns. In Proceedings of International Conference on
Education, Applied Sciences and Management
(ICEASM'2012), June 15 - 18, 2013, Dubai, UAE, 26-27.
Boehm, B., Bose, P., Horowitz, E. and Lee, M.J., 1995.
Software requirements negotiation and renegotiation
aids: A theory-W based spiral approach. In IEEE
International Conference Proceedings on Software
Engineering, (ICSE 1995), April, 23-30, Seatle,
Washington, USA, 243-243.
Boehm, B., Port, D. and Al-Said, M., 2000. Avoiding the
software model-clash spiderweb. Computer, 33(11), 120-
122.
Brito, I.S., Moreira, A., Ribeiro, R.A. and Araújo, J., 2013.
Handling conflicts in aspect-oriented requirements
engineering. In Aspect-Oriented Requirements
Engineering, 225-241. Springer, Berlin, Heidelberg.
Castro-Herrera, C. and Cleland-Huang, J., 2010. Utilizing
recommender systems to support software requirements
elicitation. In Proceedings of the 2
nd
International
Workshop on Recommendation Systems for Software
Engineering, May 4
th
, 2010, Cape Town, South Africa,
6-10.
Chawla, S. and Gionis, A., 2013, May. k-means–: A unified
approach to clustering and outlier detection. In the 2013
SIAM International Conference Proceedings on Data
Mining (pp. 189-197). Society for Industrial and Applied
Mathematics.
Coolican, H., 2009. Research methods and statistics in
psychology. Hodder Education, Routledge.
Das, S., Abraham, A. and Konar, A., 2007. Automatic
clustering using an improved differential evolution
algorithm. In the IEEE Transactions on Systems, Man,
and Cybernetics-Part A: Systems and Humans, 38(1),
218-237.
Davis, A., Overmyer, S., Jordan, K., Caruso, J., Dandashi, F.,
Dinh, A., ... and Theofanos, M., 1993. Identifying and
measuring quality in a software requirements
specification. In Proceedings of First IEEE International
Symposium on Software Metrics, May 21 -22, Como,
Italy, 141-152.
De Souto, M.C., De Araujo, D.S., Costa, I.G., Soares, R.G.,
Ludermir, T.B. and Schliep, A., 2008. Comparative study
on normalization procedures for cluster analysis of gene
expression datasets. In IEEE International Joint
Conference Proceedings on Neural Networks (IEEE
World Congress on Computational Intelligence), 2792-
2798.
Deutsch, M., 1973. The resolution of conflict. Yale
University Press, New Haven, USA.
Escalona, M.J., Urbieta, M., Rossi, G., Garcia-Garcia, J.A.
and Luna, E.R., 2013. Detecting Web requirements
conflicts and inconsistencies under a model-based
perspective. Journal of Systems and Software, 86(12),
3024-3038.
Faber, V., 1994. Clustering and the continuous k-means
algorithm. Los Alamos Science, 22(138144.21), 67.
Gambo, I. P., 2016. Development of a Model for Conflict
Resolution in the Requirements Engineering Process of
Software Systems. Ph.D. thesis, Department of
Computer Science and Engineering, Obafemi Awolowo
University, Ile-Ife, Nigeria, 1-298.
Gupta, A. and Gupta, C., 2018. CDBR: A semi-automated
collaborative execute-before-after dependency-based
requirement prioritization approach. Journal of King
Saud University-Computer and Information Sciences,
(Article in press), 1-12.
Han, M., Yang, K., Qin, J., Jin, R., Ma, Y., Wen, J., Chen,
Y., Zhao, L. and Tang, W., 2014. An algorithm based on
the standard deviation of passive microwave brightness
temperatures for monitoring soil surface freeze/thaw
state on the Tibetan Plateau. IEEE Transactions on
Geoscience and Remote Sensing, 53(5), 2775-2783.
Haraty, R.A., Dimishkieh, M. and Masud, M., 2015. An
enhanced k-means clustering algorithm for pattern
discovery in healthcare data. International Journal of
distributed sensor networks, 11(6), 615740.
Hartwell, R.E., 1991. Resolving conflict in system
requirements. In the IEEE Systems Readiness
Technology Conference Proceedings on Improving
Systems Effectiveness in the Changing Environment of
the '90s (AUTOTESTCON '91), 349-354.
Hennig, C., Meila, M., Murtagh, F. and Rocci, R. eds., 2015.
Handbook of cluster analysis. CRC Press.
Hisa, P., and Yaung, A. T., 1988. Another approach to system
decomposition. In Proceedings of the 12th International
Conference on Computer Software and Applications
(COMPSAC'88), Trento, Italy, 75-82.
Keeney, S., McKenna, H. and Hasson, F., 2011. The Delphi
Technique in Nursing and Health Research, Wiley-
Blackwell, Chichester, UK.
Kendall, M.G. and Smith, B.B., 1939. The problem of m
rankings. The annals of mathematical statistics, 10(3),
275-287.
Khaled, O.M., Hosny, H.M. and Shalan, M., 2017.
Exploiting Requirements Engineering to Resolve
Conflicts in Pervasive Computing Systems. In
International Conference Proceedings on Evaluation of
Novel Approaches to Software Engineering, 93-115.
Springer, Cham.
Kim, M., Park, S., Sugumaran, V. and Yang, H., 2007.
Managing requirements conflicts in software product
lines: A goal and scenario based approach. Data &
Knowledge Engineering, 61 (3), 417-432.
Kwan, I. and Damian, D., 2011. The hidden experts in
software-engineering communication: NIER track. In
33
rd
International Conference Proceedings on Software
Engineering, ICSE '11, New York, NY, USA, 800-803.
Lim, W. C. 1994. Effects of reuse on quality, productivity,
and economics. Software, IEEE, 11(5), 23-30.
Liu, C.L., 2010. Ontology-based conflict analysis method in
non-functional requirements. In 9
th
IEEE/ACIS
ENASE 2021 - 16th International Conference on Evaluation of Novel Approaches to Software Engineering
168

International Conference Proceedings on Computer and
Information Science (ICIS), 491-496.
Maalej, W. and Thurimella, A.K., 2009. Towards a research
agenda for recommendation systems in requirements
engineering. In Proceedings of Second International
Workshop on Managing Requirements Knowledge
(MARK'09), September 2009, Atlanta, USA, 32-39.
Mairiza, D., Zowghi, D. and Gervasi, V., 2013. Conflict
characterization and analysis of non-functional
requirements: An experimental approach. In Proceedings
of IEEE 12th International Conference on Intelligent
Software Methodologies, Tools and Techniques
(SoMeT), 83-91.
Maxwell, J.C., Antón, A.I. and Swire, P., 2011. A legal cross-
references taxonomy for identifying conflicting software
requirements. In Proceedings of the 19th IEEE
International Requirements Engineering Conference
(RE'11),17 (2), 197-206.
Miller, T., Lu, B., Sterling, L., Beydoun, G. and Taveter, K.,
2014. Requirements elicitation and specification using
the agent paradigm: the case study of an aircraft
turnaround simulator. IEEE Transactions on Software
Engineering 40, no. 10 (2014): 1007-1024.
Nuseibeh, B. and Easterbrook, S., 2000. Requirements
engineering: a roadmap. In Proceedings of the
Conference on the Future of Software Engineering, pp.
35-46.
Poort, E.R. and de With, P.H.N., 2004. Resolving
requirement conflicts through non-functional
decomposition. In Proceedings of the Fourth Working
IEEE/IFIP Conference on Software Architecture
(WICSA 2004), 145-154.
Rombach, H.D., Basili, V.R. and Selby, R.W., 1993.
Experimental Software Engineering Issues: Critical
Assessment and Future Directions. Proceedings of the
International Workshop, Dagstuhl Castle, Germany,
September 14-18, 1992. Vol. 706. Springer Science &
Business Media.
Ross, S., Fang, L. and Hipel, K.W., 2002. A case-based
reasoning system for conflict resolution: design and
implementation. Engineering Applications of Artificial
Intelligence, 15(3), 369-383.
Saaty, T. L., 1990. The analytic hierarchy process in conflict
management. International Journal of Conflict
Management, 1(1), 47- 68.
Shyyan, V., Christensen, L., Thurlow, M., and Lazarus, S.,
2013. Multi-Attribute Consensus Building Tool.
Minneapolis, MN: the University of Minnesota, National
Center on Educational Outcomes.
Siegel, S. and Castellan, N. J., 1988. Nonparametric
Statistics for the Behavioural Sciences. New York:
McGraw-Hill.
Steinbach, M., Kumar, V. and Tan, P., 2005. Cluster analysis:
basic concepts and algorithms. Introduction to data
mining, 8, 487- 568, 1st edn. Pearson Addison Wesley.
Tan, P. N., Steinbach, M. and Kumar, V., 2006. Cluster
analysis: basic concepts and algorithms. Introduction to
data mining, 8, 487-568
Taveter, K., Sterling, L., Pedell, S., Burrows, R. and Taveter,
E.M., 2019. A method for eliciting and representing
emotional requirements: Two case studies in e-
healthcare. In 2019 IEEE 27
th
International
Requirements Engineering Conference Workshops
(REW), 100-105.
Van Lamsweerde, A., Darimont, R. and Letier, E., 1998.
Managing conflicts in goal-driven requirements
engineering. IEEE Transactions on Software
Engineering, 24(11), 908-926. 1998.
Veerappa, V. and Letier, E., 2011. Clustering stakeholders
for requirements decision making. In International
Working Conference on Requirements Engineering:
Foundation for Software Quality (pp. 202-208).
Springer, Berlin, Heidelberg
Viana, T., Zisman, A. and Bandara, A.K., 2017. Identifying
conflicting requirements in systems of systems. In
Proceedings of IEEE 25th International Requirements
Engineering Conference (RE'17), 436-441.
Yang, H., Kim, M., Park, S. and Sugumaran, V., 2005. A
process and tool support for managing activity and
resource conflicts based on requirements classification.
In the International Conference Proceedings on
Application of Natural Language to Information
Systems, 114-125. Springer, Berlin, Heidelberg.
Yaung, A. T. 1992. Design and implementation of a
requirements clustering analyzer for software system
decomposition. In Proceedings of the 1992
ACM/SIGAPP symposium on Applied computing:
technological challenges of the 1990's, March 01 - 03,
1992, Kansas City, MO, USA, 1048-1054.
Yin, R.K., 2017. Case study research and applications:
Design and methods. Sage publications.
Zhang, W., Mei, H., and Zhao, H., 2006. Feature-driven
requirement dependency analysis and high-level
software design. Requirements Engineering, 11(3), 205-
220.
APPENDIX
The following table describes the appendices (additional
materials).
Table 5.
Appendix Link to content
Ranking scales of
requirements from
Stakeholders
https://doi.org/10.5281/zenodo.4603841
Requirements
weights of
stakeholders
https://doi.org/10.5281/zenodo.4603824
Department sub-
unit-wise
distribution of
Participants
https://doi.org/10.5281/zenodo.4603848
Normal distribution
of requirements after
preprocessing
https://doi.org/10.5281/zenodo.4603860
The five (5) clusters https://doi.org/10.5281/zenodo.4603866
Prioritized and
resolved weights
https://doi.org/10.5281/zenodo.4603873
Identifying and Resolving Conflicts in Requirements by Stakeholders: A Clustering Approach
169
