
Design and Validation of an Emerging Educational Technologies
Acceptance and Integration Questionnaire for Teachers
Ana González-Marcos
1a
, Fermín Navaridas-Nalda
2b
and Jesús Castellano-Latorre
3
1
Department of Mechanical Engineering, University of La Rioja, c/San José de Calasanz 31, Logroño, La Rioja, Spain
2
Department of Education, University of La Rioja, c/San José de Calasanz 31, Logroño, La Rioja, Spain
3
Center for Educational Innovation, Government of La Rioja, c/Marqués de Murrieta 76, Logroño, La Rioja, Spain
Keywords: Educational Technologies, Questionnaire, Validation, Structural Equation Modelling.
Abstract: The integration of technology in the teaching and learning processes depends to a large extent on the teaching
attitude towards these resources. Thus, our research is focused on the internal beliefs that predisposed teachers
to their acceptance and pedagogical use in schools. The main objective of this work was to design and validate
a questionnaire for non-university teachers with the main purpose of identifying the most important factors
of their teaching attitude towards the use of emerging technological resources. Taking the Theory of Planned
Behaviour and its subsequent development as reference behavioural research models, we developed a
questionnaire that interrelatedly combines the following factors: perceived usefulness, perceived self-efficacy,
facilitating conditions and the subjective norm. A total of 661 teachers were recruited from public schools in
La Rioja (Spain). Content validity, construct validity, internal consistency and reliability of the questionnaire
were undertaken as part of the validation process. The results showed good psychometric qualities in the
questionnaire and indicated that the instrument is reliable and a valid measure to identify the factors that
explain the teaching attitude towards technological resources. The findings have both theoretical and practical
implications for the educational administration, management teams and teachers.
1 INTRODUCTION
For many authors (Johri et al., 2014; Hubalovsky et
al., 2019; Navaridas et al., 2020), the acceptance and
standardized use of information and communication
technologies (ICT) in educational processes in
schools are key factors for promoting change and
innovation in teaching. The use of ICT allows to
transform traditional ways of acquiring, preparing,
organizing and transmitting knowledge in the
classroom. In accordance with this idea, in recent
years there are also various international
organizations and institutions that have tried to
promote their development to improve access to
education and training, raise the quality of learning
and promote a culture of collaboration between
educational institutions (Commission of the
European Communities, 2001; OECD, 2015;
UNESCO, 2009). Thus, for example, among the
standards proposed by UNESCO (2008, 2011) on
a
https://orcid.org/0000-0003-4684-659X
b
https://orcid.org/0000-0003-4147-1311
ICT skills for teachers, those that refer to the creation
of a new "technology-based teaching model" stand
out. In this sense, teachers must take full advantage of
technological progress in order to create new
environments and pedagogical methods focused on
learning, to develop innovative didactic material and
to exchange experiences of the application of these
technologies to teaching, training and research. All
this allows to improve the practices and results of
current education.
In the current educational scenario, which is
affected by the pandemic derived from Covid-19,
some research works seem to show that it is not
enough to increase investment in ICT (Montenegro et
al., 2020) to achieve these objectives. Indeed, despite
the efforts made by the Educational Authorities of our
region in recent years to provide ICT resources to the
basic and compulsory education centres, the results
provided by some studies (Santiago et al., 2014; Pérez
and Rodríguez, 2016) question whether these
González-Marcos, A., Navaridas-Nalda, F. and Castellano-Latorre, J.
Design and Validation of an Emerging Educational Technologies Acceptance and Integration Questionnaire for Teachers.
DOI: 10.5220/0010526705250532
In Proceedings of the 13th International Conference on Computer Supported Education (CSEDU 2021) - Volume 1, pages 525-532
ISBN: 978-989-758-502-9
Copyright
c
2021 by SCITEPRESS – Science and Technology Publications, Lda. All rights reserved
525

resources are used effectively for educational
purposes. In general, it seems to be observed that
teaching decisions related to the use of ICT in
teaching and learning processes are largely
determined by the teachers' own conceptions of these
resources (e.g., perceived usefulness, perceived self-
efficacy, perceived availability). In this case, the own
experiences and formative experiences of the
teaching staff are important elements in their teaching
perceptions.
It is essential and necessary that educational
institutions develop an energetic training policy for
their teaching staff (Fernández-Cruz and Fernández-
Díaz, 2016). Thus, for this training to have the desired
effect at the teaching level, during the planning
process, it may be interesting to start with a study of
the teachers' own system of motivations or beliefs as
the main components of their attitude and intention to
use the technological resources during the teaching
and learning processes in the educational centres
(Straub, 2009).
In this sense, many of the reviewed studies
propose using research models based on the Theory
of Reasoned Action -TRA- (Fishbein and Ajzen
1975, Ajzen and Fishbein 1980), which considers that
a person's decision to execute a certain action is
fundamentally conditioned by an attitudinal
component (understood as the relatively stable
predisposition of a person to respond favorably or
unfavorably to a specific situation or stimulus) and a
component based on normative beliefs (understood as
the perception of a person about the different
pressures to which it may be subjected from the social
circles of belonging or reference). According to this
premise, one of the models most used to study
technological acceptance is the Technology
Acceptance Model -TAM- (Davis, 1989; Davis et al.,
1989; Venkatesh and Davis, 2000), where perceived
usefulness and perceived ease of use are included as
determinants of human behavior.
In an attempt to integrate in a harmonious and
related way the different factors considered by the
previous models as determinants of the effective
implementation of the technology, Venkatesh et al.
(2003) formulated the Unified Theory of Acceptance
and Use of Technology (UTAUT). Although in a very
broad framework of research assigned to different
fields of specialization (Cimperman et al., 2016;
Khalilzadeh et al., 2017; Khaksar et al., 2019) there
seems to be a consensus on the factors that can predict
to a greater extent the acceptance and use of
technological resources. In the specific context of
education, there seems to be some controversy and
inconsistent results both in the level of influence and
in the relationships established between the identified
factors (Scherer et al., 2019). Sensitive to these
findings in the educational field, in this research we
set the following objective: to design and validate a
questionnaire to corroborate its goodness with respect
to a theoretical model of research on acceptance and
technological integration.
2 METHOD
2.1 Research Model
In accordance with the proposed research objective,
and based on a review of the most prominent models
of technological acceptance in the specialized
literature in this field (Davis, 1989; Venkatesh and
Davis, 2000, Venkatesh et al., 2003; Venkatesh and
Bala, 2008), we designed a theoretical research model
that incorporates the factors that we consider most
appropriate and relevant to the context under study.
In this sense, the designed model combines the factors
highlighted in the TRA, TAM and UTAUT models in
an adapted way (Figure 1).
Figure 1: Theoretical research model (own elaboration).
The definition of each of the factors considered is
summarized as follows:
Current use: refers to the degree or frequency of
use of technological resources during teaching
activity.
Attitude: this factor refers to the teacher's
predisposition to respond favorably or
unfavorably to a technological resource.
Perceived usefulness: refers to the degree to
which a teacher believes that the use of
technological resources will improve their
teaching activity.
Perceived self-efficacy: the degree to which a
teacher believes that he or she possesses the
knowledge and skills necessary for the
pedagogical use of technological resources.
Facilitating conditions: this factor refers to the
ease of use perceived as a consequence of the
teacher's control over external conditions or
ATTITUDE
CURRENT
USE
SUBJECTIVE
NORM
FACILITATING
CONDITIONS
PERCEIVED
SELF-EFFICACY
PERCEIVED
USEFULNESS
H1
H2
H3
H4
H5
H6
H7
H8
H9
H10
CSEDU 2021 - 13th International Conference on Computer Supported Education
526
variables and the availability of organizational
and technical resources.
Subjective norm: refers to the teacher's beliefs
about what most of the people important to him or
her think about the use of technological resources
during their teaching activity.
Thus, we postulated the following hypotheses that
establish the relationships and influences between the
factors defined in the theoretical model designed:
H1. The teacher's subjective norm or normative
beliefs positively influences perceived
usefulness.
H2. The teacher's subjective norm positively
influences his or her attitude toward the use of
technological resources.
H3. The teacher's subjective norm influences his or
her perceived self-efficacy.
H4. Facilitating conditions positively influences the
teacher’s attitude toward the use of educational
technologies.
H5. Facilitating conditions influences the teacher’s
perceived self-efficacy for the use of
technological resources.
H6. Perceived self-efficacy positively influences the
teacher’s perceived uselfulness of educational
technologies.
H7. Perceived uselfulness of technology positively
influences the teacher’s attitude toward the use
of technological resources.
H8. Perceived self-efficacy positively influences the
teacher’s attitude toward the use of
technological resources.
H9. Perceived self-efficacy positively influences the
current use of technological resources during
teaching activity.
H10. Teachers’ attitude positively influences the
current use of technological resources during
their teaching activity.
2.2 Participants
The aim of the survey is to better understand teachers’
own conceptions of the use of technological resources
for educational purposes and, thus, to help the
educational authorities of our region in the
development of an efficient training policy. Since the
responsibilities of these local educational authorities
are limited to non-university levels, the target
population is the total set of employed teachers in
non-university centres.
Data were collected from 6 April 2020 to 10 May
2020, i.e., after COVID-19 outbreak. This ensured
that the target population had at least a computer at
home for educational purposes: some teachers
borrowed the technological devices from their own
educational centres. The study sample included 661
teachers who carried out their teaching activities from
early childhood education to short-cycle tertiary. The
demographic information of the respondents shown
in Table 1 illustrates the heterogeneity of the sample,
which improves the external validity of the study.
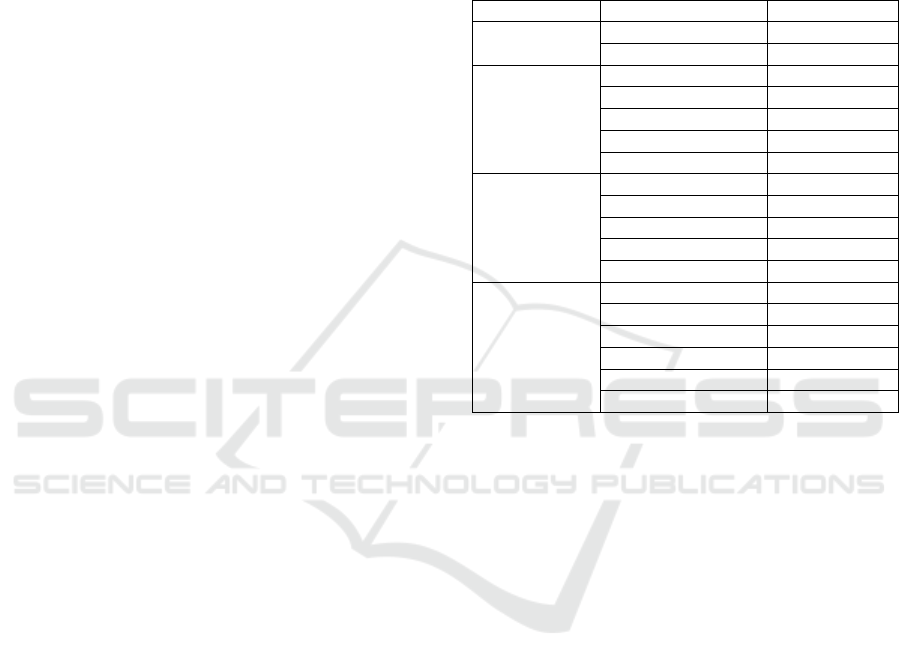
Table 1: Demographic characteristics of the participants.
Demo
g
ra
p
hics Cate
g
or
y
Fre
q
uenc
y
(
%
)
Gender
Female 438 (62.3)
Male 223 (33.7)
Age group
21-30
y
ears 57
(
8.6
)
31-40
y
ears 172
(
26.0
)
41-50
y
ears 241
(
36.5
)
51-60 years 183 (27.7)
> 60 years 8 (1.2)
Teaching
experience
≤ 5 years 128 (19.4)
6-10
y
ears 90
(
13.6
)
11-20
y
ears 240
(
36.3
)
21-30
y
ears 131
(
19.8
)
> 30 years 72 (10.9)
Level of
education
taught
Early childhoo
d
101 (10.9)
Primar
y
266
(
28.7
)
Lower secondar
y
246
(
26.6
)
U
pp
er secondar
y
125
(
13.5
)
Short-cycle tertiary 102 (11.0)
Othe
r
86 (9.3)
2.3 Development and Description of the
Instrument
As indicated previously, the questionnaire was
developed after a review of the main theories and
models of technological acceptance and use. It was
designed to gather demographic data on the one hand
and the measurement items of the selected factors on
the other hand. Before its final version, and in
accordance with the classic patterns of content
validity of a survey (Gómez et al., 2013), it was
subjected to the scrutiny of a panel of five experts in
the field of educational research. The focus of this
panel of experts was to ascertain if the purpose of the
questionnaire was clear, if the structure and relevance
of the proposed elements (factors and items) were
adequate, if questions and language were appropriate
and accurate, and if it was necessary to add or remove
any element. Also, they were asked to provide an
overall rating of the questionnaire.
The questionnaire was amended according to the
comments and suggestions of the panel of experts
and, thus, the final version of the survey consists of
39 questions (items): 11 questions to collect
demographic data and 28 questions related to the six
defined factors (see Appendix): (1) subjective norm,
Design and Validation of an Emerging Educational Technologies Acceptance and Integration Questionnaire for Teachers
527
(2) facilitating conditions, (3) perceived usefulness,
(4) perceived self-efficacy, (5) attitude and (6) current
use. The first four factors are mainly predictive in
nature, while the last two refer more to results. The
teachers were asked to indicate their agreement or
disagreement with each item on a Likert-type scale
with five response levels that ranged from 1 (totally
disagree) to 5 (totally agree).
2.4 Data Analysis
Data were analysed using the software package R
version 4.0.3. First, data coding and cleaning was
performed. Then, teachers’ responses were analysed
using descriptive statistics. Next, factor analysis,
along with validity and reliability of construct were
performed. Finally, structural equation modelling
was used to test the goodness of fit indices in a
measurement model and the proposed hypothesis.
3 RESULTS AND DISCUSSION
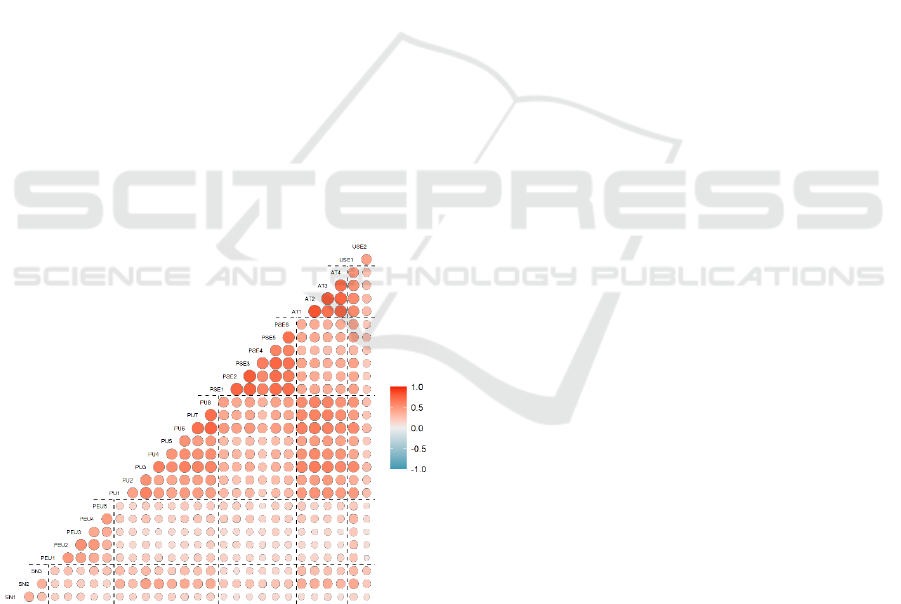
First, correlations between the measurement items
were investigated (Figure 2). It was assessed that
inter-items correlations were higher than 0.30 and
lower than 0.90, which allows to consider the final
items appropriate for the six factors.
Figure 2: Correlations among measurement items.
3.1 Exploratory Factor Analysis
Exploratory factor analysis was conducted to assess
the purification of measurement items. Thus, the
Kaiser-Meyer-Olkin (KMO) measure and the
Bartlett’s test of sphericity were calculated. With
values of KMO = 0.95 and Bartlett’s test χ
2
=
13650.62, df = 378, and p < 0.001, it was confirmed
the sample appropriateness, i.e., the sample was
adequate and the correlation matrix was significantly
different from an identity matrix.
Then, principal component analysis (PCA) with
oblique rotation was used since we assumed that the
factors in the analysis are correlated. This analysis
showed that the 28 items were divided into five
factors, which had eigenvalues greater than 1 and
explained 71.58% of the overall variance.
Percentages of total variance explained were 38.65%
for the first factor, 25.79% for the second factor,
15.54% for the third factor, 8.49% for the fourth
factor, 7.44% for the fifth factor, and 4.10% for the
sixth factor.
3.2 Confirmatory Factor Analysis
Confirmatory factor analysis was applied for
checking the loadings of observed variables (items)
over latent variables (factors or constructs). Also,
convergent and discriminant validity and reliability
were assessed.
Table 2 shows values for factor loading (FL),
composite reliability (CR), average variance
extraction (AVE) and the Cronbach’s alpha (CA).
These results revealed that factor loading values were
above the threshold of 0.5 suggested by Hair et al.
(2010). Also, it was observed that the CR of
subjective norm and current use factors were below
the recommended threshold of 0.7 (Straub et al.,
2004). The same factors showed Cronbach’s Alpha
values below the recommended threshold of 0.7
(Nunnally, 1978). However, these results are still
within the general accepted rule that values of 0.6-0.7
indicate an acceptable level of reliability (Lam, 2012;
Ursachi et al., 2015). Finally, values for AVE were
greater than threshold recommended by Hair et al.
(2010), i.e., 0.5, except for the subjective norm factor.
In this case, since CR is higher than 0.6 AVE, the
convergent validity of the factor (construct) is still
adequate (Fornell & Larcker, 1981).
Discriminant validity was assessed through the
heterotrait-monotrait ratio (HTMT) of the
correlations (Henseler et al., 2015). Table 3 shows
that most HTMT values are lower than the suggested
threshold of 0.85 (Kline, 2011). However, other
authors suggest a value of 0.90 (Henseler et al., 2016).
Thus, discriminant validity of the proposed model
was established.
CSEDU 2021 - 13th International Conference on Computer Supported Education
528
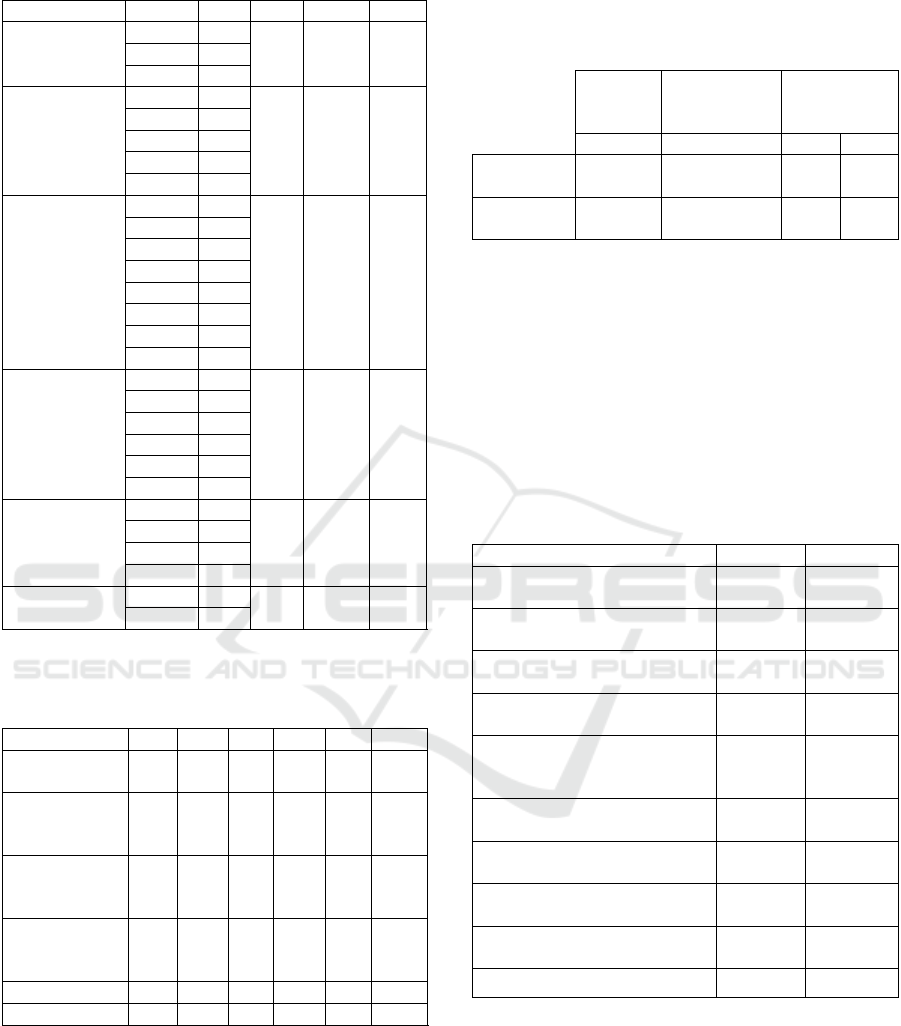
Table 2: Construct reliability and convergent validity.
Construct Ite
m
FL CR AVE CA
Subjective
Norm
SN1 .57
.66 .42 .65 SN2 .75
SN3 .54
Facilitating
conditions
FC1 .67
.83 .50 .83
FC2 .80
FC3 .72
FC4 .72
FC5 .59
Perceived
usefulness
PU1 .66
.92 .60 .92
PU2 .65
PU3 .82
PU4 .74
PU5 .68
PU6 .87
PU7 .83
PU8 .87
Perceived
self-efficacy
PSE1 .90
.95 .75 .95
PSE2 .89
PSE3 .92
PSE4 .76
PSE5 .88
PSE6 .85
Attitude
AT1 .90
.94 .79 .94
AT2 .95
AT3 .87
AT4 .83
Current Use
USE1 .78
.68 .61 .68
USE2 .66
FL: Factor Loading; CR: Composite Reliability; AVE:
Average Variance Extracted; CA: Cronbach’s Alpha
Table 3: Discriminant validity.
Constructs SN FC PU PSE AT USE
Subjective
Norm
(
SN
)
.42
Facilitating
conditions
(
FC
)
.54 .50
Perceived
usefulness
(PU)
.65 .39 .60
Perceived
self-efficacy
(PSE)
.34 .31 .58 .75
Attitude
(
AT
)
.53 .28 .87 .53 .79
Current Use .63 .40 .77 .58 .73 .61
Diagonal values are AVE and off-diagonals are HTMT
values
Finally, the statistical fitness of the model was
assessed with three sorts of fit indices used in
structural equation modelling (SEM), i.e., absolute,
parsimonious and incremental. Table 4 illustrates that
the obtained results are within the accepted threshold
values for different fit indices, showing the goodness
of the proposed model and questionnaire.
Table 4: Summary of fit indices.
Absolute
fit
measure
Parsimonious
fit measure
Incremental
fit measure
SRMR RMSEA CFI TLI
Acceptable
fit
≤ .08 ≤ .06 ≥ .90
≥
.90
Obtained
fit
.045 .055 .95 .94
SRMR: Standardized Root Mean Square Residual;
RMSEA: Root Mean Square Error of Approximation;
CFI: Comparative Fit Index; TLI: Tucke
r
-Lewis Index
3.3 Structural Model
Causal relationships were evaluated in the structural
model using the open-source lavaan package
available in R, which was developed by Roosseel
(2012). Thus, Table 5 and Figure 3 present the output
generated for the proposed model.
Table 5: Hypothesis testing.
Hypothesis β values Status
H1: Subjective Norm →
Perceived usefulness
0.517*** Accepted
H2: Subjective Norm →
Attitude
0.014
Not
su
pp
orte
d
H3: Subjective Norm →
Perceived self-efficac
y
0.279*** Accepted
H4: Facilitating conditions
→ Attitude
-0.063
Not
su
pp
orte
d
H5: Facilitating conditions
→ Perceived self-
efficac
y
0.172** Accepted
H6: Perceived self-efficacy
→ Perceived usefulness
0.419*** Accepted
H7: Perceived usefulness →
Attitude
0.889*** Accepted
H8: Perceived self-efficacy
→ Attitude
0.005
Not
supporte
d
H9: Perceived self-efficacy
→ Current Use
0.270*** Accepted
H10: Attitude → Current Use 0.571*** Accepted
NOTE: significant at: * p < 0.05; ** p < 0.01; *** p <
0.001
Results inferred the significant acceptance of
seven hypothesized relationships:
The data supported both H1 and H3, which
predicted that the subjective norm would
positively influence the teachers’ perceived
usefulness of technology and their perceived self-
Design and Validation of an Emerging Educational Technologies Acceptance and Integration Questionnaire for Teachers
529

efficacy. These results are in line with other works
(Abdullah and Ward, 2016; Scherer et al., 2019).
With respect to H6 and H9, the assumptions that
perceived self-efficacy would influence perceived
usefulness and current use of technology were
individually confirmed.
The relationship between facilitating conditions
and perceived self-efficacy (H5) was also
corroborated by the data. In this case, perceptions
of possible barriers that are related to external
conditions or availability of organizational and
technical resources are linked to beliefs about the
degree to which a teacher can perform teaching
tasks with technology.
In the case of H7, the results supported the
expectation that perceived usefulness would
positively influence the teachers’ attitude toward
the use of educational technologies. This finding
agrees with other studies (Venkatesh et al., 2003;
Scherer et al., 2015) that emphasize the
importance of teachers’ perceptions for user
attitudes and use intentions toward technology.
Finally, H10, which predicted that teachers’
attitude positively influences their use of
technological resources, was also supported. Once
again, this finding is consistent with other studies
(Nistor and Heymann, 2010; Scherer et al., 2018).
NOTE: significant at: ** p < 0.01; *** p < 0.001
Figure 3: The results for the suggested model.
Surprisingly, behavioural intention (attitude)
toward the use of technological resources was not
significantly influenced by facilitating conditions
(H4), perceived self-efficacy (H8), or subjective
norm (H2). In addition, the negative value of the path
coefficient between facilitating conditions and
attitude (H4) implies that teachers’ attitude toward the
use of educational technologies decreases with higher
perceptions that using technology will be either free
of effort or involve a minimum of effort, which seems
counterintuitive. These results could be explained
because data were collected after COVID-19
outbreak so there was not an option to choose whether
to use of educational technologies for teachers’
pedagogical activities or not.
4 CONCLUSIONS
The main objective of this study was to investigate
the validity of a questionnaire designed to measure
the teachers’ acceptance and integration of emerging
educational technologies. Also, the study examined
the factors influencing teachers’ attitude toward the
use of educational technologies during their activities
and their integration. Specifically, this work
examined the subjective norm, facilitating conditions,
perceived self-efficacy for technology use, perceived
usefulness of integration technology, attitude, and
technology use.
Subjective norm and perceived self-efficacy are
important predictors of perceived usefulness (H1 and
H6). Although the effects vary across studies, there is
agreement on these results. In the present work, these
variables explained 60% of variance (R
2
) in perceived
usefulness. Also, perceived usefulness and attitude
seem to be critical factors for user attitude toward
technology (H7) and current use (H10), respectively.
In addition to attitude, perceived self-efficacy seems
to play a relevant role of teachers’ use of
technological resources during their teaching activity
(H9). Overall, about 77% of variance in attitude and
56.3% of variance in current use were explained
within the proposed model. These results suggest the
importance of planning teachers' training programs
which focus on improving the perceived usefulness as
well as enhancing teachers’ self-efficacy in using
technology.
Although further analyses and refinement of the
tool are planned in the future, the findings presented
in this work suggest that the questionnaire effectively
measures educational technologies acceptance and
use in non-university teachers.
As with most educational research, this study has
certain limitations to address and improve in future
research. First, the research was conducted in a region
with a specific context and, therefore, the results
could not be generalized on other regions or countries
which have different contexts. In future, the proposed
model will be strengthened by considering mediating
and moderating variables. Also, the research model
will be used and extended to check the acceptance and
integration of technology in a variety of different
domains (e.g., face-to-face universities, e-health,
etc.).
ATTITUDE
CURRENT
USE
SUBJECTIVE
NORM
FACILITATING
CONDITIONS
PERCEIVED
USEFULNESS
0.517***
0.014
0.279***
-0.063
0.172**
0.419***
0.889***
0.005
0.270***
0.571***
PERCEIVED
SELF-EFFICACY
0.492***
CSEDU 2021 - 13th International Conference on Computer Supported Education
530

REFERENCES
Abdullah, F., Ward, R., 2016. Developing a general
extended technology acceptance model for E-learning
(GETAMEL) by analysing commonly used external
factors. Computers in Human Behavior, 56, 238–256.
Ajzen, I., Fishbein, M., 1980. Understanding attitudes and
predicting social behaviour, Prentice-Hall. Englewood
Cliffs, NJ.
Cimperman, M., Brenčič, M. M., Trkman, P., 2016.
Analyzing older users’ home telehealth services
acceptance behavior, applying an extended UTAUT
model. Int. J. Med. Inform. 90, 22–31.
Commission of the European Communities, 2001.
Communication from the Commission to the Council
and the European Parliament. The eLearning Action
Plan - Designing tomorrow's education. COM(2001)
172 final. Brussels.
Davis F., 1989. Perceived usefulness, perceived ease of use
and user acceptance of information technology, MIS
Quarterly, 13(3), 319–340.
Davis, F. D., Bagozzi, R. P., Warshaw, P. R., 1989. User
Acceptance of Computer Technology: A Comparison
of Two Theoretical Models. Management Science,
35(8), 982–1003.
Fernández-Cruz, F., Fernández-Díaz, M., 2016. Los
docentes de la generación Z y sus competencias
digitales. Comunicar, 46, 97-105.
Fishbein, M., Ajzen, I., 1975. Belief, attitude, intention, and
behavior: An introduction to theory and research,
Addison-Wesley. Reading, MA.
Fornell, C., Larcker, D. F., 1981. Evaluating Structural
Equation Models with Unobservable Variables and
Measurement Error. Journal of Marketing Research,
18(1), 39-50.
Gómez, M. A., Rodríguez, G., Ibarra, Mª S., 2013.
COMPES: Autoinforme sobre las competencias básicas
relacionadas con la evaluación de los estudiantes
universitarios, Estudios Sobre Educación, 24, 197-224.
Hair, J. F., Black, W. C., Babin, B. J., Anderson, R. E.,
2010. Multivariate Data Analysis, Pearson. New York,
7th edition.
Henseler, J., Ringle, C. M., Sarstedt, M., 2015. A new
criterion for assessing discriminant validity in variance-
based structural equation modeling. Journal of the
Academy of Marketing Science, 43(1), 115–135.
Henseler, J., Hubona, G., Ray, P. A., 2016. Using PLS path
modeling in new technology research: Updated
guidelines. Industrial Management & Data Systems,
116 (1), 2–20.
Hubalovsky, S., Hubalovska, M., Musilek, M., 2019.
Assessment of the influence of adaptive E-learning on
learning effectiveness of primary school pupils.
Computers in Human Behavior, 92, 691–705.
Johri, A., Teo, H. J., Lo, J., Dufour, M. Schram, A., 2014.
Millennial engineers: Digital media and information
ecology of engineering students. Computers in Human
Behavior, 33, 286-301.
Khaksar, S. M., Khosla, R., Singaraju, S. Slade, B., 2019.
Carer’s perception on social assistive technology
acceptance and adoption: moderating effects of
perceived risks, Behaviour & Information Technology,
40(4), 337-360.
Khalilzadeh, J., Ozturk, A. B. Bilgihan, A., 2017. Security-
related factors in extended UTAUT model for NFC
based mobile payment in the restaurant industry.
Computers in Human Behavior,70, 460–474.
Kline R. B., 2011, Principles and Practice of Structural
Equation Modeling, The Guilford Press. New York, 3
rd
edition.
Lam, L. W., 2012. Impact of competitiveness on
salespeople's commitment and performance. Journal of
Business Research, 65(9), 1328-1334.
Navaridas-Nalda, F., Clavel-San Emeterio, M. Fernández-
Ortiz, R. Arias-Oliva, M., 2020. The strategic influence
of school principal leadership in the digital
transformation of schools. Computers in Human
Behavior, 112, 106–481.
Nistor, N., Heymann, J. O., 2010. Reconsidering the role of
attitude in the TAM: An answer to Teo (2009). British
Journal of Educational Technology, 41(6), E142–E145.
Nunnally, J.C., 1978. Psychometric theory, McGraw-Hill.
New York, 2
nd
edition.
OECD, 2015. Students, computers and learning: Making
the connection. PISA. OECD Publishing.
Pérez, A., Rodríguez, M.J., 2016. Evaluación de las
competencias digitales autopercibidas del profesorado
de educación primaria en Castilla y León. Revista de
Investigación Educativa, 34 (2), 399-415.
Roosseell, Y., 2012. Lavaan: an R package for structural
equation modeling”, Journal of Statistical Software,
48(2), 1–36.
Santiago Campion, R., Navaridas Nalda, F., Repáraz
Abaitua, R., 2014. La escuela 2.0: La percepción del
docente en torno a su eficacia en los centros educativos
de La Rioja. Educación XX1, 17(1), 243-270.
Scherer, R., Siddiq, F., Teo, T., 2015. Becoming more
specific: Measuring and modeling teachers' perceived
usefulness of ICT in the context of teaching and
learning. Computers & Education, 88, 202–214.
Scherer, R., Siddiq, F. Tondeur, J., 2019. The technology
acceptance model (TAM): A meta-analytic structural
equation modeling approach to explaining teachers’
adoption of digital technology in education. Computers
& Education, 128, 13-35.
Scherer, R., Tondeur, J., Siddiq, F., Baran, E., 2018. The
importance of attitudes toward technology for pre-
service teachers' technological, pedagogical, and
content knowledge: Comparing structural equation
modeling approaches. Computers in Human Behavior.
Straub, D., Boudreau, M.-C., Gefen, D., 2004. Validation
guidelines for IS positivist research. Communications
of the Association for Information Systems, 13(1), 63
Straub, E. T., 2017. Understanding technology adoption:
Theory and future directions for informal learning.
Review of Educational Research, 79(2), 625-649.
UNESCO, 2008. Normas UNESCO sobre competencias en
TIC para docentes. http://goo.gl/pGPDGv
UNESCO, 2009. La Nueva Dinámica de la Educación
Superior y la Investigación Para el Cambio Social y el
Design and Validation of an Emerging Educational Technologies Acceptance and Integration Questionnaire for Teachers
531
Desarrollo. Conferencia Mundial Sobre la Educación
Superior. París: UNESCO.
UNESCO, 2011. UNESCO ICT Competency Framework
for Teachers. http://goo.gl/oKUkB.
Ursachi, G., Horodnic, I. A., Zait, A., 2015. How reliable
are measurement scales? External factors with indirect
influence on reliability estimators. Procedia Economics
and Finance, 20, 679 – 686.
Venkatesh, V., Bala, H., 2008, Technology Acceptance
Model 3 and a Research Agenda on Interventions.
Decision Sciences, 39(2), 273–315.
Venkatesh, V., Davis, F. D., 2000. A theoretical extension
of the technology acceptance model: Four longitudinal
field studies. Management Science, 46(2), 186-204.
Venkatesh V., Morris G.M., Davis G.B., Devis F.D., 2003.
User acceptance of Information Technology: toward a
unified view. MIS Quarterly, 27(3), 425–78
APPENDIX
Emerging Educational Technologies Acceptance
and Integration Questionnaire
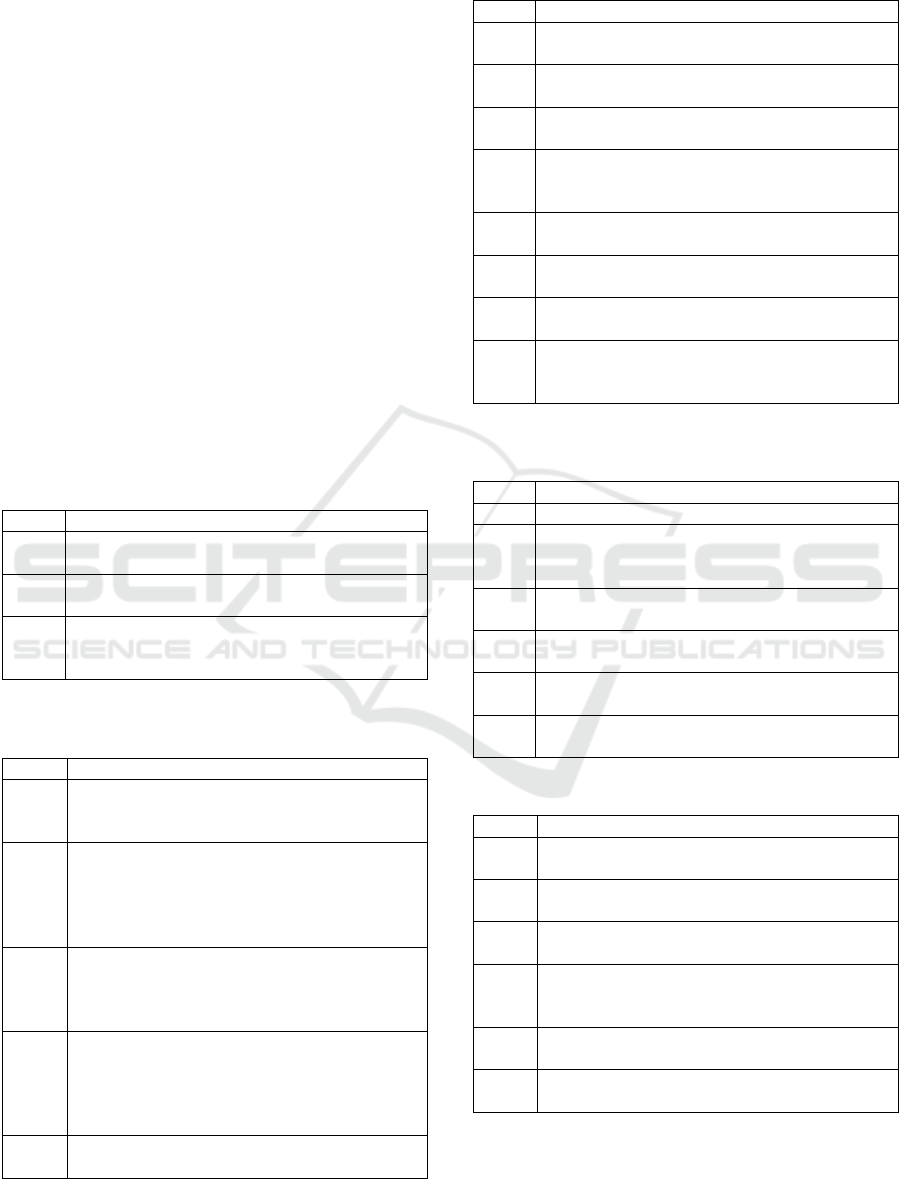
Table 6: Questions used to measure the subjective norm.
Label Ite
m
SN1
In general, families demand the use of
technolo
gy
in learnin
g
p
rocesses.
SN2
My students expect me to use ICT in the
teaching and learning process.
SN3
In general, teachers in my department consider
it important to use ICT in the teaching and
learnin
g
p
rocesses.
Table 7: Questions used to measure the facilitating
conditions.
Label Ite
m
FC1
In my opinion, the necessary technical
resources to facilitate the use of ICT in
educational
p
rocesses are available.
FC2
In my institution, the availability of
classrooms and spaces with technological
resources (computers, tablets, digital screens,
etc.) is very suitable for the development of
di
g
ital com
p
etence.
FC3
In general, the Educational Authority provides
the necessary resources and support (training,
advice, etc.) to make effective the use of ICT
in educational
p
rocesses.
FC4
During my teaching activity, I find it easy to
use ICT spaces (computer room, classrooms
with digital screens, etc.) and ICT resources
(educational platforms, free access to
websites, YouTube, etc.
)
.
FC5
In my opinion, I have a good service and
com
p
uter su
pp
ort when I need it.
Table 8: Questions used to measure the perceived
usefulness.
Label Ite
m
PU1
Technological resources are necessary to
develo
p
m
y
teachin
g
activities.
PU2
Mobile devices are useful to me and reduce
my working time.
PU3
ICTs help me to facilitate the expected
learning of my students.
PU4
I am sure that ICTs affect students’
motivational aspects such as interest,
satisfaction and curiosity.
PU5
ICTs allow me to attend to the diversity of the
students more effectivel
y
.
PU6
As a teacher I enjoy the use of ICT in the
teachin
g
p
rocess.
PU7
Technologies allow me to develop
p
rofessionall
y
.
PU8
I find satisfaction and feelings of well-being
with the use of ICT in teaching and learning
p
rocesses.
Table 9: Questions used to measure the perceived self-
efficacy.
Label Ite
m
PSE1 I
b
elieve that I have
g
ood di
g
ital com
p
etence.
PSE2
I have the necessary knowledge to locate
relevant information and transform it into
knowled
g
e throu
g
h ICT.
PSE3
I have the necessary knowledge to share and
collaborate throu
g
h di
g
ital media.
PSE4
I know the main aspects related to security,
digital identity and data protection.
PSE5
I consider myself competent to create digital
content for m
y
students.
PSE6
Generally, I am able to solve technical
p
roblems throu
g
h di
g
ital means.
Table 10: Questions used to measure the attitude and use.
Label Ite
m
AT1
I intend to use technology in teaching and
learnin
g
p
rocesses in the short/medium term.
AT2
I think it is a good idea to use technology in
my teaching activities.
AT3
Being able to use technology to improve the
quality of learning is important to me.
AT4
I am willing to use new technologies for the
different teaching and tutoring tasks with my
students.
USE1
I use ICT for the general dynamics of my
classes.
USE2
Approximate number of hours of technology
use
p
er da
y
in m
y
classroom.
CSEDU 2021 - 13th International Conference on Computer Supported Education
532
