
Estimation of the Acoustic Waste Energy Harvested from Diesel
Single Cylinder Engine Exhaust System
Claudiu Golgot
a
, Nicolae Filip
b
and Lucian Candale
Department of Automotive Engineering and Transport, Technical University of Cluj-Napoca, Romania
Keywords: Noise, Diesel, Acoustic, Energy Harvesting, FFT, Resonant Frequency.
Abstract: Noise generated in the operation of an internal combustion engine is an energy waste that produces noise
pollution. Recovering some of this energy and transforming it into another form of usable energy brings
significant benefits. We proposed to develop a device to recover this energy waste produced by the internal
combustion engines, in the gases changing process. The developed energy recovery system is based on the
Helmholtz resonator principle. For the conversion of acoustic waves into electricity, we used an audio speaker
as a low-cost electromagnetic transducer located at the end of the resonant chamber. By audio playback of
the acoustic signal recorded at the engine exhaust, we measured the electricity generated with the proposed
recovery system. We found that the noise level measured at the exhaust depending on the engine speed range,
follows a linear distribution law, instead, the harvested electric power varies nonlinearly. To find out the cause
of the electric power variation, we performed a detailed FFT analysis. We found that at most engine speeds,
the dominant amplitudes in the frequency spectrum are close to the resonant frequency of the system. With
the proposed conversion system, we obtained a maximum value of the harvested electric power of 165 µW.
1 INTRODUCTION
Road vehicles are generally recognized as a major
source of urban noise pollution, mainly due to the
noise produced by the exhaust system. Active
methods to reduce exhaust noise and fuel
consumption are proposed by Rossi and Cotana
(Rossi et al., 2002). The studies were performed with
an electromagnetic transducer for active noise
control. Farid (Farid, 2015) presented a method of
harvesting acoustic energy using an electromagnetic
transducer based on the Helmholtz resonator
principle. At the resonant frequency of 319 Hz, it
obtained a maximum power of 789.65 μW. Ming
Yuan (Ming et al., 2018) using a similar device
obtained a maximum power of 2.4 μW.
Matova S.P. (Matova, 2010) uses a piezoelectric
generator and an adjustable Helmholtz resonator to
obtain energy from the air flow. Depending on the
speed of the air flow, he adapted the Helmholtz
resonator so that it has the same resonant frequency
as the piezoelectric generator, obtaining a maximum
electrical power of 2 μW at an air flow of 13 m / s.
a
https://orcid.org/0000-0002-1890-8960
b
https://orcid.org/0000-0003-1342-2547
The conversion of acoustic energy is also found in
research on thermo-acoustic generators, they
transform thermal energy into acoustic energy and
then into electricity using an acoustic-electric
transducer.
Kees de Blok (Kees, 2010) obtained an efficiency
of 8% with a generator composed of four thermo
acoustic generators connected in series. Backhaus
S.N. (Backhaus et al., 2012) presented an electric
thermo-acoustic generator composed of a loop
resonator tube using a low-cost commercial speaker
as a linear alternator. It obtained, the maximum power
of 11.58W from 703 W calorific power, an engine
efficiency of 3.5%, an alternator efficiency of 46%
and a generator efficiency of 1.65%.
Low-cost speaker efficiencies are mentioned by
Zhibin Yu (Zhibin et al., 2010), he obtained an
efficiency of 40% for a load close to the coil
resistance. Bin Li (Bin et al., 2012) transformed the
acoustic energy with a resonator tube and a
piezoelectric rod mounted inside the tube. Thus, for a
noise level of 110 dB it obtained a voltage of 15,689
V and a power of 12,397 mW. The amount of energy
Golgot, C., Filip, N. and Candale, L.
Estimation of the Acoustic Waste Energy Harvested from Diesel Single Cylinder Engine Exhaust System.
DOI: 10.5220/0010526602470256
In Proceedings of the 7th International Conference on Vehicle Technology and Intelligent Transport Systems (VEHITS 2021), pages 247-256
ISBN: 978-989-758-513-5
Copyright
c
2021 by SCITEPRESS – Science and Technology Publications, Lda. All rights reserved
247
obtained was based on the area and volume of the
device used (0.635 mW / cm
2
and 15.115 μW / cm
3
).
In this paper we propose to use an electromagnetic
transducer mounted in an acoustic system with
Helmholtz resonator to convert into electricity some
of the residual acoustic energy of the exhaust gases
produced by a single-cylinder diesel engine.
2 MATERIALS AND METHODS
To recover the acoustic energy resulting from the
evacuation of a diesel engine, we chose a system
equipped with a Helmholtz resonator. This method
provides a good response in a selective frequency
band with a relatively accessible sizing (Martin et al.,
2018).
Myonghyon (Myonghyon, 2008) showed that
changing the dimensions not only changes the
resonant frequency but also the amplitude pressure in
the resonator cavity. We also considered the research
on the reduction of acoustic energy and the influence
of the Helmholtz resonator related by Ganghua Yu et
al., (Ganghua et al., 2008).
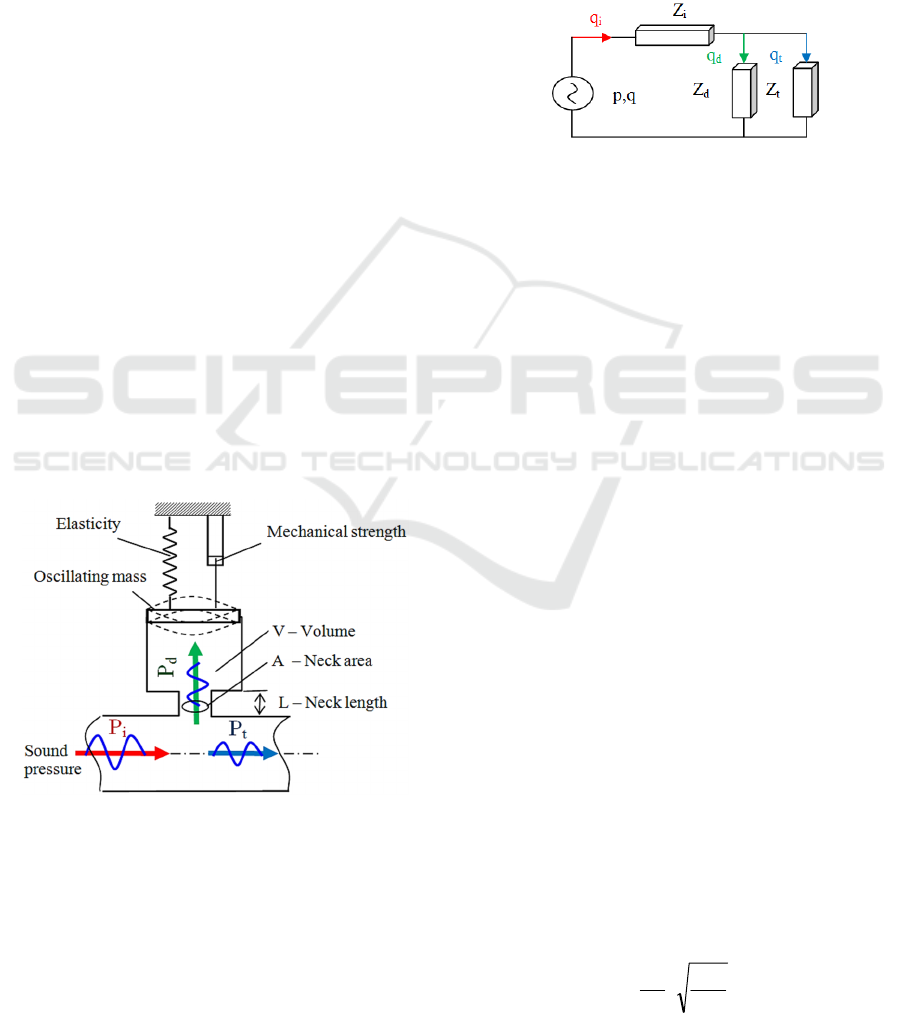
The proposed system shown in Figure 1
composed of a main pipe through which the incident
sound pressure wave (exhaust noise) evolves with a
Helmholtz resonance chamber attached. The end of
the resonant chamber in our case is elastic due to the
membrane of the electromagnetic transducer (of the
audio speaker).
Figure 1: Helmholtz resonator of the conversion system
where P
i
– input pressure, P
d
– dispersed pressure and P
t
–
transmitted pressure.
In this research, we also considered the volume
changes of the Helmholtz cavity produced by the
elastic movement of the audio speaker membrane
under the action of the sound pressure wave. In the
direction of propagation of the gas flow, at the end of
the pipe, we introduced an air filter to simulate the
noise attenuator according to the engine architecture
used in this research.
The acoustic conversion system (Figure 1) can be
equated with an electrical circuit shown in Figure 2
where Z
i
is the incident acoustic impedance (specific
to the incident pressure wave in front of the
resonator), Z
d
represents the dissipated impedance of
the resonator (resonant impedance) and Z
t
is the
transmitted impedance (after resonator).
Figure 2: The equivalent electrical circuit of the conversion
system.
In the equivalent circuit, the acoustic analogies
according to Kirchhoff's laws are respected (Nicolae
et al., 2012), where the volumetric acoustic speed is
analogous to the electric current and the acoustic
pressure is analogous to the electric voltage,
according to the equations:
iditd
Z)q(qZqp
(1)
tdi
vvq
(2
)
ttdd
ZqZq
(3
)
where q / q
i
is initial volumetric acoustic speed, Z
i
is
acoustic impedance of the pipe before resonator, q
d
is
volumetric acoustic speed from resonator neck, Z
d
is
acoustic impedance of the Helmholtz resonator, q
t
is
volumetric acoustic speed in front of the resonator, Z
t
is acoustic impedance of the piping after the
resonator.
The resonator was dimensioned considering the
range of diesel engine speeds and the mechanical
resonance frequency of the electromagnetic
transducer. Since we used a single-cylinder engine, in
calculating the resonant frequency of the incident
wave it was no longer necessary to consider the
number of cylinders (Juan et. al., 2017).
The resonant frequency of the Helmholtz system
was calculated using Equation (4) (Brian et. al., 2015;
Nicolae, 2000) where c is the speed of sound, A is the
area of the resonant neck section, l is the length of the
resonant neck, and V is the volume of the resonant
chamber,
Vl
A
π2
c
f
0
(4
)
VEHITS 2021 - 7th International Conference on Vehicle Technology and Intelligent Transport Systems
248
For the calculation of the resonance chamber
volume, the fixed diameter of the electromagnetic
transducer located at the end of the chamber was
considered. The electromechanical transducer (audio
speaker) mounted at the end of the resonant chamber
(Table 1) is used in reverse function. It generates
electricity due to the pulsations of the electromagnetic
core resulting from variations in sound pressure.
Table 1: Technical data of the audio speaker.
Maximum
load
p
owe
r
Moving mass of the
s
p
eake
r
Frequency
ran
g
e
Pz=60 [W] Mms=13.18 [g] f=50-7000 [Hz]
Nominal
p
owe
r
Membrane surface Impedance
Pn=40 [W] Sd=95 [cm
2
] Z=8 [Ω]
Resonance
frequenc
y
Mechanical strength Membrane
elasticit
y
fr=54 [Hz] Rms=1.23 [kg/s] Cms=0.65
[mm/N]
The diesel engine used in this research has the
following technical parameters:
vertical single-cylinder model, four-stroke,
air-cooled, direct injection;
86 mm bore, 72 mm stroke;
maximum power 5.7 kW, speed 3000 rpm;
nominal speed 2880 rpm.
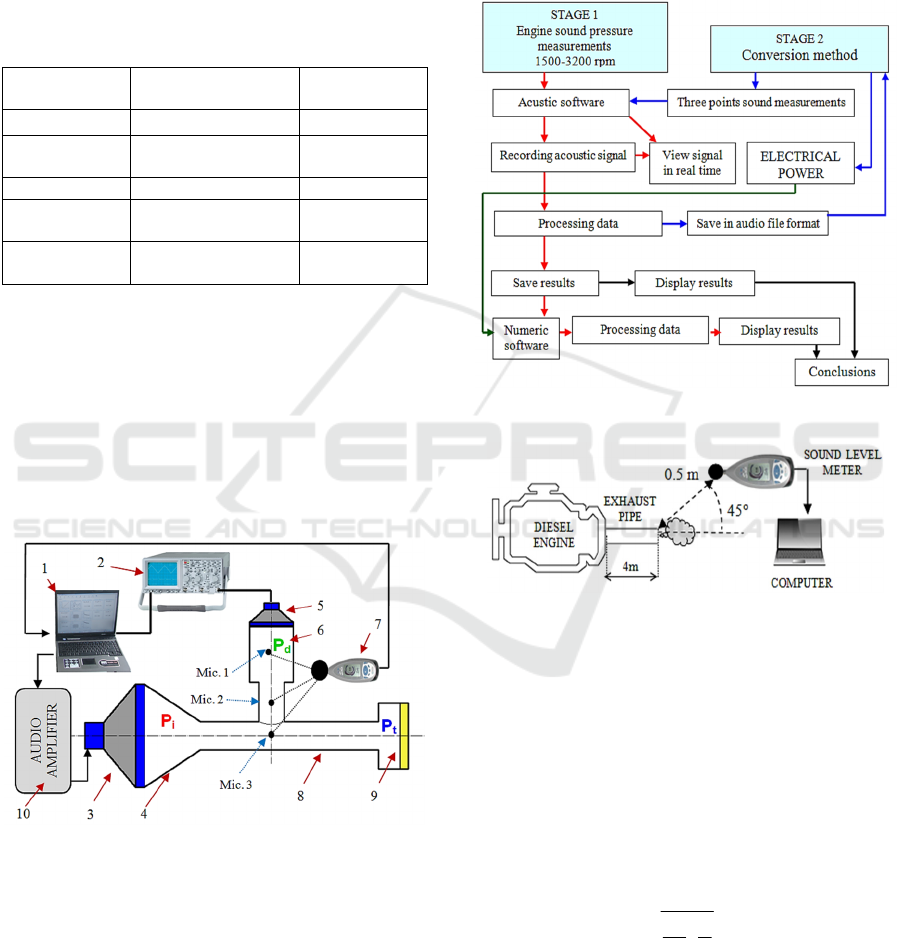
The components of the conversion system are
shown in Figure 3.
Figure 3: Experiment setup for evaluating the acoustic
energy conversion where 1 – laptop, 2 – oscilloscope, 3 –
audio speaker, 4 – metal cone, 5 – electromagnetic
transducer, 6 – Helmholtz resonator, 7 – sound level meter,
8 – metal pipe, 9 – anechoic material, 10 – audio signal
amplifier, Mic. – piezoelectric microphone.
The proposed research method is performed in
two stages. For data collection, in the first stage, noise
measurements are performed. In the second stage,
conversions and data processing are performed.
These research stages require separate laboratory
stands. Figure 4 shows the block diagram and the
sequence of stages of this research.
The first stage (noise measurements) involves
recording the exhaust noise of the single-cylinder
diesel engine for a speed range between 1500 rpm and
3200 rpm at-load free mode (Figure 5).
Figure 4: Methodological scheme of the experiment.
Figure 5: Sound pressure measurements at the end of the
exhaust pipe.
Noise measurements are analysed in real time and
they are processed by the software compatible with
the sound level meters we used. These software’s
allow the sampling of the acoustic signal with a
period of three engine cycles and offering the
possibility to save it in different file formats.
To calculate the required time of three engine
cycles we used Equation (5), (Nicolae, 2000;
Candale, 2013),
2
60
n
k
t
(5
)
where
t
– time sampling, k – number of complete
engine cycles (in our case three), δ
– number of
engine strokes (in our case four) and n – operating
engine speed (rpm).
Estimation of the Acoustic Waste Energy Harvested from Diesel Single Cylinder Engine Exhaust System
249
To determine the corresponding number of values
(x data units) of three engine cycles in the whole
string of values we used the equation:
nacquisitiot
fx
(6)
where f
acquisition
is the acquisition frequency of the
sound level meter (51,200 x/ sec).
In second stage for signal processing, the
conversion of the recorded exhaust noise in audio
format file ("waveform audio file") was performed.
By playing in the conversion system the audio files
containing the noise produced by the engine for each
engine speed range the resulting electric power is
measured.
The sound pressure level from the conversion
system is measured in three points. The first
microphone is placed in the resonator chamber (Mic.
1), the second microphone is mounted in the neck of
the resonator (Mic. 2) and the third microphone (Mic.
3) is placed in front of the resonator (Figure 3).
All measurements are again processed and
analysed within the software programs we used. In
the end of the research, we obtained results like:
sound pressure level of the exhaust noise
depending on engine speed;
sound pressure level measured in the
conversion system;
electrical intensity and voltage generated by
the electromagnetic transducer;
electric power depending on the sound
pressure level and engine speed;
dominant amplitudes in FFT frequencies (Fast
Fourier Transform).
The frequency at which the system begins to
vibrate (resonates) under the action of an external
energy source is also called the resonant frequency.
The resonant frequency depends on the system
characteristics such as density, rigidity, mass,
dimensions, materials, etc. Several experimental tests
are performed to determine the resonant frequency of
the conversion system.
By laboratory tests, the resonant frequency of the
conversion system was determined. Through acoustic
software (tone generator software), sounds with
frequencies between 40 Hz and 200 Hz were played
through the audio speaker. The frequency of the
sound played in the system was increased by a step of
10 Hz.
Each sound played in the system was increased
using an audio amplifier to ensure an SPL of 120 dB
(sound pressure level) equivalent to SPL
MAX
(maximum sound pressure level) of the measured
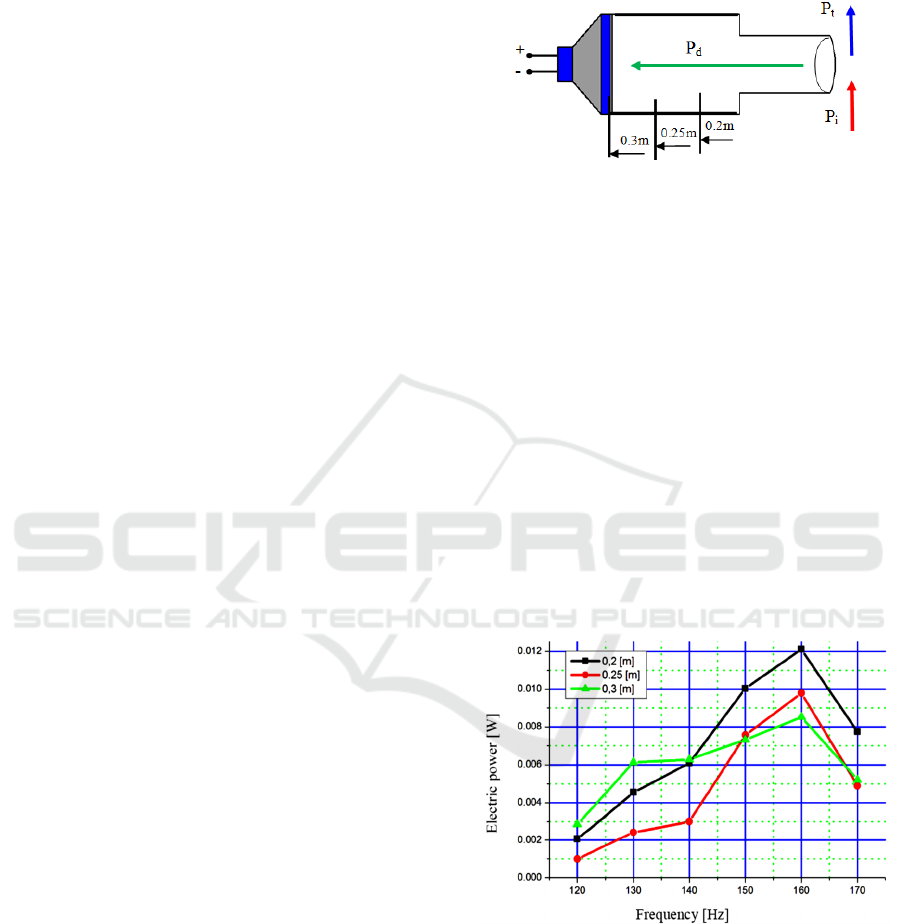
exhaust noise. These tests are performed by
positioning the electromagnetic transducer in the
resonance chamber at different distances from the
Helmholtz resonator neck (0.2 m to 0.3 m) shown in
Figure 6.
Figure 6: Electromagnetic transducer position in the
resonance chamber where Pi – input pressure, Pd –
dispersed pressure and Pt – transmitted pressure.
By playing in the system pure sounds with
different frequencies (keeping the frequency step of
10 Hz) we found that its resonant frequency changes
with the transducer position. If the transducer is
positioned closer to the resonator's neck, the resonant
acoustic frequency increases.
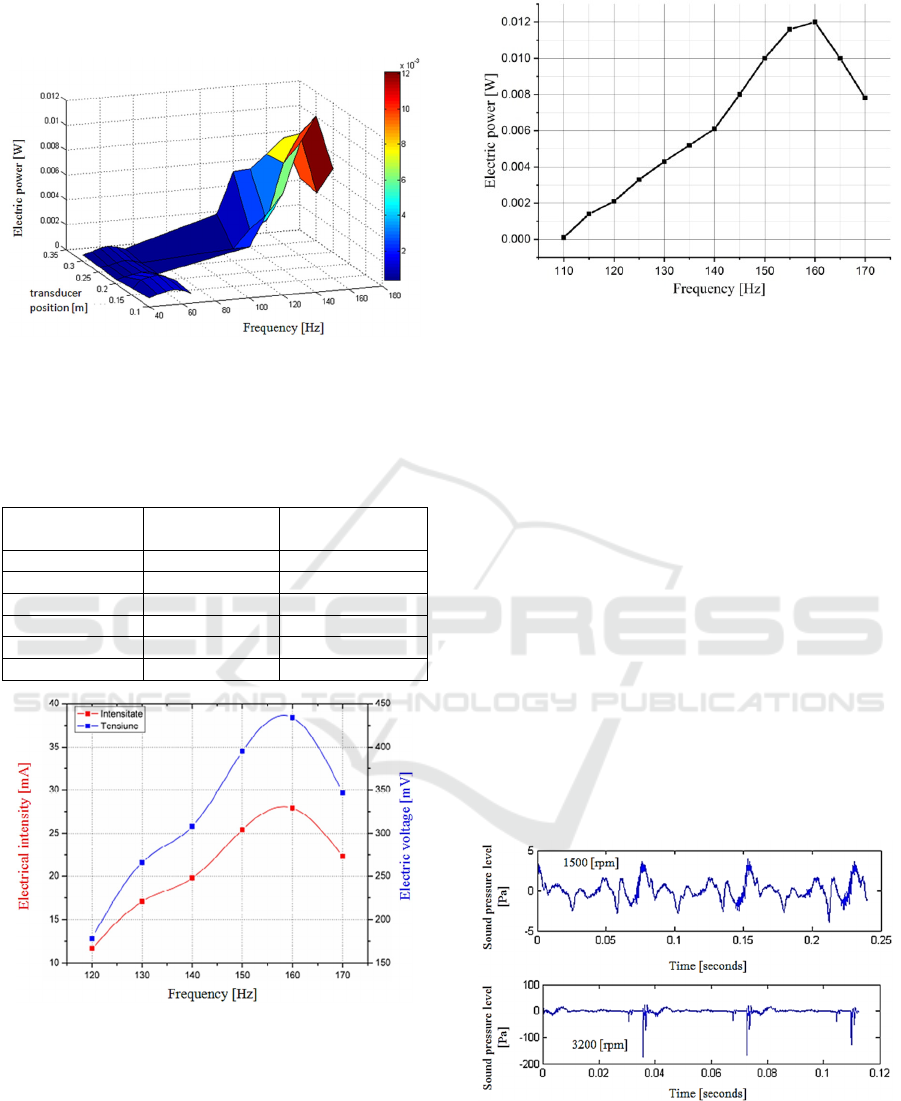
By measuring the electrical voltage generated by
the electromagnetic transducer, the frequency where
we obtained the highest value of electrical voltage
was established. This frequency is corresponding to
the resonant frequency of the conversion system
(Minu, 2015). We found that at a frequency of 160 Hz
a voltage of 434 mV and a current of 27.9 mA is
generated given that the mechanical resonance
frequency of the electromagnetic transducer is 54 Hz,
shown in Figure 7 and Figure 8.
Figure 7: Electrical power generated with the conversion
system for the frequency range of 120 Hz and 170 Hz with
the position of the electromagnetic transducer at 0.2 m, 0.25
m and 0.3 m.
At the frequency of 160 Hz and 0.2 m from the
electromagnetic transducer to the resonator neck, the
generated electric power has the maximum value.
Figure 9 and Table 2 shows the variations of the
electric current with an amperage between 11.6 mA −
VEHITS 2021 - 7th International Conference on Vehicle Technology and Intelligent Transport Systems
250
27.9 mA and the electric voltage between 178 mV −
434 mV.
Figure 8: 3D representation of the electrical power
generated depending on the position of the transducer (0.1
m – 0.3 m) and frequency range of 40 Hz and 180 Hz.
Table 2: The resulting voltage and the electrical intensity
depending on the sound frequency with the electromagnetic
transducer mounted at 0.2 m from the resonator neck.
Frequency [Hz] Electrical
intensit
y
[mA]
Electric voltage
[mV]
120 11.6 178
130 17.1 266
140 19.8 308
150 25.4 395
160 27.9 434
170 22.3 347
Figure 9: Graphical representation of the resulting voltage
and electrical intensity with the electromagnetic transducer
mounted at 0.2 m from the resonator neck.
The graph of the electrical power obtained in the
frequency range of 110 Hz and 170 Hz is presented in
Figure 10. Following the results, the resonant
frequency of the conversion system at 160 Hz can be
confirmed.
Figure 10: The electrical power generated by the conversion
system with the electromagnetic transducer mounted at 0.2
m from the resonator neck.
3 RESULTS
3.1 Sound Pressure Level and
Electrical Power
The sound pressure measured at the outlet of the
diesel engine is processed for the period of three
engine cycles in the speed range between of 1500 rpm
and 3200 rpm, at-load free mode. The recorded sound
pressure values are shown in
Figure 11.
It can be seen how the sound pressure follows the
same law of variation for each engine cycle
performed.
The maximum measured pressure is
between 5 Pa and 100 Pa increasing with the engine
speed.
The time required to perform three engine
cycles decreases with increasing engine speed and it
is between 0.25 and 0.12 seconds.
Figure 11: Sound pressure level recorded for the speed
range of 1500 rpm and 3200 rpm.
By audio playback of the noise produced by the
engine in the conversion system, the variation of the
acoustic pressure for each speed range can be
Estimation of the Acoustic Waste Energy Harvested from Diesel Single Cylinder Engine Exhaust System
251
observed in Figure 12.
The variation of the acoustic
pressure in the system influences the sensitivity of the
electromagnetic transducer by the amount of
electricity generated by it.
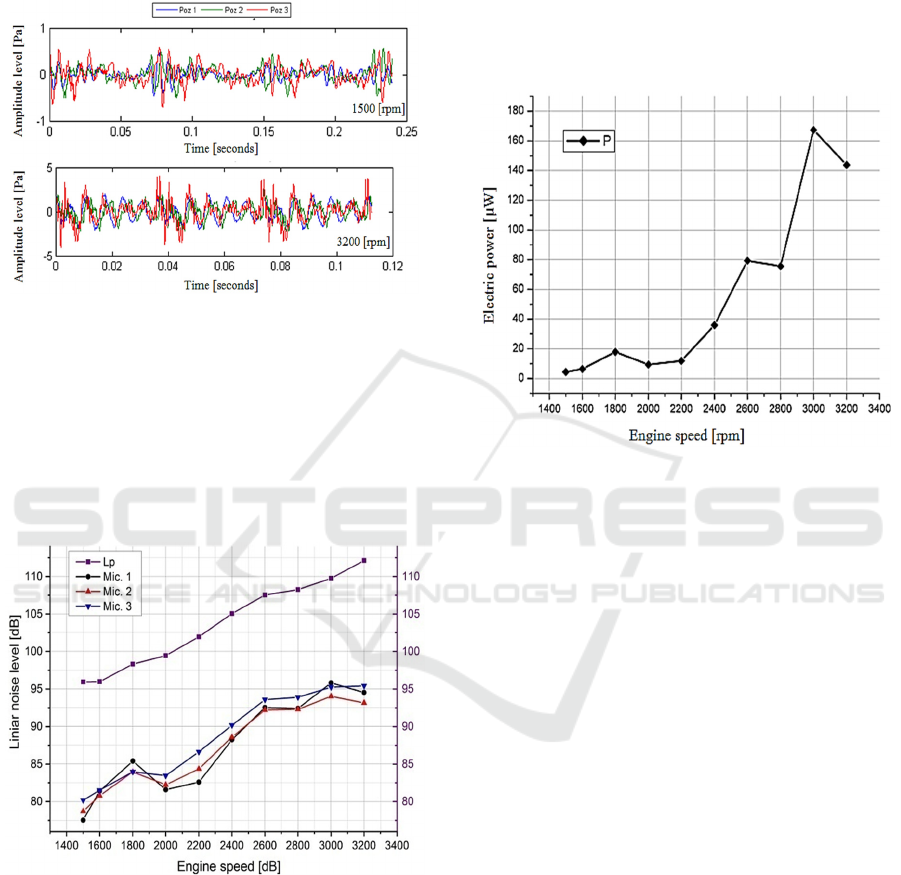
Figure 12: The acoustic pressure recorded for the three
point’s measurements in the conversion system for 1500
and 3200 rpm speed range (poz 1 – Mic.1, poz 2 – Mic.2
and poz 3 – Mic.3).
Figure 13 shows the difference between the noise
level measured physically at the engine exhaust (Lp)
and the noise level measured in the conversion system
through the three points depending on the diesel
engine speed.
Figure 13: The difference between the noise level measured
at the engine exhaust system (Lp) and the noise level
measured in the conversion system.
The experimental results show that the sound
pressure measured in the conversion system is much
lower (1 − 5 Pa) than the sound pressure measured
directly at the engine outlet although the audio
amplifier operates at maximum capacity.
The highest
value of sound pressure was recorded at the
microphone 3 (Mic.3) positioned in front of the
Helmholtz resonator because it is the closest point to
the audio speaker that generates the noise in the
conversion system.
From the graph of the generated electric power
(Figure 14) we found that its value does not comply
with the same law of linear distribution as the noise
level, there are speeds (2800 rpm – 3200 rpm) where
the measured electric power decreases.
Figure 14: Graph of electric power harvested according to
engine speed.
To find out the cause of this difference we
performed an FFT analysis calculation (Fast Fourier
Format).
3.2 Detailed FFT Analysis
The detailed FFT analysis was performed to find the
cause of variations in electrical power and to
determine the dominant amplitudes and their
frequency in terms of frequency spectrum.
Figure 15 shows the FFT analysis of the noise
recorded at the engine exhaust depending on the
engine speed.
The data values resulting from the FFT analysis
are presented in Table 3 as follows:
the value of the dominant amplitude, the
amplitude with the closest frequency to the
resonant frequency of the conversion system
(160 Hz);
the sound pressure level of the maximum
amplitude from the total frequency spectrum;
the frequency of the maximum amplitude,
corresponding to the operating speed of the
combustion engine.
VEHITS 2021 - 7th International Conference on Vehicle Technology and Intelligent Transport Systems
252
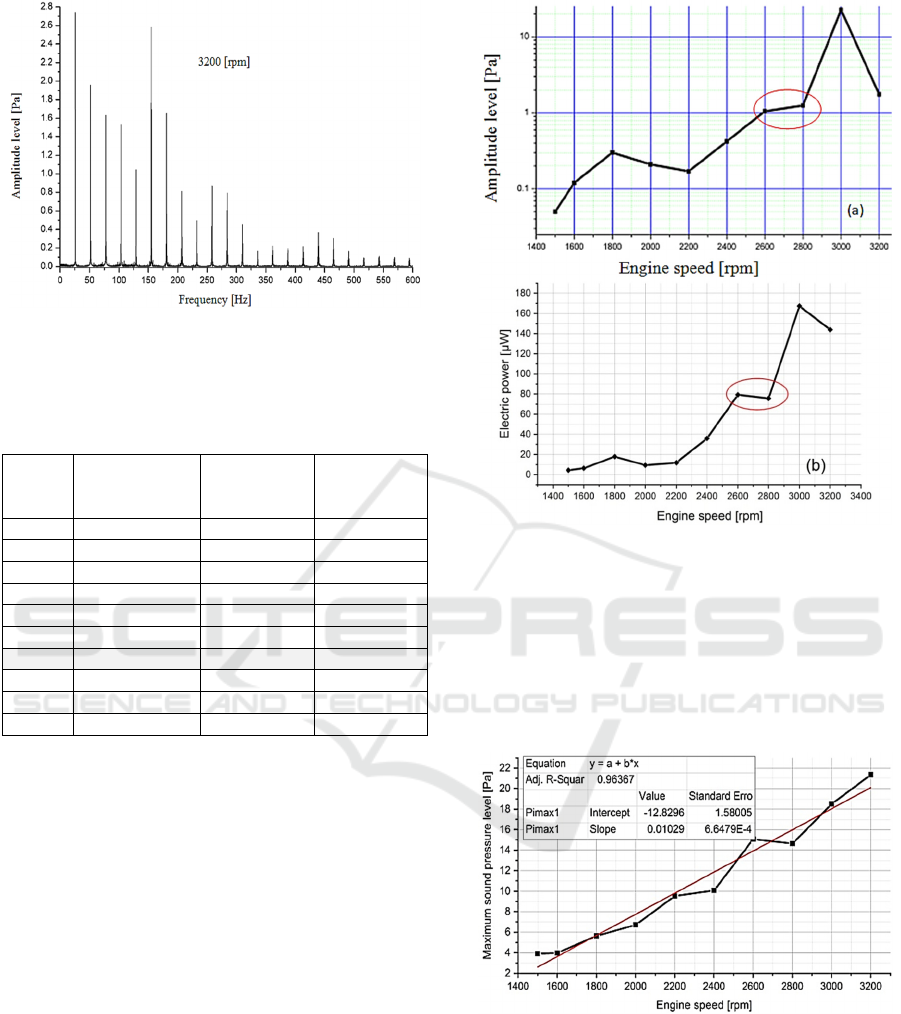
Figure 15: Exemplification of FFT analysis in the low
frequency range of the acoustic signal measured at the
engine exhaust for the speed range 3200 rpm.
Table 3: Data extracted from the FFT analysis of the
acoustic signals recorded at the engine exhaust.
Engine
speed
[r
p
m]
Dominant
pressure
am
p
litudes [Pa]
Maximum
pressure
am
p
litude [Pa]
Frequency of
maximum
am
p
litude [Hz]
1500 0,05 0,50 23
1600 0,12 0,40 23
1800 0,30 0,56 16
2000 0,21 0,83 18
2200 0,17 1,72 19
2400 0,42 2,00 20
2600 1,05 2,17 42
2800 1,25 2,95 25
3000 2,60 2,75 25
3200 1,75 2,75 25
From the obtained values it can be observed how
at most speeds, the frequency of the maximum
amplitude belongs to the low frequency domain with
values below 25 Hz. An exception occurs at the speed
of 2600 rpm where the frequency of the maximum
amplitude is 42 Hz This frequency is the closest to the
mechanical resonance frequency of the low-cost
transducer (54 Hz).
From the graphical representation of the
maximum amplitude of the sound pressure and the
engine speed, we can observe how the amount of
recovered electricity depends on the intensity of the
amplitudes closest to the resonant frequency of the
system.
Comparing the maximum amplitudes (Figure
16.a) with the graph of the measured electric power
(Figure 16.b), we found that the frequency of the
dominant amplitude is found around the resonant
frequency of the system. Due to this, the energy
recovered from the system does not comply with the
same law of variation valid for engine speeds.
Figure 16: The variation graphs of (a) the dominant
amplitudes found closest to the resonant frequency of the
conversion system compared to (b) the electric power (P)
generated by the system.
From the analysis regarding the maximum sound
pressure level measured at the engine exhaust for
each engine speed (Figure 17), it can be seen how it
increases linearly with the engine speed.
Figure 17: Variation of the maximum sound pressure level
of the noise recorded at the engine exhaust for each
operating speed and linear interpolation.
From the analysis of the noise level measured in
the three positions of the system (Figure 18), it can be
seen how the highest sound pressure level was
measured in the positions of microphones 3 and 2
(closest to the noise source).
Estimation of the Acoustic Waste Energy Harvested from Diesel Single Cylinder Engine Exhaust System
253
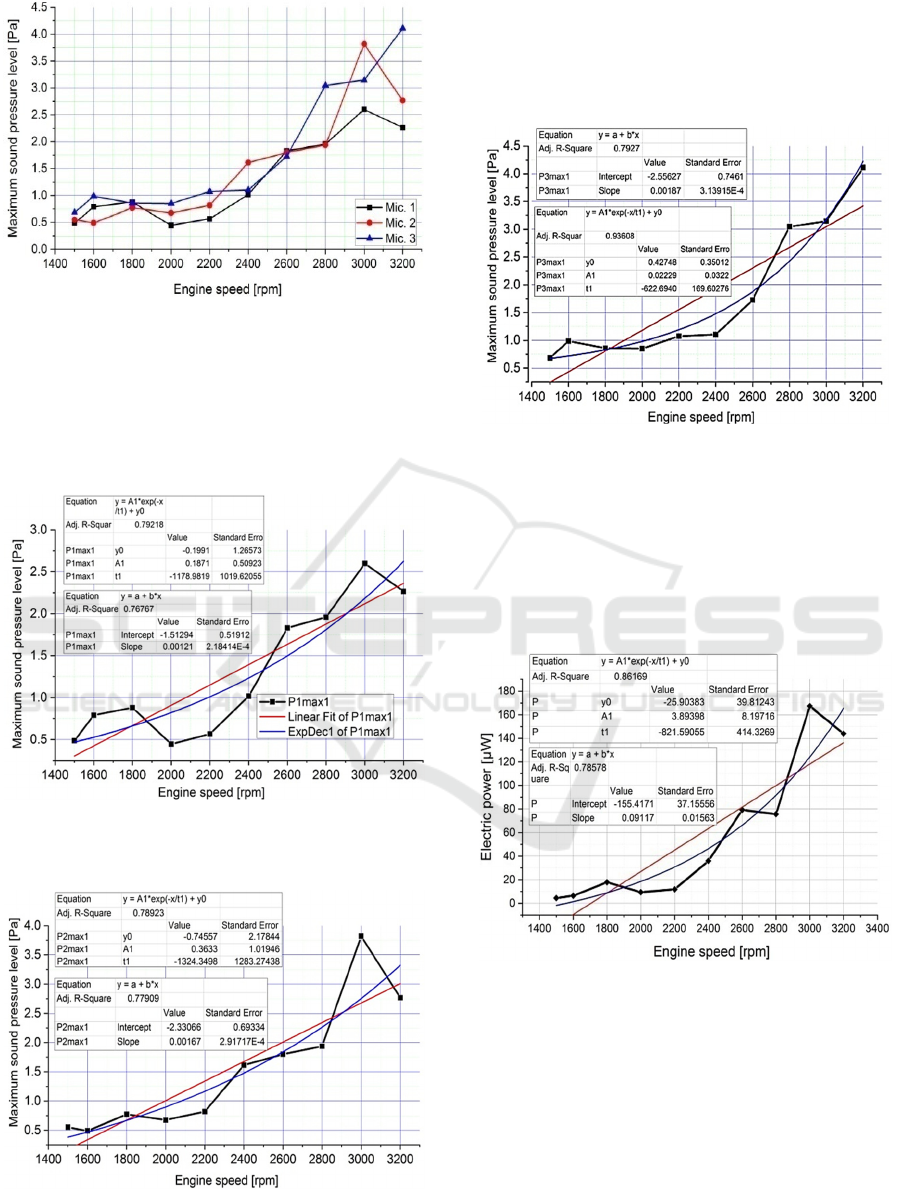
Figure 18: Variation of the maximum sound pressure level
of the noise recorded at the engine exhaust for each
operating speed and linear interpolation.
The maximum sound pressures level for the three
positions measurements are represented by linear and
exponential interpolation in Figure 19, Figure 20 and
Figure 21.
Figure 19: Linear and exponential interpolation of the noise
measured in point 1 (Mic.1) of the conversion system for
each engine speed.
Figure 20: Linear and exponential interpolation of the noise
measured in point 2 (Mic.2) of the conversion system for
each engine speed.
From these representations, only in the case of the
acoustic pressure measured by the microphone 3
(Figure 21), it can be said that its variation respects a
law of exponential growth with the increase of the
speed.
Figure 21: Linear and exponential interpolation of the noise
measured in point 3 (Mic.3) of the conversion system for
each engine speed.
The recovered power values in the system are
represented by linear and exponential interpolation in
Figure 22. Also, in this case the variation law respects
an exponential growth depending on the engine
speed.
Figure 22: Linear and exponential interpolation of
recovered electrical power with the conversion system.
4 CONCLUSIONS
At the end of our research and experiments, the
proposed conversion system works but the amount of
electricity generated is low (165 µW).
Compared to other research methods in the field
of residual acoustic energy harvesting, the maximum
energy value was obtained using thermoacoustic
VEHITS 2021 - 7th International Conference on Vehicle Technology and Intelligent Transport Systems
254

transducers with a power of 11.58W (Backhaus et al.,
2012), piezoelectric transducers 12.397 mW (Bin et
al., 2012) followed by electromagnetic transducers
789, 65 μW (Farid, 2015) and 2.4 μW (Ming et al.,
2018).
Helmholtz type resonators are mainly influenced
by the resonant frequency. One possible reason for
the low harvested electrical power is the low value of
the resonant frequency of the conversion system (160
Hz). This is due to elements such as the large diameter
of the audio speaker (130 mm) influencing the
dimensions of the resonant chamber, the rigidity of
the elastic membrane, the mass of the oscillating
system and the density of the materials used.
Research in the field has concluded that with the
increase of the resonant frequency of this type of
recovery system, the harvested electrical power also
increases. The resonance frequency can be increased
by choosing a more sensitive electromagnetic
transducer with a very elastic membrane, an
oscillating mechanism with a lower weight, reducing
the volume in the resonance chamber and positioning
the transducer as close as possible to the noise source.
Another possible reason may be that the noise on
the engine exhaust system piping is in the form of
plane sound waves and the noise measured at the
outlet propagates in the form of spherical waves. The
amplitude of the spherical sound pressure wave
decreases with distance.
Given that the reproduction of sound (by audio
playback) in the conversion system was achieved at a
much lower level compared to the sound pressure
level physically measured at the exhaust of the single-
cylinder diesel engine, the amount of energy that
could be converted directly from the exhaust system
of the engine would be proportionately bigger.
Also, noise level in the exhaust pipe is bigger than
the noise level measured at 0.5 m from the end of the
pipe and at an angle of 45° to the axis of the pipe
(Figure 5) and therefore the conversion potential is
higher.
From (Figure 9) and (Figure 10) we can see that
the collected power is higher when the noise level
increases and when the acoustic wave form is close to
the sensibility of the traducer near to the resonant
frequency of the conversion system.
The proposed conversion system, equipped with a
Helmholtz resonator, works by harvesting low power
energy. The electricity generated depends on the
operating speed of the engine this is explained by the
increase in the noise level as the engine speed
increases.
The biggest challenges for continuing this
research are increasing the resonance frequency,
increasing the electrical power and finding a storage
method for later use. Also, the proposed conversion
system can be developed through noise reduction
research at the intake and exhaust system of internal
combustion engines. In this case the high temperature
of the exhaust gases requires the selection of some
transducers with high temperature resistance.
REFERENCES
Cotana, F., Rossi, F., Buratti, C., 2002. Active noise control
technique for diesel train locomotor exhaust noise
abatement. In 144th meeting of the Acoustical Society of
America. Cancun, Mexico, pp. 1-7.
Backhaus, S., Yu, Z., Jaworski, A.J., 2012. Travelling-wave
thermo-acoustic electricity generator using an ultra-
compliant alternator for utilization of low-grade thermal
energy. In Applied Energy. pp. 135-145.
Bin, L., Andrew, J., Jeong, H.Y., 2012. Acoustic energy
harvesting using quarter-wavelength straight-tube
resonator. In ASME, International Mechanical
Engineering Congress & Exposition. Houston, Texas,
USA, pp. 467-473.
Brian, C., Jordan, M., William, W., et. al., 2015. Experimental
realization of extraordinary acoustic transmission using
Helmholtz resonators. In AIP Advances 5.
Candale, L., 2013. Research on the recovery of acoustic energy
from vehicle noise and the conversion into electricity. In
PhD Thesis. Tech. Univ. of Cluj-Napoca, 157-181.
Farid, U.K., 2015. Electromagnetic energy harvester for
harvesting acoustic energy. In Indian Academy of
Sciences. Pakistan, volume 41, pp. 397-405.
Filip, N., 2000. Vehicle noise, Publishing House Todesco.
Cluj-Napoca, Romania.
Filip, N., Fodor, G., Candale, L., 2012. Estimation of acoustic
energy harvested from sound using electromagnetic
transducer. In New Trends and Perspectives, 15
th
International Conference on Experimental Mechanics.
Porto, Portugal, pp. 555-557.
Ganghua, Y., Deyu, L., Cheng, L., 2008. Effect of internal
resistance of a Helmholtz resonator on acoustic energy
reduction in enclosures. In The Journal of the Acoustical
Society of America. volume 124, pp. 3534- 3543.
Juan, L., Yifeng, L., et. al., 2017. Manipulation of acoustic
wavefront by gradient metasurface based on Helmholtz
Resonators. In Scientific Reports, Nature.
Kees de Blok, 2010. Novel four-stage travelling wave thermo-
acoustic power generator. In ASME, 3
th
Joint US-
European Fluids Engineering Summer Meeting with 8
th
International Conference on Nano-channels, Micro-
channels and Mini-channels. Montreal, Canada, pp. 73-79.
Martin, D., Michael, K., Echart, K., et al., 2018. Experimental
Study of Advanced Helmholtz Resonator Liners with
Increased Acoustic Performance by Utilising Material
Damping Effects. In Applied Sciences. volume 8, pp. 1-18.
Matova, S.P., 2010. Harvesting energy from airflow with
micro-machined piezoelectric harvester inside a
Estimation of the Acoustic Waste Energy Harvested from Diesel Single Cylinder Engine Exhaust System
255

Helmholtz resonator. In Proc. Power MEMS. Leuven,
Belgium, pp. 183-186.
Ming, Y., Xiaohui, W., Zhenjun, D., 2018. Low frequency
acoustic energy harvesting adopting slit Helmholtz
resonator. In Vibroengineering Procedia. volume 20,
Nanjing, China, pp. 151-155.
Minu, A., Ezhilarasi, D., 2015. Improved acoustic energy
harvester using tapered neck Helmholtz resonator and
piezoelectric cantilever undergoing concurrent bending
and twisting. In ICOVP, 12
th
International Conference on
Vibration Problems. Tamilnadu, India, pp. 674-681.
Myonghyon, H., 2008. Sound reduction by a Helmholtz
resonator. In PhD Thesis. The department of Mechanical
Engineering and Mechanics, Lehigh University, pp. 33-48.
Zhibin, Y., Arthur, J., 2010. Design of a low-cost thermo-
acoustic electricity generator and its experimental
verification. In 10
th
Biennial Conference on Engineering
Systems Design and Analysis. Istanbul, Turkey, pp. 191-
199.
Diesel Engine Service Manual, KM186FA, Available online:
www.link.com (last access: 06.09.2020).
User manual, Handbook of 01dB Software. Vibrotest,
DBFA - NetdB12, Software Version 4.801.
VEHITS 2021 - 7th International Conference on Vehicle Technology and Intelligent Transport Systems
256
