
Analysing Clustering Algorithms Performance in CRM Systems
Indrit Enesi, Ledion Liço, Aleksander Biberaj and Desar Shahu
Department of Electronics and Telecommunications, Polytechnic University of Tirana,
“Mother Teresa” Square, Nr. 1, Tirana, Albania
Keywords: CRM, Data Mining, Cluster Techniques, K-means, K-medoids, Elbow Algorithm.
Abstract: Customer Relationship Management technology plays an important role in business performance. The main
problem is the extraction of valuable and accurate information from large customers’ transactional data sets.
In data mining, clustering techniques group customers based on their transaction’s details. Grouping is a
quantifiable way to analyse the customers’ data and distinguish customers based on their purchases. Number
of clusters plays an important role in business intelligence. It is an important parameter for business analysts.
In this paper the performance of K-means and K-medoids algorithm will be analysed based on the impact of
the number of clusters, number of dimensions and distance function. The Elbow method combined with K-
means algorithm will be implemented to find the optimal number of clusters for a real data set from retail
stores. Results show that the proposed algorithm is very effective when customers need to be grouped based
on numerical and nominal attributes.
1 INTRODUCTION
Customer Relationship Management (CRM)
technology is a mediator between customer
management activities and business performance
(Mohammed et al, 2014). Customer Segmentation
gives a quantifiable way to analyse the customer data
and distinguish the customers based on their purchase
transactions (Sarvari et al, 2016). Customers can be
grouped into different categories for which the
marketing people can employ targeted marketing and
thus retain the customers increasing the business
performance. Once the customers are clustered, rules
can be generated to increase business performance.
Data mining is the process of extracting useful
information from large volumes of data. Different
techniques use statistical, mathematical, artificial
intelligence and machine learning as analysing
techniques (Palmer et al.2011). Its predictive power
comes from unique design by combining techniques
from machine learning, pattern recognition, and
statistics to automatically extract concepts, and to
determine the targeted interrelations and patterns
from large databases. Organizations get help to use
their current reporting capabilities to discover and
identify the hidden patterns in databases. The
extracted patterns from the database are then used to
build data mining models and can be used to predict
performance and behaviour with high accuracy.
Descriptive and Predictive data mining are the most
important approaches that are used to discover hidden
information (Coenen, 2004; Sondwale, 2015).
Clustering is one of the most important techniques of
the descriptive model. It finds a useful application in
CRM where large amount of customer data is dealt
(Ngai et al, 2009). Clustering technique in data
mining produces clusters for the given input data
where data in one cluster is more similar when
compared to data in other clusters. The similarity is
measured in terms of the distance between the data
(Madhulatha, 2012). The different ways in which
clustering methods can be compared are partitioning
criteria, separation of clusters, similarity measures
and clustering space. Clustering algorithms can be
categorized into partition-based algorithms,
hierarchical-based algorithms, density-based
algorithms and grid-based algorithms.
These methods vary in: (a) the procedures used for
measuring the similarity (within and between
clusters), (b) the use of thresholds in creating clusters,
(c) the way of clustering, that is, whether they allow
objects to belong to strictly to one cluster or can
belong to more clusters in different degrees and the
structure of the algorithm (Shah et al, 2015), (Lico,
2017). Widely used partitioning clustering methods
are K-Medoids and K-Means.
Enesi, I., Liço, L., Biberaj, A. and Shahu, D.
Analysing Clustering Algorithms Performance in CRM Systems.
DOI: 10.5220/0010511008030809
In Proceedings of the 23rd International Conference on Enterprise Information Systems (ICEIS 2021) - Volume 1, pages 803-809
ISBN: 978-989-758-509-8
Copyright
c
2021 by SCITEPRESS – Science and Technology Publications, Lda. All r ights reserved
803
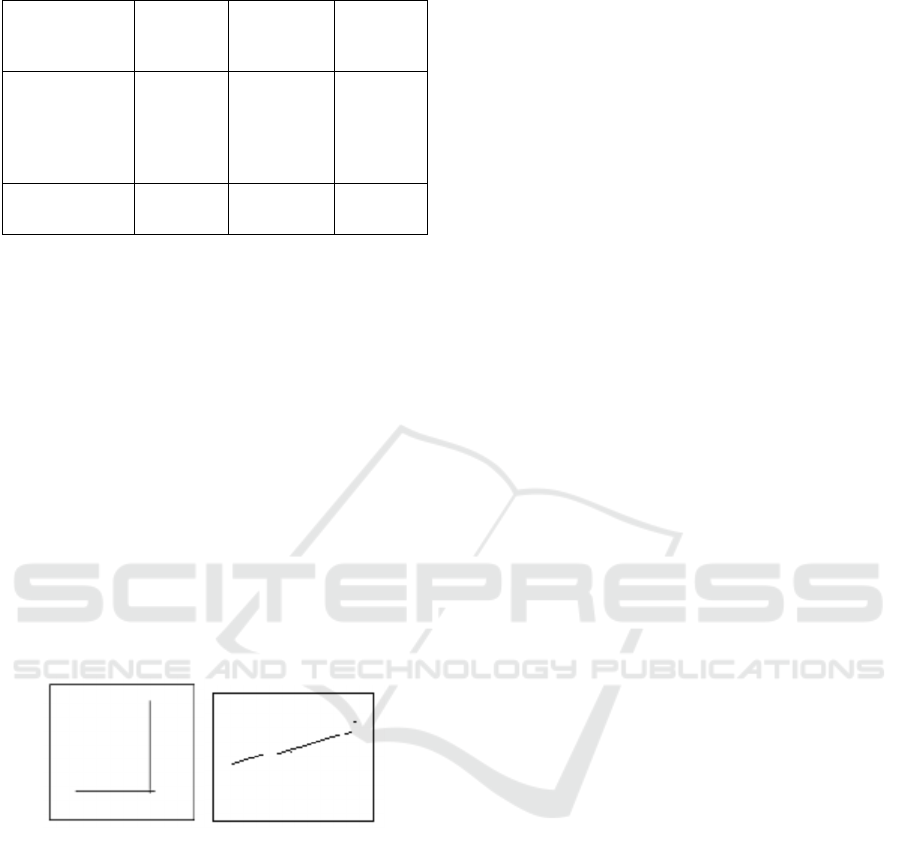
Table 1: Clustering Algorithms.
Partition-based
algorithms
Hierarchic
al-based
algorithms
Density-
based
algorithms
Grid-based
algorithms
K-Means Agglomera
tive
(BIRCH,
CHAMAL
EON)
DBSCAN STING
K-Medoids
(PAM, CLARA)
Divisive DENCLUE CLIQUE
In the paper K-Means algorithm is used for
clustering. The basic requirement of K-Means
clustering is that taking the number of cluster as ‘k’
from the user initially. A mean value as a
representation of the cluster is based on similarity of
the data items in a cluster. The mean or centre point
of the cluster is known as ‘centroid’. Centroid is a
value which can be find out through the mean of
related points. K-means algorithms simple and have
high speed access to databases on very large scales
(Kalra et al, 2018).
K-medoids clustering is a variant of K-means that
is more robust to noises and outliers. Instead of using
the mean point as the centre of a cluster, K-medoids
use an actual point in the cluster to represent it.
Medoid is the most centrally located object of the
cluster, with minimum sum of distances to other
points (Han, 2011).
Figure 1: Manhattan distance and Euclidean distance.
Several methods exist to identify the optimal
number of clusters for a given dataset, but only some
of them provide reliable and accurate results, such as
Elbow method, Average Silhouette method and Gap
Statistic method (Tripathi et al. 2018) (Babič et al,
2019) (Yan et al, 2007).
For a well-distributed data set, it is observed that
the mean cluster density decreases with the increase
number of clusters in a non-linear fashion. The
resulting graph looks similar to that of the graph
obtained in Elbow method wherein the decrease in
mean cluster density is rapid when K is less than the
optimal value and gradually decreases as it nears the
optimum number of clusters, after which the gradient
becomes almost constant or the graph changes
direction. This region is known as the “Elbow”
region. Amongst the points in the elbow region lies
the optimum number of clusters. Sometimes, the
elbow region contains a high range of values. In this
scenario, coupling this algorithm with pre-existing
methods such as the Average Silhouette method or
any of the available methods will provide the required
output (Nanjundan et al, 2019).
Cluster variation, execution time and number of
iterations are evaluated based on number of clusters
for 2 and 5 attributes for Euclidian and Manhattan
distances. Elbow method combined with K-means is
used for finding optimal number of clients’ clusters.
The main issue of the paper is to find the most
appropriate number of clients groups of a retail
department store based on their annual purchases and
quantities. Weka and Python are used as data
analytics tools.
The rest of the paper is organized in the following:
in Section 2 we describe the customer grouping
process and clustering algorithms. In section 3 we
implement clustering algorithms on a real dataset and
their performance is analysed. In Section 4 we
compare the clustering results obtained by clustering
algorithms. Finally, conclusions and future works are
described in sections 5 and 6.
2 CLUSTERING
Clustering is an unsupervised classification where
there are no predefined classes. The data in the data
set are assigned to one of the output class depending
upon its distance to other data. The data within each
class form a cluster. The number of clusters is equal
to the number of output classes. The clustering
technique produces clusters in which the data inside a
cluster has high intra class similarity and low inter
class similarity. Clustering is mainly classified into
hierarchical and partitioning algorithms. The
hierarchical algorithms are further sub divided into
agglomerative and divisive. Agglomerative
clustering treats each data point as a singleton cluster
and then successively merges clusters until all points
have been merged into a single cluster. Divisive
clustering treats all data points in a single cluster and
successively breaks the clusters till one data point
remains in each cluster. Partitioning algorithms
partition the data set into predefined k number of
clusters (Datanovia, 2021).
Clustering is used to group the clients based on
transaction data. K-Means and K-Medoids are still
the most used algorithms for clustering because of
ICEIS 2021 - 23rd International Conference on Enterprise Information Systems
804

their simplicity. Anyway, many challenges raise in
the use of these algorithms such as: a) identifying the
right number of clusters, b) the metrics to be used, c)
the performance for high-dimension data, d) the local
nature of the algorithms. This issues need to be
addressed to improve the performance of these
algorithms
.
2.1 K-means Algorithm
The K-means algorithm defines the centroid of a
cluster as the mean value of the points within the
cluster. First, it randomly selects k objects in D, each
of which initially represents a cluster mean or centre.
Remaining objects are assigned to the clusters to
which they are the most similar, based on the
Euclidean distance between the object and the cluster
mean. Then the K-means algorithm iteratively
improves the within-cluster variation. For each
cluster, a new mean is computed using the objects
assigned to the cluster in the previous iteration. All
the objects are then reassigned using the updated
means as the new cluster centres. The iterations
continue until the assignment is stable, that is, the
clusters formed in the current round are the same as
those formed in the previous round (Han et al, 2011).
The within-cluster variation can be calculated from
the formula below:
E
∑
distp,ci
∈
(1)
In this formula, k is the number of clusters, p are the
objects in the cluster Ci and ci is the centroid of
cluster Ci. The aim is to lower the variation E and to
make the clusters as separate as possible (Sondwale,
2015).
The steps in K-means algorithm are as follows:
1. Initialize centres for k clusters randomly
2. Calculate distance between each object to k-
cluster centres using the formula given by
Eq. 1
3. Assign objects to the nearest cluster centre
4. Calculate the centre for each cluster as the
mean value of the objects assigned to it
5. Repeat steps 2 to 4 until the objects assigned
to the clusters do not change.
In this the assignment of objects to k clusters depends
on the initial centres of the clusters. The output differs
if the initial centres of the clusters are varied. It is not
suitable to discover clusters with non-elliptical shapes
because the objects are scattered around the centre of
the clusters.
2.2 K-medoids Algorithm
Instead of taking the mean value of the objects in a
cluster as a reference point, we can pick actual objects
to represent the clusters, using one representative
object per cluster.
Remaining objects are assigned to the clusters where
the representative objects are the most similar. The
partitioning method is then performed based on the
principle of minimizing the sum of the dissimilarities
between each object p and its corresponding
representative object. The absolute-error criterion is
defined as:
E
∑
distp,oi
∈
(2)
where E is the sum of the absolute error for all objects
p in the data set, and oi is the representative object of
Ci. This is the basis for the k-medoids method, which
groups n objects into k clusters by minimizing the
absolute error (Sondwale, 2015).
Steps of K-Medoids algorithm are:
1. Initialize: randomly select k of the n data
points as the medoids
2. Assignment step: Associate each data point
to the closest medoid.
3. Update step: For each medoid m and each
data point o associated to m swap m and o
and compute the total cost of the
configuration (that is, the average
dissimilarity of o to all the data points
associated to m). Select the medoid o with
the lowest cost of the configuration.
Repeat alternating steps 2 and 3 until there is no
change in the assignments.
2.3 The Elbow Method
The Elbow method is based on the observation that
the increased number of clusters trend to reduce the
sum of within-cluster variance of each cluster. More
clusters allow one to capture finer groups of data
objects that are more similar to each other. However,
the marginal effect of reducing the sum of within-
cluster variances may drop if too many clusters are
formed, because splitting a cohesive cluster into two
Analysing Clustering Algorithms Performance in CRM Systems
805
gives only a small reduction. Consequently, the right
number of clusters is the turning point in the curve of
the sum of within-cluster variances regarding the
number of clusters.
Technically, for a given positive number k > 0, k
clusters are formed on the data set using a clustering
algorithm and the sum of within-cluster variances is
calculated. The curve of variances based on k is
plotted. The first (or most significant) turning point of
the curve suggests the “right” number of clusters
(Sondwale, 2015).
Steps of Elbow algorithms are:
1. Compute clustering algorithm for different
values of k.
2. For each k, calculate the total within-cluster
sum of square (wss).
3. Plot the curve of wss according to the
number of clusters k.
4. The location of a bend (knee) in the plot is
generally considered as an indicator of the
appropriate number of clusters.
3 IMPLEMENTATION OF
K-MEANS AND K-MEDOIDS IN
A REAL DATASET
3.1 Analyses of K-means and
K-medoids
A real dataset with the annual sales of 13,260 clients
were used. Annual sales and quantities were filtered
and grouped. Before applying clustering algorithms,
the data were normalized because if different
components of data (features) have different scales,
then derivatives tend to align along directions with
higher variance, which leads to poorer/slower
convergence. In our case we want our features to be
treated equally. Both algorithms were applied in
different scenarios. First K-Means algorithm was
applied on dataset using Weka tool. It was executed
for different number of clusters. Euclidian and
Manhattan distances are analysed. Three other
nominal attributes were added to the data (city, age
and gender of the client). K-means was executed
again with new dimensions. The values of within-
cluster cluster variation, number of iterations and the
time of the execution were measured depending of
number of clusters.
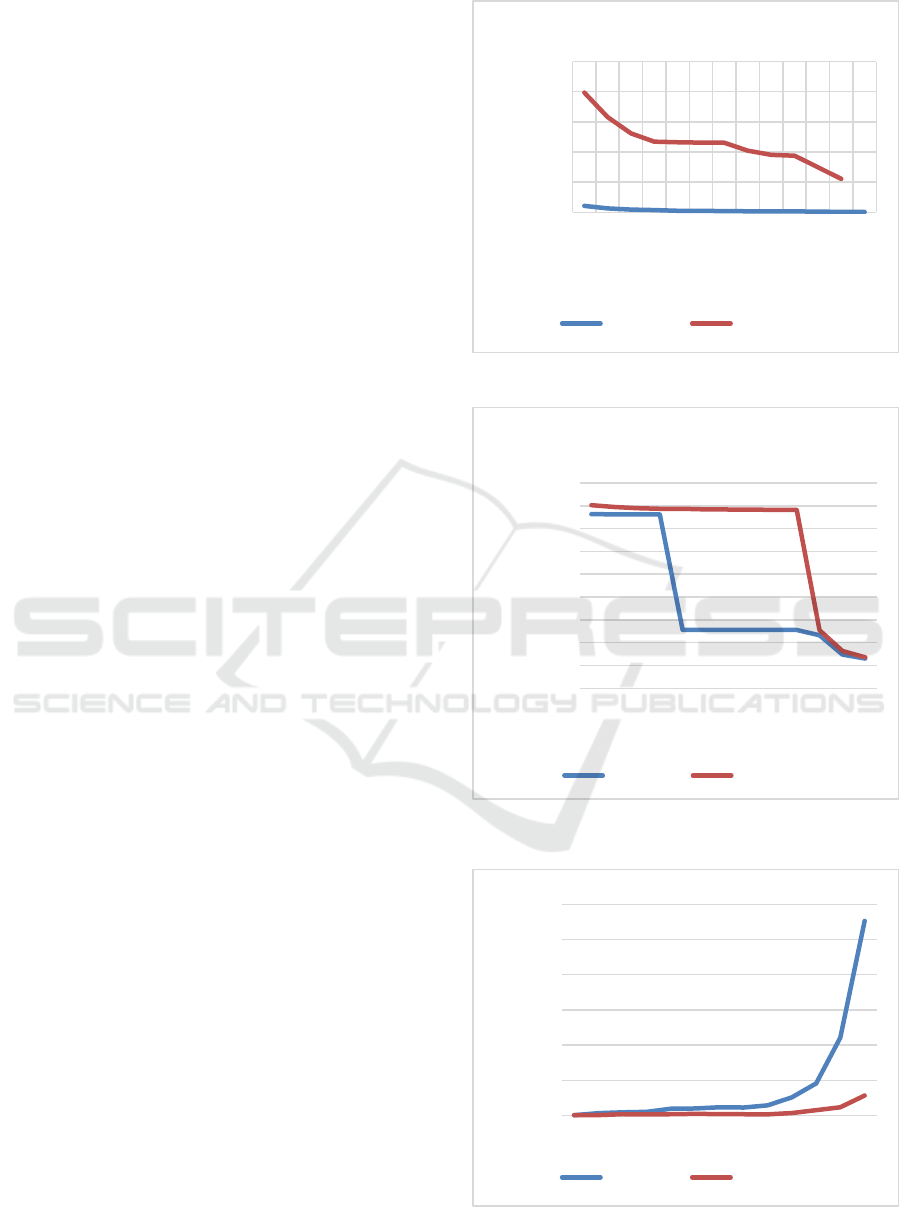
Figure 2: e-Variation for 2 attributes.
Figure 3: e-Variation for 5 attributes.
Figure 4: Execution time from number of iterations for 2
attributes.
0
50
100
150
200
250
2
3
4
5
6
7
8
9
10
11
20
50
100
E‐Variation
NrofClusters
Within-Cluster Variation -2 attributes
Euclidian Manhattan
0
500
1000
1500
2000
2500
3000
3500
4000
4500
2
3
4
5
6
7
8
9
10
11
20
50
100
E‐Variation
NrofClusters
Within-Cluster Variation -
ManhattanDistance
Euclidian Manhattan
0
5
10
15
20
25
30
2
3
4
5
6
7
8
9
10
11
20
50
100
ExecutionTimeinseconds
NrofClusters
Execution Time-2 attributes
Euclidian Manhattan
ICEIS 2021 - 23rd International Conference on Enterprise Information Systems
806
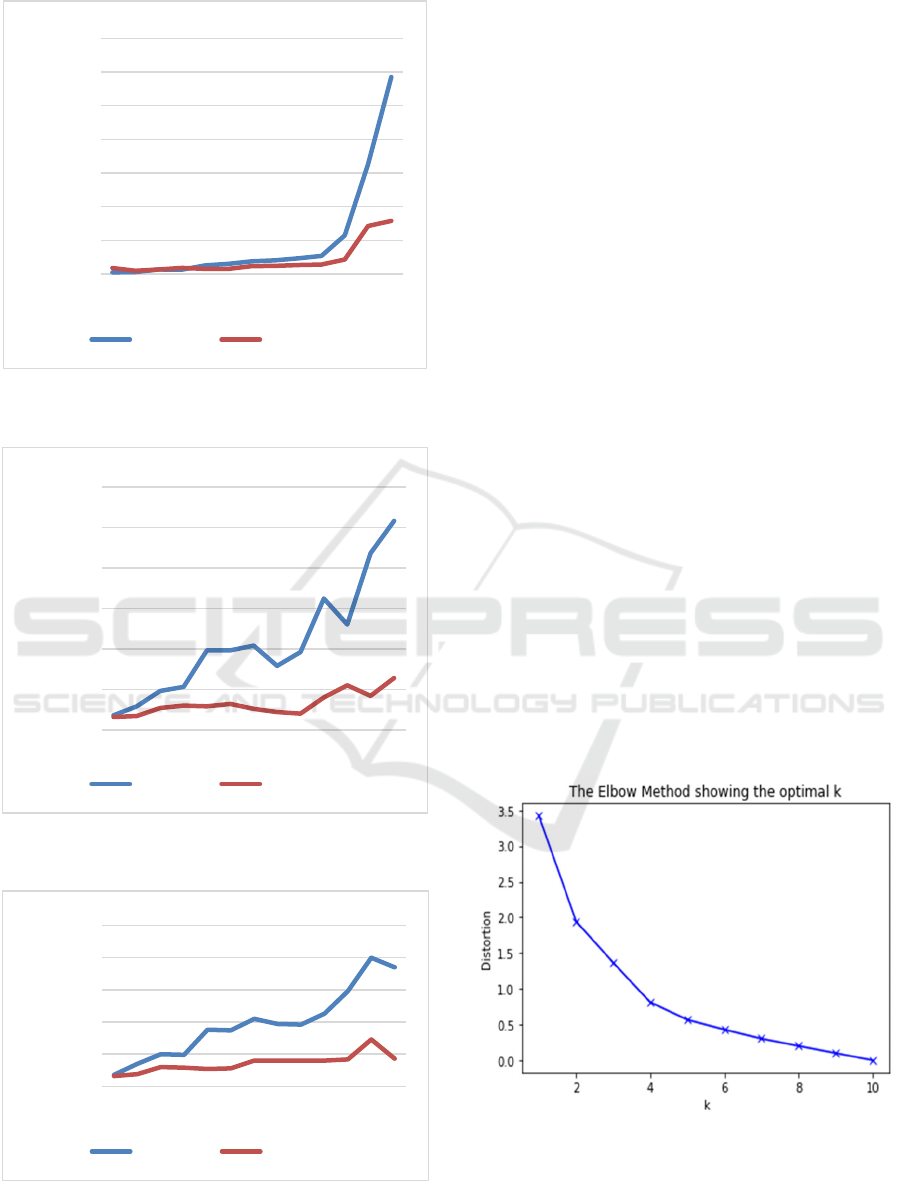
Figure 5: Execution time from number of iterations for 5
attributes.
Figure 6: Number of iterations from number of Clusters for
2 attributes.
Figure 7: Number of iterations from number of clusters for
5 attributes.
It can be seen from the results that K-Means performs
really good with two numerical values and Euclidian
distance but the performance deteriorates when
Manhattan distance is used. With the additions of
nominal attributes and the increased number of
dimensions the performance for both Euclidean and
Manhattan distances measures is not very different
from one another. It yields that K-means is very good
when continuous numerical values attributes and
Euclidian Distance are used. With the addition of
categorical or nominal attributes K-means
performance deteriorates and there is little impact
from the distance of the measure used.
It is observed that when Manhattan distance is
used, the number of iterations and execution time is
decreased. It is argued from the fact that K-means
algorithm uses the median and not the mean as a
centroid when Manhattan distance is used.
3.2 Finding the Optimal Number of
Clusters
The aim of the study is to categorize clients based on
their purchases and quantities. Only these two
attributes will be used for clustering. From section 3.1
it was concluded that K-means with the Euclidian
distance performs well in this case. The challenge
remains in finding the optimal number of clusters.
The Elbow method was used to find the optimal
number of clusters. This number represents the best
within cluster variance and clusters are the far from
each other. Python language was used to calculate this
value as below:
Figure 8: Optimal number of clusters based on elbow
method.
From the plot, it can be seen that the optimal number
of cluster is 4. K-Means and K-Medoids will be run
with the predefined 4 number of cluster. For K-
0
2
4
6
8
10
12
14
2
3
4
5
6
7
8
9
10
11
20
50
100
ExecutionTimeinseconds
NrofClusters
Execution Time-5 attributes
Euclidian Manhattan
0
50
100
150
200
250
300
2
3
4
5
6
7
8
9
10
11
20
50
100
NrofIterations
NrofClusters
Iteration Nr-2 attributes
Euclidian Manhattan
0
50
100
150
200
250
2
3
4
5
6
7
8
9
10
11
20
50
100
NrofIterations
NrofClusters
Iteration Nr-5 attributes
Euclidian Manhattan
Analysing Clustering Algorithms Performance in CRM Systems
807
Means, Weka is used as an analytics tool. For
implementing K-Medoids, Python will be used.
4 COMPARISON OF
ALGORITHMS
For the predefined number of clusters equal to 4, the
results from K-medoids algorithm are shown in table
2 and results from K-means algorithm are shown in
table 3. Different results are produced by running K-
means algorithm using the Euclidian distance and the
means and K-Medoids ones using Manhattan distance
and the medoids. In section 3.1 resulted that
Euclidian distance is better when 2 continuous
numeric values were used. From the analyses of the
clustered data by both algorithms, it was noticed that
the segmentation done by K-means in more efficient
for our retail dataset.
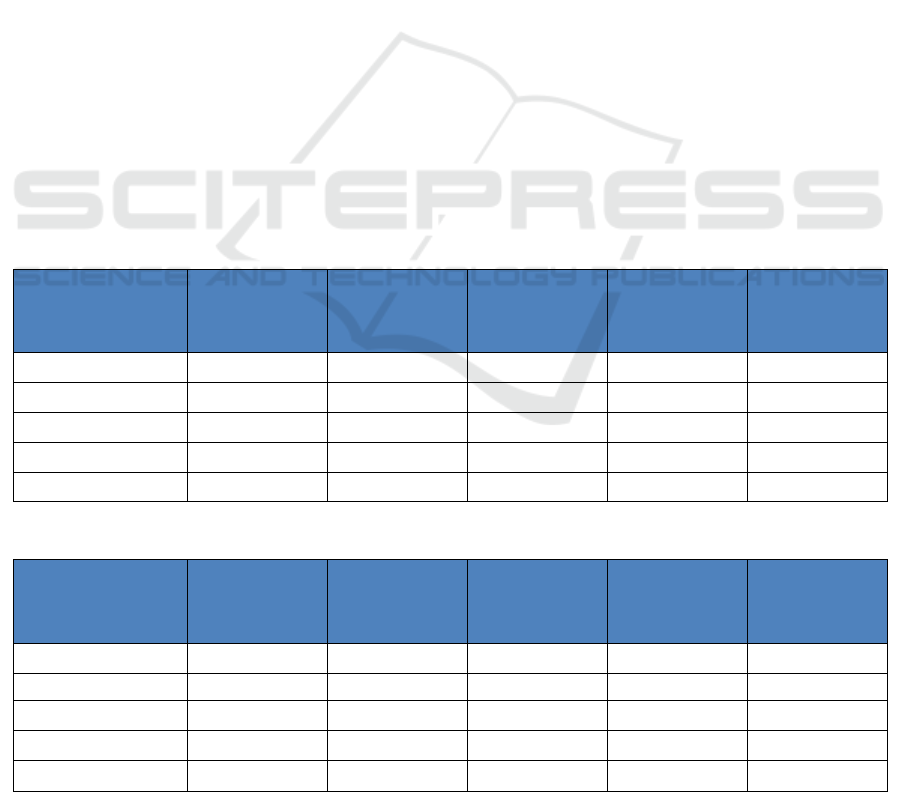
Interesting data were obtained by the analysis. It
was observed that 10 % of the clients make 43.33 %
of the purchases. There is a big amount of clients
(87%) that make only 35% of the total purchases.
Another interesting information that need to be
exploited is that quantities for 10% of the clients are
very similar to quantities for 87% of the clients
although total purchases are different.
5 CONCLUSIONS
The usage of Clustering in CRM systems is a very
interesting and effective technique for customer
grouping and can produce very interesting
information. It was shown that K-means is very
effective when customers need to be segmented based
on their purchase and quantity values. The algorithm
shows great performance when used for continuous
numerical values. Usage K-means combined elbow
method together can be very useful in this type of
applications.
6 FUTURE WORK
The study will be carried on in cases when the
analyses need to be done with multiple dimensions of
the data. Another interesting future work will be the
usage of data mining classification techniques in
CRM systems in order to be able not only to analyse
customer behaviour but also to predict it. The final
step would be to integrate Clustering and
Classification algorithms in BI systems in order to
make it simpler for marketing and sales team to use
them.
Table 2: Results from K-Medoids algorithm for 4 clusters.
Row Labels
Sum of
Purchases
Sum of
quantities
Purchase
Percentage on
Total
Number of
Clients
Number of
Clients
Percentage on
the Total
0 487373059 56301 30.93% 320 2%
1 386956118 54723 24.56% 3043 23%
2 517144745 63574 32.82% 1215 9%
3 184132724 41907 11.69% 8682 65%
Grand Total 1575606646 216505 13260
Table 3: Results from K-Means algorithm for 4 clusters.
Row Labels
Sum of
Purchases
Sum of
quantities
Purchase
Percentage on
Total
Number of
Clients
Number of
Clients
Percentage on
the Total
cluster0 552876375 72781 35.09% 1386 10%
cluster1 336678950 45240 21.37% 269 2%
cluster2 556281399 81934 35.31% 11561 87%
cluster3 129769922 16550 8.24% 44 0%
Grand Total 1575606646 216505 13260
ICEIS 2021 - 23rd International Conference on Enterprise Information Systems
808

REFERENCES
Mohammed, A. A., Rashid, B. B., Tahir, Sh. B. (2014).
Customer Relationship Management (CRM)
Technology and Organization Performance: Is
Marketing Capability a Missing Link? An Empirical
Study in the Malaysian Hotel Industry. Asian Social
Science; Vol. 10, No. 9.
Sarvari, P. A., Ustundag, A., Takci, H., (2016).
Performance evaluation of different customer
segmentation approaches based on RFM and
demographics analysis. Kybernetes, Vol. 45 Iss 7 pp.
1129 – 1157.
Palmer, A., Jiménez, R., Gervilla, E., (2011). Knowledge-
Oriented Applications in Data Mining. IN-TECH
(pp.373-396), Chapter: 23.
Coenen, F. (2004). Data Mining: Past, Present and Future,
The Knowledge Engineering Review. Cambridge
University Press.
Sondwale, P. P., (2015). Overview of Predictive and
Descriptive Data Mining Techniques, International
Journal of Advanced Research in Computer Science
and Software Engineering.
Ngai, E.W.T., Xiu, L., Chau, D.C.K. (2009). Application of
data mining techniques in customer relationship
management: A literature review and classification.
Expert Systems with Applications, Volume 36, Issue 2,
Part 2, Pages 2592-2602.
Madhulatha, T. S. (2012). An overview on clustering
methods. IOSR Journal of Engineering, Vol. 2(4) pp:
719-725
Shah, M., Nair, S. (2015). A Survey of Data Mining
Clustering Algorithms. International Journal of
Computer Applications (0975 – 8887) Volume 128 –
No.1.
Lico, L. (2017). Data Mining Techniques in Database
Systems. European Journal of Sustainable
Development Research, Volume 2, Issue 1, Pages 43–
50.
Kalra M., Lal, N., Qamar, S. (2018). K- Mean Clustering
Algorithm Approach for Data Mining of
Heterogeneous Data. Information and Communication
Technology for Sustainable Development (pp.61-70).
Han, J., Kamber, M., Pei, J. (2011). Data Mining Concepts
and Techniques. Morgan Kaufmann, Third Edition.
Tripathi, Sh., Bhardwaj, A., Eswaran, P. (2018).
Approaches to Clustering in Customer Segmentation.
International Journal of Engineering & Technology. 7.
Babič, F, Majnarić, T. L., Bekić, S., Holzinger, A. (2019).
Machine Learning for Family Doctors: A Case of
Cluster Analysis for Studying Aging Associated
Comorbidities and Frailty. International Cross-Domain
Conference for Machine Learning and Knowledge
Extraction.
Yan, M., Ye, K. (2007). Determining the Number of
Clusters Using the Weighted Gap Statistic. Biometrics,
vol. 63, no. 4, 2007, pp. 1031–1037. JSTOR,
www.jstor.org/stable/4541456.
Nanjundan, S., Sankaran, S., Arjun, C.R., Anand, G. P.
(2021). Identifying the number of clusters for K-
Means: A hypersphere density based approach. https://
arxiv.org/ftp/arxiv/papers/1912/1912.00643.pdf,
accessed on February 7, 2021. https://www.data
novia.com/en/lessons/agglomerative-hierarchical-
clustering/, accessed on February 7, 2021.
Han, J., Pei, J., Kamber, M. (2011). Data Mining: Concepts
and Techniques. Elsevier, ISBN 9780123814807.
Analysing Clustering Algorithms Performance in CRM Systems
809
