
Evaluating a Convolutional Neural Network and a Mosaic Image
Database for Land Use Segmentation in the Brazilian Amazon Region
Joel Parente de Oliveira
1a
, Marly Guimarães Fernandes Costa
2b
and Cícero Ferreira Fernandes Costa Filho
2c
1
Operations and Management Center of the Amazon Protection System (CENSIPAM), Manaus, Brazil
2
Department of Electrical and Computer Engineering, Federal University of Amazonas, Manaus, Brazil
Keywords: Remote Sensing, Image Segmentation, Land Use, Image Database.
Abstract: This study presents an image database and a convolutional neural network for the segmentation of land use
in agriculture, forest and pasture classes. LANDSAT-8/OLI images from an area of the Brazilian Amazon
region were used. The reference data were extracted from the results of the TerraClass project in 2014. The
image database was generated in two versions: the first with six bands and the second with three bands. Each
version of the data set has 4,000 images and size 400x400 pixels. Each image was generated using the mosaic
technique. Each mosaic image is created from small agricultural, forest and grassland patches that are
extracted from satellite images. The mosaic image is created with almost the same amount of agriculture,
forest and pasture patches. The convolutional neural network architecture was evaluated together with three
optimization methods: SGDM, ADAM and RMSProp and the dropout and L2 regularization for
generalization improvement. The best model, CNN + optimization method + technique for generalization
improvement, evaluated on the validation set, was used to segment some regions of the Amazon. The best
results were obtained using the ADAM optimization method and L
2
regularization. The accuracy values
obtained for the evaluated images were above 94%.
1 INTRODUCTION
Remote sensing is the use of various technologies
with the aim of studying the phenomena that occur on
the Earth's surface. These technologies include
sensors, equipment installed on board aircraft,
spacecraft and other platforms. The data generated
from remote sensing systems are of great use for
various applications, for example: urban planning,
agricultural, geological, deforestation monitoring
(Novo, 2008).
The National Institute of Space Research (INPE)
is a world reference with respect to the monitoring of
the Brazilian Legal Amazon. Among the various
projects developed by INPE for this monitoring, the
Monitoring Program of Deforestation in the Legal
Amazon (PRODES) and TerraClass stand out.
PRODES provides data through annual maps of
deforestation in the Amazon region through the
a
https://orcid.org/0000-0002-7691-9457
b
https://orcid.org/0000-0002-6839-1402
c
https://orcid.org/0000-0003-3325-5715
analysis of remote sensing images. The TerraClass
project uses the data generated by PRODES to
perform a land use and land cover classification in the
following classes: forest, pasture, agriculture, urban
areas, mining and others. This type of information can
help agencies to develop public prevention policies to
contain the advance of deforestation (Noma, 2013).
The data generated by the PRODES and
TerraClass projects are very reliable, however they
still depend on a significant portion of the work
carried out by human intervention. In order to make
the process of remote sensing image analysis more
efficient, several studies have been made using
machine learning tools (Adarme et al., 2020; Bem et
al., 2020; Maretto et al., 2020).
Adarme et al. (2020), Bem et al. (2020), and
Maretto et al. (2020), used deep learning techniques
to detect deforested areas in regions of the Brazilian
Amazon. Adarme et al., (2020) evaluated a region of
Parente de Oliveira, J., Costa, M. and Filho, C.
Evaluating a Convolutional Neural Network and a Mosaic Image Database for Land Use Segmentation in the Brazilian Amazon Region.
DOI: 10.5220/0010509701650172
In Proceedings of the 7th International Conference on Geographical Information Systems Theory, Applications and Management (GISTAM 2021), pages 165-172
ISBN: 978-989-758-503-6
Copyright
c
2021 by SCITEPRESS – Science and Technology Publications, Lda. All rights reserved
165

the Amazon biome, located in the state of Pará,
Brazil. This area has been facing a continuous
degradation process, as indicated by PRODES
reports. The authors obtained an accuracy of 95%
and of 63% in terms of F1-Score using Convolutional
Neural Network (CNN).
Bem et al., (2020) mapped deforestation between
images approximately one year apart, specifically
between 2017 and 2018 and between 2018 and 2019,
using CNN. In the experiments performed,
LANDSAT-8/OLI images from three regions of the
Brazilian Amazon were used. According to the
authors, these regions encompass the main centers of
deforestation that have developed along the
Transamazon (BR-230) and "Cuiabá - Santarém"
highways. The best results were obtained with the
ResUnet model, in which case the accuracy and F1-
Score were 99.93% and 94.65%, respectively.
Maretto et al., (2020) used CNN to perform
classification of deforested areas in a region of
southern Pará state. The authors used Landsat-8/OLI
images and PRODES data as a gold standard. The
training dataset is composed of images from five
years, from 2013 to 2017. The test dataset was
composed of images from 2018. The classifier used
by the authors was CNN U-NET. The accuracy
obtained was approximately 95%.
Adarme et al., (2020), Bem et al., (2020) and
Maretto et al., (2020) used deep learning techniques
to classify deforestation regions in the Amazon. The
results achieved were quite satisfactory. However,
unlike the proposal of this paper, the works found in
the literature do not present a deep learning model for
land use classification for the Brazilian Amazon
region, and the authors did not make their data
available for benchmarking.
In this study, we present a database of images for
the segmentation of land use for the Brazilian
Amazon region in the classes of agriculture, forest
and pasture. In remote sensing images of the Amazon
region, these classes are unbalanced. In other words,
in a region captured by a satellite image, most
correspond to forest and few areas correspond to
other types of soil, such as pasture and agriculture, so
that the forest region is predominant. Figure 1
illustrates two LANDSAT-8/OLI images of the
Amazon region with their respective gold standards.
Images 1 correspond to regions of scene 001/66,
while image 2, to an area of scene 228/68. In this
image we can observe the predominance of forest
areas in relation to pasture and agriculture regions.
This problem can lead, in training a a CNN, to the
optimization method having better performance in the
most present land use class (forest).
This paper has two objectives. First, to solve the
problem mentioned in the previous paragraph,
regarding the unequal distribution of land use in
remote sensing images. The proposed image database
was built using the mosaic image technique. In this
technique, small patches of agriculture, forest and
pasture are extracted from satellite images. With the
aim of obtaining a balanced image, with equal
portions of soil cover from these patches, a larger
image is created with almost the same amount of
agriculture, forest and pasture patches. Second, to
propose a CNN architecture for the segmentation of
remote sensing images into land uses. We emphasize
that previous works published in the literature were
concerned only with classifying deforested areas
(Adarme et al., 2020; Bem et al., 2020; Maretto et al.,
2020).
2 METHODS
2.1 Mosaic Image Database
The database was created using LANDSAT-8/OLI
(Operational Land Imager) images of the areas of the
Brazilian Legal Amazon region. These images are
available for free at (Usgs, 2019a). The study region
is known as the "arc of deforestation". This region has
the highest rates of deforestation in the Brazilian
Legal Amazon and a large agricultural expansion.
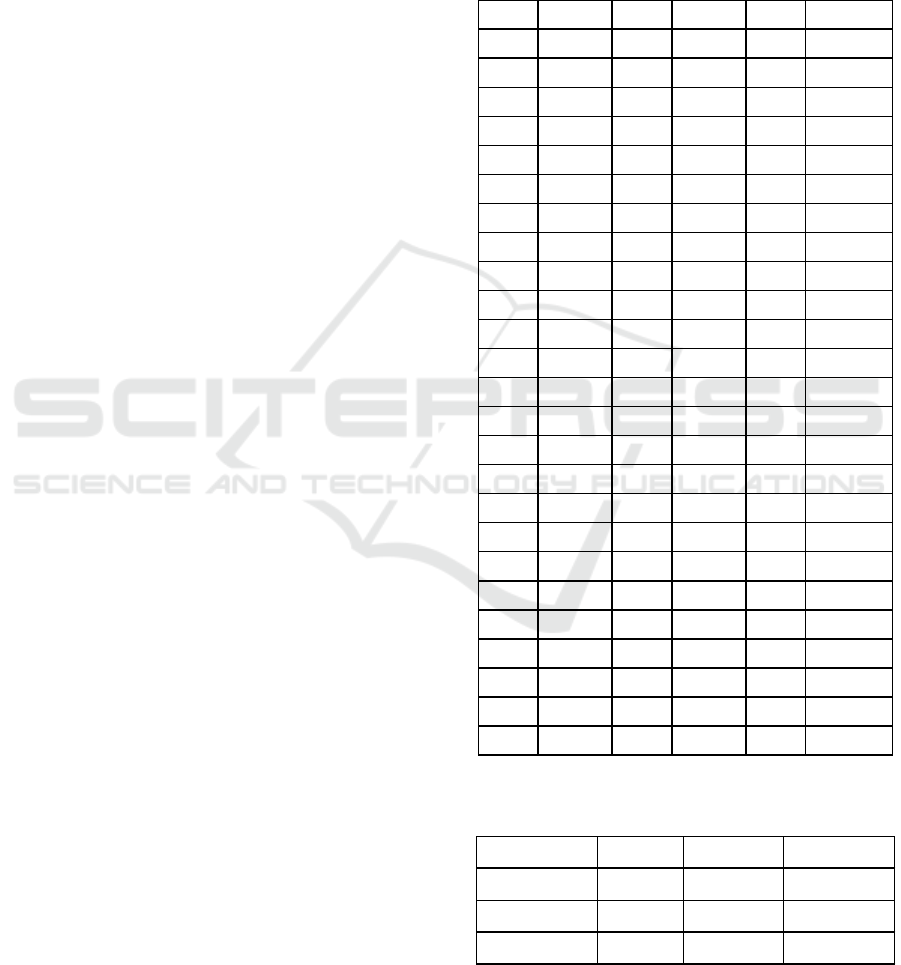
(Oviedo et al., 2019). The images cover the states of
Amazonas, Mato Grosso, Pará and Rondônia, as
shown in Table 1. Images corresponding to the dry
season were used, due to the lower incidence of cloud
coverage. Figure 2 shows a map with the LANDSAT-
8/OLI scenes used to create the database. According
to (Usgs, 2019b) the Blue (B2), Green (B3), Red
(B4), Near Infrared (B5), Shortwave Infrared 1 (B6)
and Shortwave Infrared 2 (B7) bands are best suited
for vegetation analysis. Also, according to (Yu et. al,
2019), B4, B5 and B6 is the best combination of three
bands for remote sensing applications in applications
whose objective is to perform soil classification.
Thus, two versions of the image database were
assembled, the first one with the six bands (B2, B3,
B4, B5, B6 and B7), and the second one with three
bands (B4, B5, B6). For the generation of the gold
standard, data from the TerraClass project were used,
available for free at (Inpe, 2019). The data generated
in the TerraClass project delimit the regions of the
Brazilian Amazon in the following classes: forest,
agriculture, pasture, unobserved area, urban area,
mining, others, non-forest and hydrography.
GISTAM 2021 - 7th International Conference on Geographical Information Systems Theory, Applications and Management
166
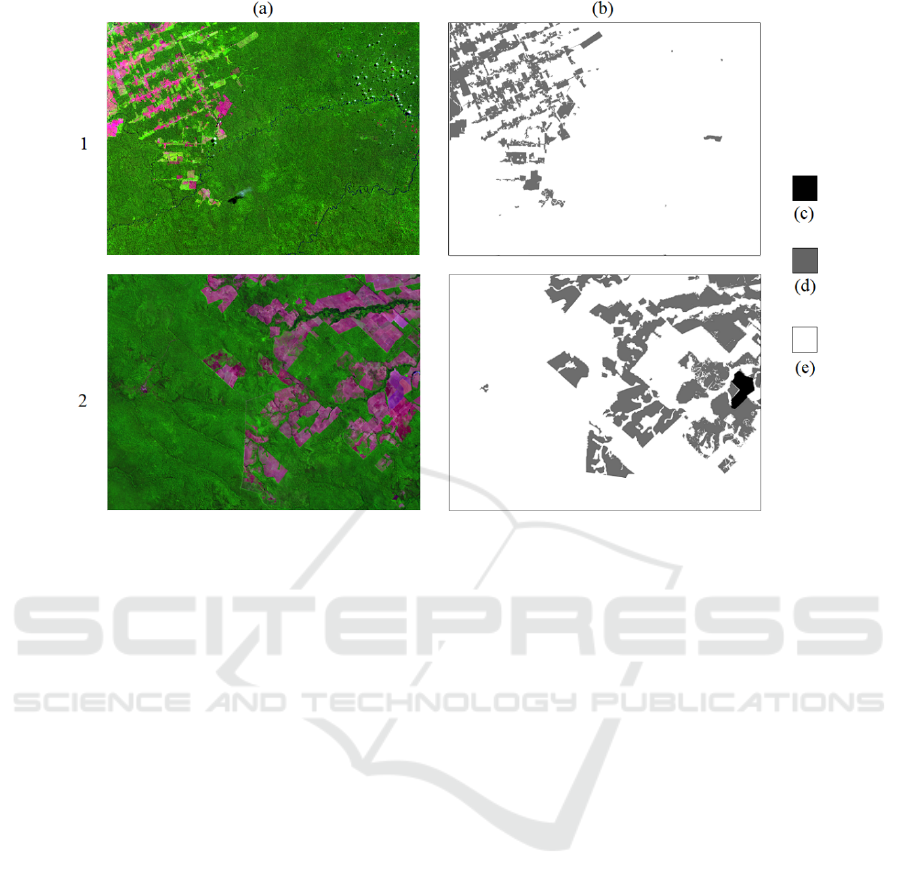
Figure 1: LANDSAT-8 images of Amazon regions. In column (a) we have the original images. In (b) we have the gold
standard, and (c), (d) and (e) corresponds to gold standard for each image patch, corresponding to agriculture, pasture and
forest area, respectively.
For creating this database, information on forest,
pasture and agriculture areas were used. The classes
unobserved area, urban area, mining and others were
not considered, because they represent a very small
area, and it would not be possible to extract a
significant number of samples to be used in training
and evaluation of a pattern recognition tool.
Additionally, CNN networks need more information
for their training. The non-forest and hydrography
areas were not used because they are areas that are
part of an INPE exclusion mask. Thus, these regions
are not considered in the systematic mapping.
Figure 3 presents a flowchart of the methodology
used to create the image database. Initially the
LANDSAT-8/OLI images are downloaded, as
presented in Block 1.
For each image shown in Table 1, the steps shown
in Block 2 of Figure 3 were applied. The
methodology shown in this flowchart was used for
generating agriculture, forest and pasture image
patches. Initially an image is created resulting from
the composition of the bands B2, B3, B4, B5, B6 and
B7 (Block 2.1). Then, using the Terraclass Project
data as reference, as shown in Block 2.2, three images
are generated, with only the agriculture, forest and
pasture areas. The steps presented in Blocks 2.1 and
2.2 were performed using ENVI 5.5 software. Finally,
in Block 2.3, using the MATLAB software, 40x40
size patches are extracted from each image generated
in Block 2.2. 4,000 agricultural patches, 225,000
forest patches and 6,000 pasture patches were
generated. For assembling the database, as shown in
Table 2, the image patches were divided into three
parts, corresponding to training, validation and
testing. Of the 4,000 agricultural patches, 2,000 were
separated for training, 1,000 for validation and 1,000
for testing. Regarding the 6,000 pasture patches,
3,000 were destined for training, 1,500 for validation
and 1,500 for testing. Finally, the 225,000 forest
patches were randomly divided into 75,000 for
training, 75,000 for validation and 75,000 for testing.
In Block 3 of Figure 3, using the training,
validation and test image patches described above,
images defined as mosaic images were generated.
Each mosaic image has a dimension of 400x400
pixels and is generated by randomly selecting patches
of agriculture, forest or pasture. For each mosaic
image generated, a mosaic image corresponding to
her gold standard is also generated. For building the
gold standard image, the pixels corresponding to the
forest region were marked with the grey-level value
255, the pixels corresponding to the pasture region
were marked with the grey-level value 100 and the
pixels corresponding to the agriculture region were
marked with the grey-level value 1. Figure 4 shows
an example of a mosaic image and the corresponding
Evaluating a Convolutional Neural Network and a Mosaic Image Database for Land Use Segmentation in the Brazilian Amazon Region
167
gold standard. It can be observed that 34 of the 100
patches are from agriculture, 35 from forest and 31
from pasture.
Two sets of image data were generated with a total
of 4,000 mosaic images each (6-band images and 3-
band images). For each version, 70% of the images
(2800) are destined for the training dataset, 15% (600)
for the validation dataset and 15% (600) for the test
dataset. The first dataset consists of images with 6
bands: B2, B3, B4, B5, B6 and B7. The second
dataset is composed of images with three bands: B4,
B5 and B6. Table 3 presents the quantitative of
images from these two sets of image data, showing
the distribution in the training, validation and testing
datasets.
2.2 CNN Architecture and Training
Parameters
In this work, a CNN architecture, three optimization
methods, and three methods for generalization
improvement were evaluated. The optimization
methods evaluated were Stochastic Gradient Descent
with Momentum (SGDM), Root Mean Square
Propagation (RMSProp), and Adaptive Moment
Estimation (ADAM). For each of these methods the
following techniques for generalization improvement
were employed: no technique, dropout layer, L
2
regularization (L
2
), and dropout layer with L
2
regularization. The mosaic images were used as input
data set. 12 simulations were performed (1
architecture x 3 optimization x 4 methods). After the
simulations, the model with the best performance on
the validation set was selected to classify some
Amazon images.
The CNN architecture used in this work was based
on the architectures proposed in the work of
(Miyagawa et al., 2018). In this work, the authors
aimed to perform lumen segmentation in
intravascular optical coherence tomography (IVOCT)
images. The authors analyzed three CNNs
architectures. The best results for accuracy, Dice
value and Jaccard's value were above 99%, 98% and
97%, respectively, and were obtained with images of
size 192x192 pixels represented by the polar
coordinate system. In this study, the CNN
architecture shown in Figure 5 was used. CNN2 has
two subsampling steps (max-pooling) and two
oversampling steps. Before each sub-sampling, there
are three sequences of 3 × 3 convolutive layers, a
batch normalization layer, and ReLU. A workstation
running Windows 10, MATLAB 2019a and with
NVIDIA Quadro GV100 32GB and 5120 CUDA
cores was used in the experiments. Regarding the
parameters for training the CNN, we used an initial
learning rate initial = 0.001, learning rate drop factor
= 0.5, number of epochs = 200, batch size = 2, dropout
layer parameter = 0.3, regularization factor L
2
=
0.001.
Table 1: List of images used in this study.
O/P* Date O/P* Date O/P* Date
229/65 08/09/14 227/70 08/11/14 224/62 08/22/14
229/66 08/09/14 228/70 08/18/14 228/65 08/02/14
230/64 08/16/14 224/69 08/06/14 228/66 08/18/14
230/65 08/16/14 226/69 08/04/14 227/66 07/26/14
230/66 07/15/14 227/69 08/11/14 226/66 08/04/14
231/64 09/08/14 228/69 07/01/14 225/66 08/13/14
231/65 08/23/14 225/71 08/13/14 223/63 06/12/14
231/66 08/23/14 226/71 08/20/14 225/65 07/28/14
232/64 08/30/14 227/71 08/11/14 224/64 07/05/14
232/65 08/30/14 224/68 07/21/14 224/65 08/22/14
001/65 08/12/14 226/68 08/04/14 224/66 08/06/14
001/66 08/12/14 227/68 08/11/14 223/67 08/15/14
001/67 08/12/14 228/68 08/18/14 226/62 08/20/14
002/65 08/03/14 224/67 08/06/14 225/62 07/28/14
233/65 08/21/14 225/67 08/13/14 223/66 07/30/14
233/66 08/21/14 226/67 08/04/14 227/65 08/11/14
233/67 08/21/14 227/67 07/26/14 222/62 10/27/14
002/66 08/19/14 228/67 08/18/14 223/62 09/16/14
224/70 08/22/14 225/69 08/13/14 224/63 07/05/14
225/70 08/29/14 229/68 08/09/14 232/66 08/14/14
226/70 08/04/14 229/70 08/09/14 232/67 08/14/14
229/71 08/09/14 229/67 08/09/14 231/67 08/23/14
228/71 08/18/14 229/69 08/09/14 231/68 08/23/14
223/68 08/15/14 225/68 08/13/14 230/69 07/31/14
230/67 08/16/14 226/65 08/04/14 230/68 08/16/14
*Orbit/Point
Table 2: Splitting image patches.
Class Training Validation Te st
Agriculture 2,000 1,000 1,000
Forest 75,000 75,000 75,000
Pasture 3,000 1,500 1,500
GISTAM 2021 - 7th International Conference on Geographical Information Systems Theory, Applications and Management
168
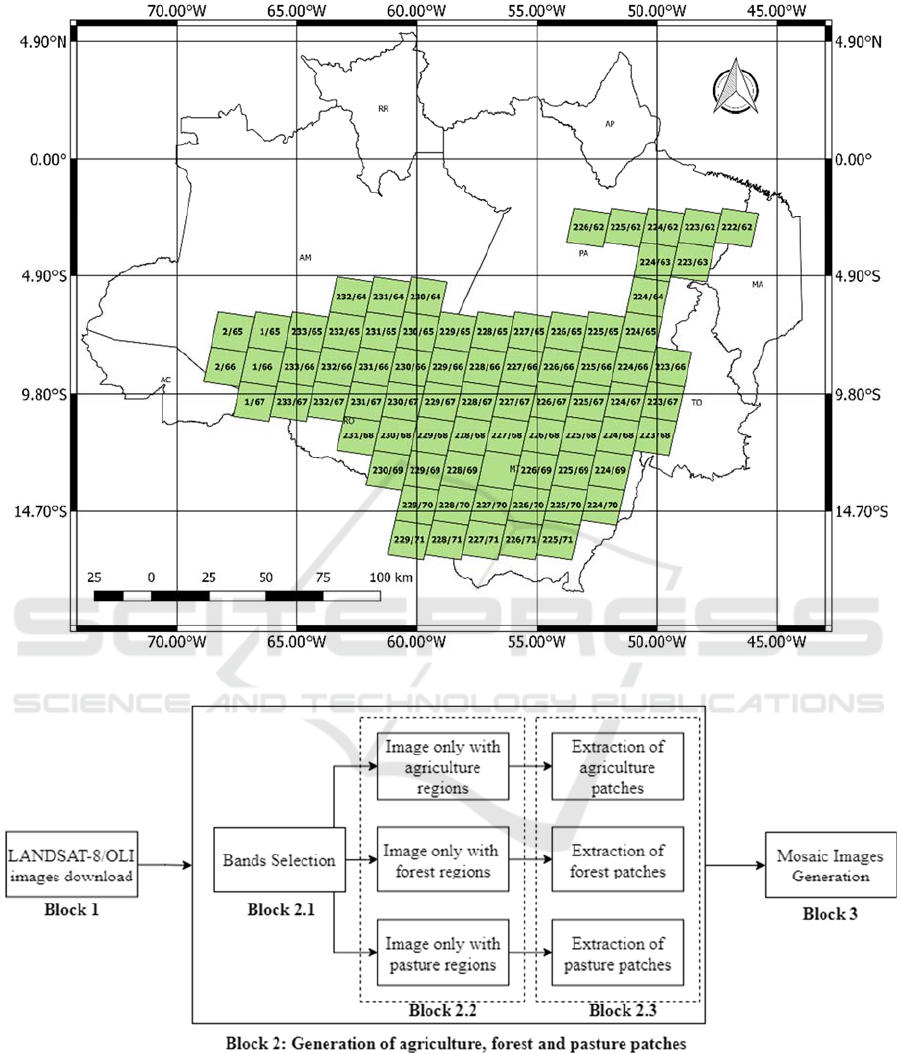
Figure 2: Legal Amazon with the LANDSAT-8/OLI scenes used in this work.
Figure 3: Flowchart of methodology used for obtaining the Mosaic Images.
Evaluating a Convolutional Neural Network and a Mosaic Image Database for Land Use Segmentation in the Brazilian Amazon Region
169
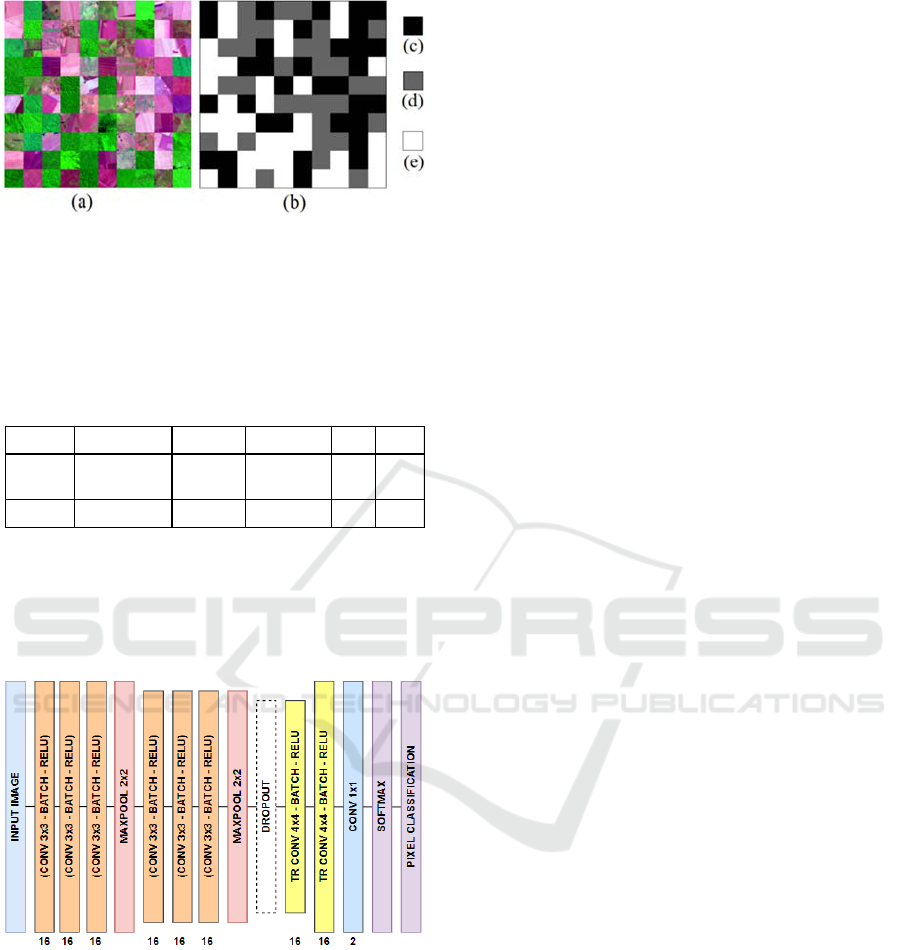
Figure 4: Example of mosaic image. (a) mosaic image in
color composition of bands B6-B5-B4, composed of
agricultural, forest and pasture patches, (b) gold standard
image, and (c), (d) and (e) corresponds to gold standard for
each image patch, corresponding to agriculture, pasture and
forest area, respectively.
Table 3: Mosaic image dataset generated for training,
validation, and testing datasets.
Ve rsion Bands Training Validation Test Total
1
B2, B3, B4,
B5, B6, B7
2,800 600 600 4,000
2 B4, B5, B6 2,800 600 600 4,000
To evaluate the results, the Global Accuracy
(GA), Average Accuracy (AA), Jaccard Similarity
Coefficient (J), Weighted Jaccard Similarity
Coefficient (WJ) and F1 Score (F1) were calculated
(MathWorks, 2017).
Figure 5: CNN architecture used in this work.
3 RESULTS
3.1 CNN Architecture Simulation
Results
Table 4 presents the performance obtained for CNN
when combined with the optimization methods and
with the methods for generalization improvement.
Table 5 presents the confusion matrix for the best
performing model on the validation set, which in this
case was the one in which ADAM was employed as
the optimization method and L
2
regularization as the
technique for generalization improvement.
3.2 Image Classification using the
CNN/RMSProp Model
The best performing model in the validation set was
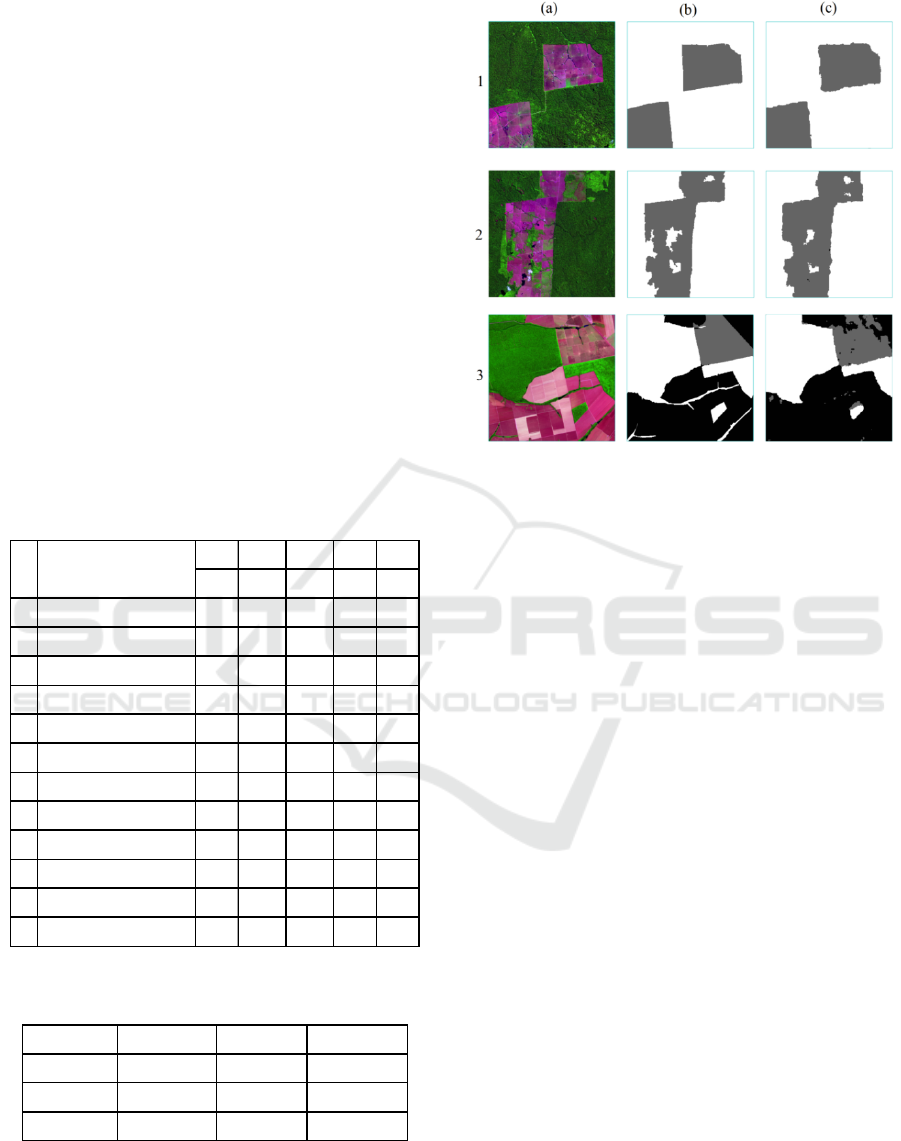
used to segment some images of the Amazon region.
In Figure 6 we show three LANDSAT-8/OLI
images of Amazon regions with their respective gold
standard, and the image classified by the CNN model.
Images 1 and 2 correspond to regions of scene
001/66, while image 3, to an area of scene 224/68.
The accuracy values obtained for images 1, 2 and 3
were 99.20%, 96.84% and 94.98% respectively.
3.3 Access to the Mosaic Image
Database
To receive a copy of the image database, the
researcher is first asked to contact
joelparente@gmail.com. The researcher will receive
a form and must send it filled and signed. Finally, the
access to the image database will be allowed.
4 DISCUSSION
From Table 4, with respect to the optimization
methods, it can be concluded that the accuracy results
obtained using the ADAM and RMSProp methods
were very close, 99.04% and 98.97%, respectively.
On the other hand, the results obtained using the
SGDM method were much lower, averaging 97.89%.
From the confusion table, we verified a greater
error in regions where the gold standard pointed to
areas as being pasture land but that were classified as
agriculture and vice versa. The best performing
model was the CNN model with the ADAM
optimization method and with the L
2
regularization.
This model was used to evaluate the classification of
some regions in the Amazon shown in Figure 6. The
accuracy obtained for these three regions varied
significantly, between 99.20% and 94.98%.
5 CONCLUSIONS
In this work, a database with remote sensing images
of the Amazon region was presented. The database
was created using the concept of mosaic images. We
GISTAM 2021 - 7th International Conference on Geographical Information Systems Theory, Applications and Management
170
hope in the future to create an image database using
other remote sensing image sources, for example
synthetic aperture radar (SAR). This will make it
possible, for example, to perform image analysis of
the Amazon region generated during the period
known as the rainy season, a period in which there is
a large number of clouds in the region, because the
type of sensor used to generate SAR images is
independent of the weather conditions in the region
under analysis.
This work also aimed to propose a methodology
to segmentation land use for the Amazon region for
pasture, agriculture and forest classes. The proposed
methodology consisted of evaluating a CNN
architecture and training it using the proposed mosaic
image database. LANDSAT-8 optical images of the
Amazon region were used.
In view of the results presented, it can be
concluded that the methodology proposed in this
work was promising to perform the task of image
segmentation sensing images for Amazon regions.
Table 4: Performance of CNN.
GA AA J WJ F1
(% ) (% ) (% ) (% ) (% )
1
SGDM 97.52 97.53 95.21 95.20 91.30
2
SGDM/Dropout 97.48 97.49 95.13 95.12 92.08
3
SGDM/L2 98.33 98.33 96.73 96.72 93.29
4
SGDM/Dropout/L2 98.20 98.20 96.49 96.48 93.60
5
ADAM 98.92 98.92 97.86 97.86 94.64
6
ADAM/Dropout 98.79 98.80 97.63 97.62 94.63
7
ADAM/L2 99.36 99.36 98.73 98.72 96.47
8
ADAM/Dropout/L2 99.11 99.11 98.24 98.24 95.76
9
RMSProp 98.90 98.90 97.83 97.83 94.50
10
RMSProp/Dropout 98.75 98.75 97.54 97.54 94.50
11
RMSProp/L2 99.23 99.23 98.47 98.47 95.92
12
RSMProp/Dropout/L2 99.02 99.02 98.06 98.06 95.39
Experiment
Table 5: Confusion Matrix for the best CNN model
(CNN/ADAM/L
2
).
Agriculture Pasture Forest
Agriculture
0.99 5.92E-03 5.98E-09
Pasture
9.53E-03 0.99 2.11E-03
Forest
1.34E-04 1.15E-03 0.99
Figure 6: LANDSAT-8 images of Amazon regions. In
column (a) original images. In (b) gold standard images. In
(c) images classified by the CNN/ADAM/L
2
model. The
accuracy obtained for images 1, 2 and 3 was 99.20%,
96.84% and 94.98% respectively.
ACKNOWLEDGEMENTS
This work was supported in part by the Samsung
Electronics of Amazonia Ltd., through the terms of
Federal Law no. 8.387/1991, by the agreement no.
004, assigned by the Center for Research and
Development in Electronics and Information from the
Federal University of Amazonas—CETELI/UFAM,
in part by the Coordenação de Aperfeiçoamento de
Pessoal de Nível Superior—Brasil (CAPES) —
Funding Code 001.
REFERENCES
Adarme, M. O. et al. Evaluation of deep learning techniques
for deforestation detection in the brazilian amazon and
cerrado biomes from remote sensing imagery. 2020.
Remote Sensing, v. 12, n. 6.
Bem, P. P. et al., 2020. Change detection of deforestation
in the brazilian amazon using landsat data and
convolutional neural networks. Remote Sensing, v. 12,
n. 6.
Inpe., 2019. National Institute of Space Research - projects
and research - terraclass. Available at:
<http://www.inpe.br/cra/projetos%5C_pesquisas/dado
s%5C_terraclass.php>. Access on: 17 Aug 2019.
Evaluating a Convolutional Neural Network and a Mosaic Image Database for Land Use Segmentation in the Brazilian Amazon Region
171

Maretto, R. V. et al. Spatio-Temporal Deep Learning
Approach to Map Deforestation in Amazon Rainforest.,
2020. IEEE Geoscience and Remote Sensing Letters, p.
1–5.
MathWorks, 2017. Evaluate Semantic Segmentation Data
Set Against Ground Truth. Accessed: Feb. 10, 2021.
[Online]. Available: https://in.mathworks.com/help/
vision/ref/evaluatesemanticsegmentation.html
Miyagawa, M., Costa M. G. F., Gutierrez M. A., Costa J. P.
G. F., Costa Filho, C. F. Lumen segmentation in optical
coherence tomography images using convolutional
neural network. 40th Annual International Conference
of the IEEE Engineering in Medicine and Biology
Society, 1:1–4, 2018
Noma, A., Körting, T. S., and Fonseca, L. M. G., 2013.
Uma comparação entre classificadores usando regiões
e perfis evi para agricultura. Anais XVI Simpósio
Brasileiro de Sensoriamento Remoto, 1:2250–2257.
Novo, E. M. L. M., 2008. Sensoriamento Remoto:
Princípios e Aplicações. Edgard Blücher Ltda, São
Paulo.
Oviedo, A., Lima, W. P., Augusto, C. O arco do
desmatamento e suas flechas. Available at:
<https://www.socioambiental.org/sites/blog.socioambi
ental.org/files/nsa/arquivos/nova_geografia_do_arco_
do_desmatamento_isa.pdf>. Access on: 10 Out 2020.
Usgs., 2019. Earth Explorer. Available at:
<http://earthexplorer.usgs.gov/>. Access on: 19 May
2019.
Usgs., 2019. What are the best spectral bands to use for my
study? Available at: <https://landsat.usgs.gov/what-
are-best-spectral-bands-use-my-study>. Access on: 19
May 2019.
Yu, Z. et al., 2019. Selection of landsat 8 OLI band
combinations for land use and land cover classification.
2019 8th International Conference on Agro-
Geoinformatics, Agro-Geoinformatics 2019, n. July, p.
1–5.
GISTAM 2021 - 7th International Conference on Geographical Information Systems Theory, Applications and Management
172
