
Continuous Data Quality Management for Machine Learning based
Data-as-a-Service Architectures
Shelernaz Azimi and Claus Pahl
Free University of Bozen-Bolzano, Bolzano, Italy
Keywords:
Data-as-a-Service, DaaS, Machine Learning, Data Quality, Edge Cloud, Internet-of-Things, Traffic
Management, Case Study.
Abstract:
Data-as-a-Service (DaaS) solutions make raw source data accessible in the form of processable information.
Machine learning (ML) allows to produce meaningful information and knowledge based on raw data. Thus,
quality is a major concern that applies to raw data as well as to information provided by ML-generated models.
At the core of the solution is a conceptual framework that links input data quality and the machine learned data
service quality, specifically inferring raw data problems as root causes from observed data service deficiency
symptoms. This allows to deduce the hidden origins of quality problems observable by users of DaaS offerings.
We analyse the quality framework through an extensive case study from an edge cloud and Internet-of-Things-
based traffic application. We determine quality assessment mechanisms for symptom and cause analysis in
different quality dimensions.
1 INTRODUCTION
Data-as-a-Service (DaaS) solutions make raw source
data accessible in the form of information processable
by the consumer of the service. A problem here is
that quality concerns observed by the consumer of the
service are caused by quality problems related to the
raw source data or its processing, which are hidden
from the consumer.
Continuous Data Quality Management (CDQM)
is concerned with an ongoing process of continuously
monitoring and improving the quality of data and de-
rived information. In particular, in contexts domi-
nated by high volume, velocity and veracity of data
(generally referred to as big data), like the Data-as-a-
Service (DaaS) context here, such a continuous qual-
ity management process is essential. Data processing
through machine learning (ML) techniques is here an
integral part of obtaining value out of the raw data,
but require a dedicated CDQM solution for DaaS ar-
chitectures.
While data quality models exist, there is a need to
extend data quality to the ML model level. Further-
more, we need to close the loop by mapping quality
problems (the symptoms) at ML level back to their
origins (or root causes).
Our contribution is, firstly, a layered data architec-
ture for data and ML function layers and, secondly, a
root cause analysis based on a closed loop between
data and ML layers. We determine quality assess-
ment mechanisms for symptom and cause analysis
in different dimensions, including situational analysis
and timeseries, determination outcome, object, type
and techniques. Our approach is suited to situations
where raw data quality might not be directly observ-
able or assessable, thus a new way of inferring quality
is needed.
A case study is the mechanism through which
we validate the quality framework. The context is
set in public data services (DaaS), here at a regional
level (more specifically, a regional IT and Data ser-
vice provider). The application is traffic management,
which is based on traffic and weather data collected
locally in an edge cloud and IoT setting.
2 CONTINUOUS DATA QUALITY
MANAGEMENT
Continuous Data Quality Management (CDQM) for
data services is a continuous process of data qual-
ity (DQ) actions: prevention, detection and correc-
tion. The prevention of problems is, however, not
always achievable. Thus, we focus here on the de-
tection and correction of quality problems. We tar-
get specifically the quality of information models that
are created from data using machine learning tech-
328
Azimi, S. and Pahl, C.
Continuous Data Quality Management for Machine Learning based Data-as-a-Service Architectures.
DOI: 10.5220/0010509503280335
In Proceedings of the 11th International Conference on Cloud Computing and Services Science (CLOSER 2021), pages 328-335
ISBN: 978-989-758-510-4
Copyright
c
2021 by SCITEPRESS – Science and Technology Publications, Lda. All rights reserved

niques. Data quality refers to how well data meets the
requirements of its users. This includes for example
accuracy, timeliness or completeness (Thatipamula,
2013). Quality frameworks for data and information
have been investigated (O’Brien et al., 2013; Azimi
and Pahl, 2020b; Azimi and Pahl, 2020a). There is
also a commonly accepted classification of (big) data
aspects that can help in organising and managing the
quality concerns (Saha and Srivastava, 2014; Nguyen,
2018), often called the 4V model: volume (scale,
size), velocity (change rate/streaming/real-time), va-
riety (form/format) and veracity (uncertainty, accu-
racy, applicability). Our chosen IoT application do-
main exhibits all of those characteristics. Note, that
sometimes value is added as a fifth concern, but we
focus on the technical aspects here.
In the Edge Cloud and Internet-of-Things (IoT),
so-called things (such as sensors and actuators) pro-
duce and consume data, processed in a edge cloud, in
order to provide data services (Pahl et al., 2019).
Here data quality concerns arise. In case the un-
derlying data is inaccurate, any extracted information
and also derived actions based on it are likely to be
unreliable (Mahdavinejad et al., 2018). Furthermore,
the edge cloud environment in which the data collec-
tion occurs is often rapidly changing in terms of archi-
tecture and data characteristics. In order to focus our
investigation, we make the following assumptions: (i)
all data is numerical (i.e., text or multimedia data and
corresponding quality concerns regarding formatting
and syntax are not considered) and (ii) data can be
stateful or stateless. Thus, IoT is a 4V big data con-
text with specific data types.
Two central questions and analysis steps shall be
applied in our use case setting: (1) Quality Value
Analysis: is based on quality goals and thresholds.
Goals are defined in terms of quality dimensions such
as accuracy or completeness. The reaching of goals
is determined using predefined thresholds. (2) Prob-
lem Cause Analysis and Prediction: rely on pattern
and anomaly detection to identify DaaS information
model quality problems and map them the data layer,
possibly including time series such as quality graphs
over time (at DaaS and source data level). The ques-
tions is whether a problem source (at data layer) can
be identified or predicted based on an analysis of the
DaaS layer.
3 DaaS QUALITY ASSESSMENT
& PROBLEM CAUSE ANALYSIS
An empirical study (Ehrlinger et al., 2019) identified
different quality deficiencies such as accuracy or com-
Figure 1: Layered DaaS Quality Management Architecture.
pleteness in ML data models. Our aim is to attribute
these types of problems more systematically to differ-
ent root causes for our use case. The differentiation
can help to better identify IoT-level root causes for
observed problems: (1) Problems with IoT input data.
Assume a data table ’TrafficCount(Location,
Date/Hour, Direction1, Direction2)’. Two
types of data quality problems are: (i) missing val-
ues (e.g., for one direction), which could result from
a single sensor failure, and (ii) missing record (e.g.,
all data for a whole hour or from one location), which
could result from communication failure. (2) Prob-
lems with ML data model training. Here unsuitable
training sets (e.g., incomplete) could have been used.
3.1 Data and Service Quality Layers
The basis of the data quality framework is the
raw data layer, see Fig. 1. We distinguish
context-independent data qualities (complete, miss-
ing, duplicate, correct/accurate value, correct format,
timely/outdated, inconsistent/violation of generic
constraint) and context-dependent data quality (vio-
lation of domain constraints). Raw (or source) data
is consumed to produce machine learning models. In
order to better understand the processing purpose, we
categorise these into DaaS function types: predictor,
estimator (or calculator) and adaptor. For these func-
tions, we define an information quality model. Input
for function quality includes (i) structural model qual-
ity: accuracy, correctness, completeness, effectivess,
optimality and (ii) function-specific quality: accu-
racy/correctness [predictor], complete/effective [esti-
mator], effectiveness/optimality [adaptor].
The evaluation of our use case will shows that
we can relate DaaS function quality to DaaS func-
tion types and techniques, see Fig. 1: Predictors are
concerned with accuracy (regression) and correctness
(classification). Estimator are concerned with effec-
tiveness (clustering) and completeness (clustering).
Adaptors are concerned with effectiveness (classifi-
cation) and optimality (regression).
Continuous Data Quality Management for Machine Learning based Data-as-a-Service Architectures
329
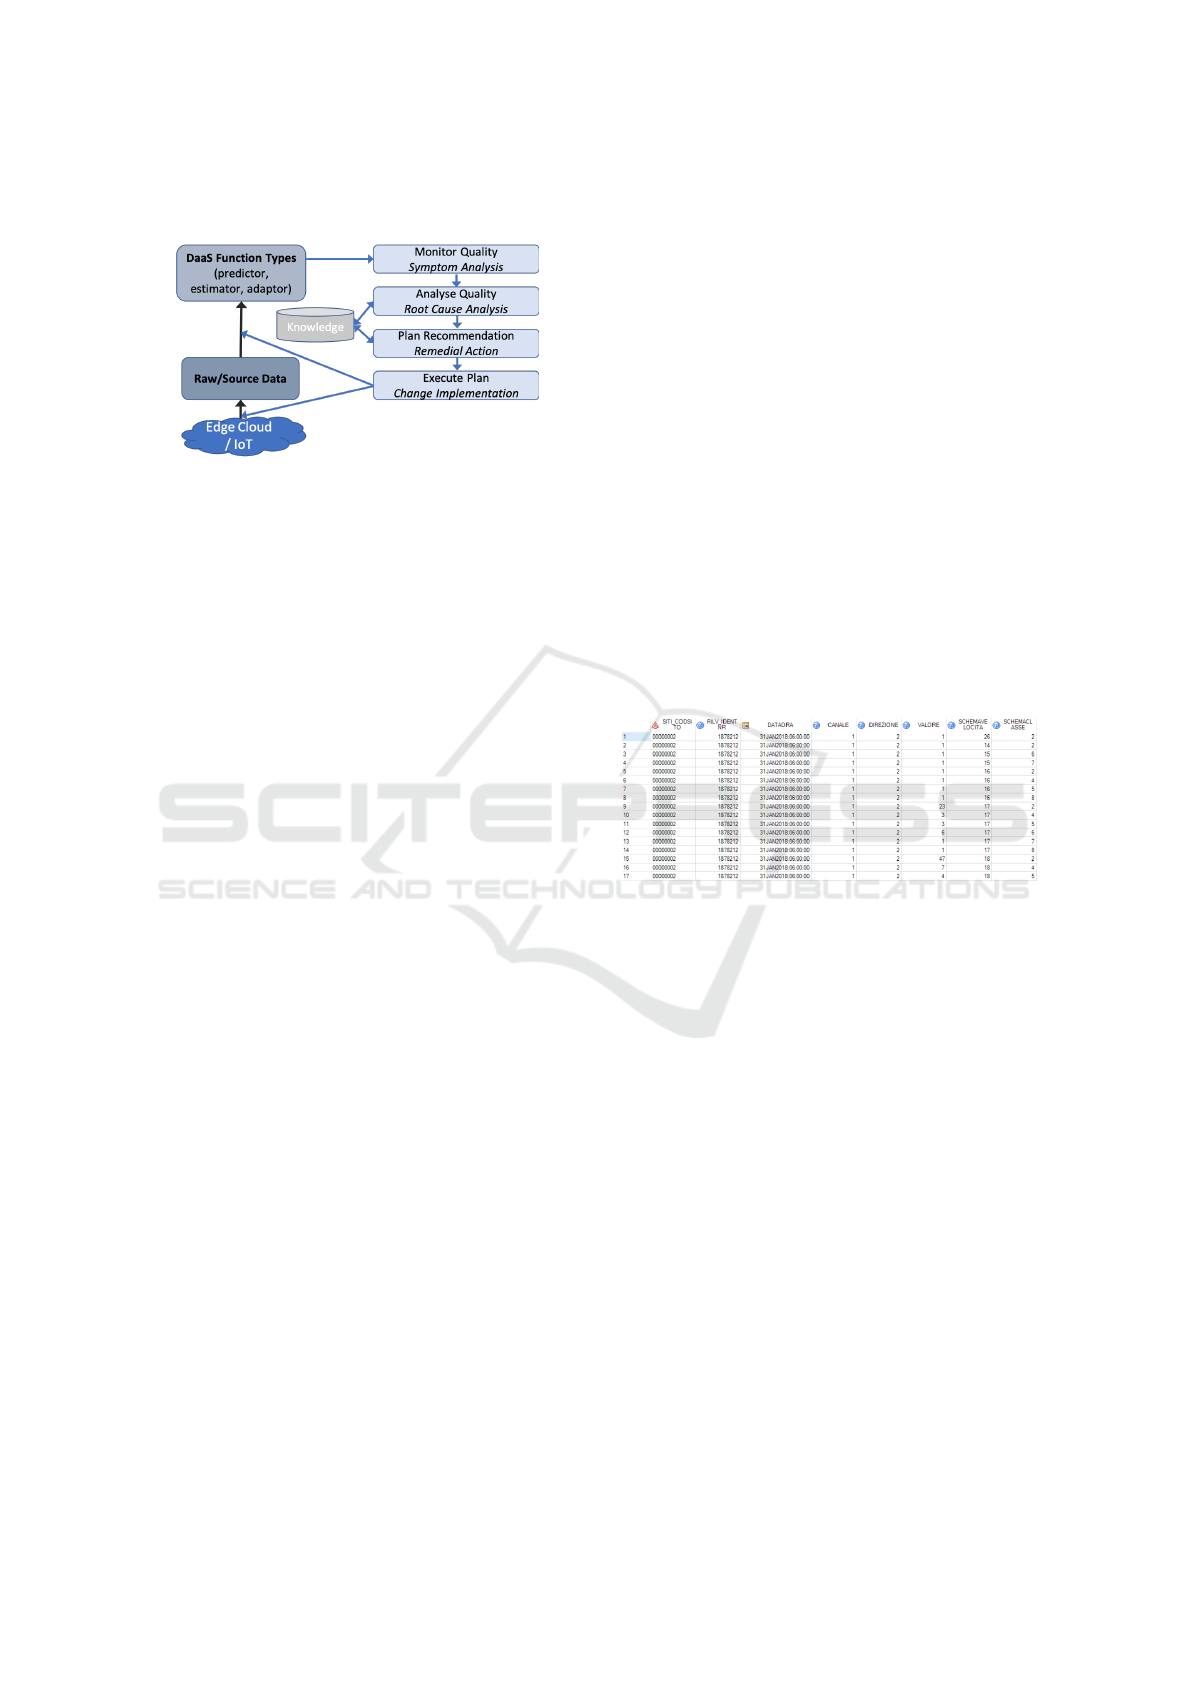
3.2 Closed Service Quality Loop
Figure 2: Closed Service Feedback Quality Loop.
Our DaaS Quality Management Architecture includes
a feedback loop based on the MAPE-K adaptation
pattern (with its Knowledge-based phases Monitor,
Analyse, Plan and Execute) to control data and infor-
mation quality, see Fig. 2. At the core is a mapping of
DaaS model quality to source data quality, see Fig. 1.
Accuracy is considered the most important quality
concern. High precision relates to a low false posi-
tive (FP) rate T P/(TP +FP), i.e., correctly identified
over incorrectly identified. High recall relates to a low
false negative (FN) rate T P/(T P+FN), i.e., correctly
identified over not identified correct cases. High pre-
cision means that a DaaS function returns substan-
tially more relevant results than irrelevant ones, while
high recall means that it returns most of the relevant
results.
For example for predictor accuracy, influencing
factors are data incomplete, data incorrect, data dupli-
cation, and outdated data. A concrete example is the
count of road services per areas, which could suffer
from outdated or duplicated data. For correctness, the
same as above is the case. For estimator effectiveness,
an example is outdated date, which applies to self-
adaptive systems for traffic control that directly de-
pend on the current situation. Adaptor ineffectiveness
could be caused by an incorrect format in tempera-
ture measurements (Celsius vs Fahrenheit). Some of
these conditions also depend on whether the applica-
tion context is stateful or stateless as in the ’outdated’
case.
The analysis of the underlying data quality prob-
lem of the observed ML quality problem could lead
to remediation recommendations in two categories:
Source data: recommendation to use other raw/source
data, which could mean more, different, or less data.
ML training/testing data: recommendation to use
other ML training/testing data selected or to use even
another ML technique.
4 USE CASE: IoT-EDGE TRAFFIC
MANAGEMENT
4.1 Quality Assessment and Symptom
Analysis
We start with quality assessment and symptom anal-
ysis activities. The different DaaS service functions
shall be discussed in terms of (i) the quality dimen-
sion and its definition, (ii) a concrete example of a
DaaS function and (iii) the determination of quality
value. In a negative quality case, we talk about the
symptom. These are based on a vehicle data set based
on the ’TrafficCount’, combined with ’WeatherData’
for the respective location, see Fig. 3. The functions
and expected qualities are as summarised in Table 1
with how the quality is measured and success is de-
termined. We look at three function types and their
quality goals:
(1) An estimator for traffic volume: effective and
complete.
Figure 3: Traffic Count Data Set - based on Re-
gional Recordings https://mobility.api.opendatahub.bz.it/
v2/swagger-ui.html.
Here the effectiveness can be defined as to what
extend the estimation can be correct and effective for
better performance. For example, to estimate the traf-
fic volume for an August in general irrespective of
concrete weather, we obtain the result by using super-
vised learning. To ensure the correctness of the esti-
mation, the historic data should be checked, e.g., the
results from earlier years Y 1 and Y 2 imply the estima-
tion year Y 3, i.e., Y 1,Y2 → Y 3. Completeness for the
estimator is easy to determine.
This function is used for long-term road planning
for all roads, see Fig. 3.
(2) A predictor for traffic volume and level for a con-
crete future date.
For this purpose, the function calculates a volume
V using F(T,C,W ) → V : INT based on temperature,
number of cars and weekday. For immediate assess-
ment, we need to check observations in the current
state and assume problems might have been there also
in the past. Furthermore, we cannot predict the likeli-
hood of any source of problem.
CLOSER 2021 - 11th International Conference on Cloud Computing and Services Science
330

Figure 4: Public DaaS [Web Site] – Traffic Level Pre-
diction – motivated by https://www.autobrennero.it/en/
on-the-road/traffic-forecast/.
As another example, we can consider a predictor
for car types: accurate and correct. In this situation
correctness can be considered a special case of accu-
racy, i.e., 100% accuracy.
This function is used for short/mid-term manage-
ment on major roads, see Fig. 4.
(3) An adaptor for traffic signs: effective and opti-
mal.
Figure 5: Public DaaS [Road Sign] – Dynamic Traffic Sign-
post on the Motorway.
An adaptor proposes some actions after the cal-
culation and evaluation of the situation. An adaptor
function should be effective. For this function the
calculations for speed are done based on car volume
and emissions (F(C, E) = Speed). The optimal tar-
get is minimal emissions E
min
, but this is constrained
by traffic throughput (too restrictive speed limit might
cause traffic stop and thus low emissions, but through-
put is inadequate). If the quality is insufficient, the
problem could be either the training data and sensors.
This is used for immediate motorway manage-
ment, see Fig. 5.
4.2 Root Cause Analysis and Remedy
Recommendation
We now look at cause analysis in more detail. The use
cases are summarised in Table 2 for the data quality
analysis and Table 3 for the problem root cause analy-
sis and recommendation. The aim is now to determine
a cause (either definitive or likely) from sources such
as training data or source data. For all cases, we note
(i) calculation of metric, (ii) assessment of problem
situation, (iii) analysis of possible root causes (along
the two categories or more fine-granular in terms of
concrete data quality dimensions, and (iv) a strategy
for better cause determination.
4.2.1 Steps 1 and 2: Metric Calculation and
Problem Assessment
These steps are presented in Table 2. For the predic-
tor accuracy, we analysed the accuracy input parame-
ters: TP: if current state OBS(currentstate) is correct
and next state V = OBS(nextstate) also results in cor-
rectness – indicates a given condition exists, when it
really does. FP: if current state OBS(currentstate) is
incorrect and next state V = OBS(nextstate) results in
correctness – indicates a given condition exists, when
it does not. TN: if current state OBS(currentstate)
is correct and next state V 6= OBS(nextstate) re-
sults in incorrectness – indicates a condition does
not hold, when it really does not. FN: if current
state OBS(currentstate) is incorrect and next state
V 6= OBS(nextstate) results in incorrectness – indi-
cates that a condition does not hold, while in fact it
does.
4.2.2 Step 3: Cause Analysis and
Recommendation
The use case results are presented in Table 3. For
Case 2 for example, false positive (FP) is an error in
data reporting in which a result improperly indicates a
problem, when in reality it is not present such as a ve-
hicle that is not a car, but recognised as such. A false
negative (FN) is an error in which a result wrongly
indicates no quality problem (the result is negative),
when actually it is present. Here, raw sensor data can
be wrong. Consequently, FP problem causes are:
• raw data is wrong: e.g., sensors giving incomplete
data such as too small dimensions given so that a
van is recognised as a car,
• training data is wrong: e.g., not enough anno-
tated/labelled cars in training set so that very large
cars (SUV) are identified as vans/trucks.
We can also summarise the FN problem causes:
• raw data wrong: either sensors giving incomplete
data (e.g., too big dimensions provided, so that its
recognised as a van) or sensors giving incomplete
data (e.g., too small dimensions given so that a
van is recognised as a car),
• training (data) wrong: not enough anno-
tated/labelled cars in training set so that very large
cars (SUV) are identified as van/truck training
(data) wrong (not enough annotated/labelled cars
Continuous Data Quality Management for Machine Learning based Data-as-a-Service Architectures
331

Table 1: Use Cases – DaaS Functions and Quality.
(1) Estimator (2) Predictor (3) Adaptor
Function
& Quality
Estimator: effective, complete Predictor: accurate, cor-
rect
Adaptor: effective
Sample
Function
estimate the traffic volume for an
August in general
car type categorisation calculate traffic sign action (target:
change speed limits to lower emissions)
Quality
Value
Calculation: correctness of pre-
diction for historic data (could use
for training/validation data from
past August or previous July).
Success: degree of effectiveness
for threshold T
Calculation: Precision,
Recall based on TP, FP,
FP, FN.
Success: a threshold T on
predefined degree of ac-
curacy.
Calculation: observation after applying
action OBS
E
(Apply(Action)).
Success: is effective, if E
i+1
< E
i
for
emissions E. The aim is the reach a target
emission while not having too slow traf-
fic.
Table 2: Use Cases – DaaS Quality Analysis.
(1) Estimator (2) Predictor (3) Adaptor
Calculation
of Metric
F(C,P) → Volume esti-
mates volumes of traffic
for general periods
F(T,C,W) → Volume predicts
vehicle numbers based on tem-
perature, counted cars, weekday
F(C,E) = Speed adapts speed limits
based on car volume and emission
Assessment
of Problem
Situation
Goal achievement:
• the results from
earlier years Y 1
to Y2 imply the
estimation Y 3, i.e.,
Y 1,. ..,Y2 → Y 3
Goal achievement:
• Four cases occur: (i) 100%
accuracy, (ii) < 100% ac-
curacy, but within tolerance
(threshold T ), (iii) < T %,
(iv) undefined.
• Accuracy is defined us-
ing Precision =
T P
T P+FP
and
Recall =
T P
T P+FN
.
Goal achievement:
• emissions (primary): E
new
≤ E
T
for
threshold T as ultimate goal; E
new
<
E
old
as just improvement, i.e. these
are 100% effective, and x% effective.
• throughput: OBS
C
( Apply( Speed)) =
C
new
• secondary: C
new
as close as possible
to C
old
Table 3: Use Cases – Cause Analysis and Recommended Target for Remedial Action.
(1) Estimator (2) Predictor (3) Adaptor
Cause
Analy-
sis
Both training and
sensor data can be
a cause for quality
problems
Training data: F is always fully defined
Sensor data: possible problems include data integrity (vio-
lation of domain or integrity constraint) and data complete-
ness, but generally all data quality dimensions are relevant
Both training and
sensor data can be
a cause for quality
problems
in training set so that very small or very large cars
are not covered.
Cause Analysis. In order to determine problems, we
try to identify indicative patterns or anomalies. In
pattern identification different situations can be dis-
tinguished. For example, a steep decrease in a quality
graph over time (time series) could point to a sudden
sensor failure. A gradual decrease of quality could
point to problems within the data. In a flat effective-
ness quality graph, the problem could be arising from
the training data. Or in other cases, in a classification
function, patterns in sequences of symbols can have
different meanings in each situation, e.g., unexpected
repeated symbols or unexpected increase in symbols.
Examples where time series can help are (i) out-
ages, i.e., no data for a period (communications prob-
lem), and (ii) incorrect data, i.e., sensors faulty (e.g.,
giving to high measurements). Here, the Assessment
is based on the detection of patterns or anomalies. A
time series for a current assessment could for example
be a normal series CBTCBT , changing into CCT TCC
as a sequence that shows an unusual pattern (here for
vehicle categories car C, bike B and truck T ). The
cause analysis uses pattern/anomaly detection, with
pattern mappings to the data level. Time series can
be used for predictive maintenance (prediction of fu-
ture problems, through the identification of changing
patterns).
Remediation Recommendation. The general strat-
egy used in all quality remediations is training data
validation. Different DaaS functions F
i
are created for
different training data sets and then according to the
result different options can be taken. One option is to
compare functions themselves and another one is to
compare input/output values. For instance, we could
do majority vote on similarity (e.g., on 3 data sets).
If one is different, this set has a specific property,
e.g., more July data than others. The recommendation
CLOSER 2021 - 11th International Conference on Cloud Computing and Services Science
332

could be to check July data for completeness or accu-
racy. This might have to be done manually. If neces-
sary, a different function needs to be constructed.
The primary remedial strategy is starting with
training data changes and/or constructing different
DaaS functions. An automated comparison can then
be carried out, in relation to historic data or be-
tween different functions. This strategy has the
pragmatic advantage of involving only the data sci-
ence/engineering team.
5 RELATED WORK
The related work shall now be discussed by covering
the data quality level, machine learning process per-
spective and DaaS model quality.
Data-level quality has been investigated in
(O’Brien et al., 2013), (Casado-Vara et al., 2018),
(Sicari et al., 2016). In (O’Brien et al., 2013), data
quality problems where classified into two groups of
context-independent and context-dependant from the
data and user perspective. In (Casado-Vara et al.,
2018), a new architecture based on Blockchain tech-
nology was proposed to improve data quality and
false data detection. In (Sicari et al., 2016), a
lightweight cross-domain prototype of a distributed
architecture for IoT was also presented, providing
supporting algorithms for the assessment of data qual-
ity and security. We adapted here (O’Brien et al.,
2013) to our IoT application context.
The ML process perspective was discussed in
(Amershi et al., 2019). A machine learning work-
flow with nine stages was presented in which the
early stages are data oriented. Usually the workflows
connected to machine learning are highly non-linear
and often contain several feedback loops to previ-
ous stages. If the system contain multiple machine
learning components, which interact together in com-
plex and unexpected ways, this workflow can become
more complex. We investigate here a broader loop
from the later final ML function stages to the initial
data and ML training configuration stages, which has
not been comprehensively attempted yet.
Another aspect is the machine learning layer
(Plewczynski et al., 2006), (Caruana and Niculescu-
Mizil, 2006). Different supervised learning ap-
proaches were used. Specific quality metrics ap-
plied to ML-based data models have been investi-
gated. (Kleiman and Page, 2019) discuss the area un-
der the receiver operating characteristic curve (AUC)
as an example of quality for classification models. In
(Sridhar et al., 2018), a solution for model governance
in production machine learning is presented where
one can track and understand the provenance infor-
mation of how an ML prediction solution came to be.
Also the quality of data in ML has been investigated.
An application use case was presented, but without a
systematic coverage of quality aspects. Data quality is
important in many ML-supported DaaS applications,
such as scientific computing. In (Deja, 2019), the au-
thors investigate high-energy physics experiments as
an IoT-type setting that points out the need for a sys-
tematic, automated approach to achieve higher accu-
racy compared to training problems arising from man-
ual data labelling. While the previous work looked
at the DaaS side as root causes, in (De Hoog et al.,
2019) another IoT and edge cloud setting is consid-
ered that highlights the uncertainty of sensory data
as problem causes. The proposal is also to give data
quality a prominent role in the process. (Ehrlinger
et al., 2019) only covers IoT root causes in the anal-
ysis, but not ML training data problems. We aimed
here to condense the different individual quality con-
cerns in a joint data service quality model that takes
in board lessons learned from (Deja, 2019; De Hoog
et al., 2019; Ehrlinger et al., 2019), but provides a
closed feedback loop.
6 DISCUSSION AND
CONCLUSIONS
DaaS applications make data accessible that in its raw
data format would not be usable. Machine learning is
often used to process raw data in order to create mean-
ingful information for a DaaS consumer. While typ-
ically accuracy is the key concern of the created data
models, we aim at a broader categorisation of quality,
covering the raw data as well as the DaaS model layer
We investigated an integrated DaaS quality manage-
ment framework. We provided a fine-granular model
for a range of service quality concerns addressing
common types of machine learning function types.
The central technical advancement is the mapping of
observable quality deficiencies of DaaS functions to
underlying, possible hidden data quality problems,
i.e., providing a root cause analysis for symptoms ob-
served by the service consumer. In addition, remedial
actions for the identified problems and causes can be
recommended by the framework.
In the use cases, we considered the validation of
both DaaS function types and related data quality
types in symptom and root cause analysis. In our IoT
and edge cloud case study, quality data regarding cur-
rent situations have been used as well as time series,
Continuous Data Quality Management for Machine Learning based Data-as-a-Service Architectures
333

Table 4: DaaS Quality Assessment Dimensions.
DaaS Quality Value DaaS Quality Time Series
quality
value
accuracy correct/
effective:
optimal accuracy correct/ ef-
fective
optimal
metric &
measure-
ment
mostly done man-
ual, maybe auto-
mated with other
sensors, e.g., opti-
cal issues (dust) or
loss of connectiv-
ity can be detected
historic
data –
can be
mostly
auto-
mated
can be auto-
mated, but
needs waiting
for the next
state; can either
be ML data or
raw data
determine
source by map-
ping time series
to underlying
raw data se-
quences (e.g.,
car type series)
tempera-
ture predic-
tion series
(jump > 20
degrees
is sensor
fault)
time series could be
difficult to interpret
(if heating switched
on or cloud work-
load is suddenly
high), the adaptor
will struggle
as indicated in the table
1
. The main observations for
both situational and time series-based quality analy-
sis are summarised in Table 4 that covers the different
quality concerns and how they are determined.
Some open problems remain, however. We pro-
vided informal definitions for the function and data
quality concepts, but all aspects beyond accuracy
need to be fully formalised.
From an architectural perspective, we also plan
to address more complex architectures with multiple
clusters of data producers to be coordinated (Fowley
et al., 2018; Scolati et al., 2019; von Leon et al., 2019;
von Leon et al., 2018), which would allow us to gen-
eralise the results to multiple edge-centric DaaS (Pahl
et al., 2018).
We considered traffic management and weather so
far. Another application domain is mobile learning
that equally includes heavy use of data being collected
from and delivered to mobile learners and their de-
vices (Kenny and Pahl, 2005; Pahl et al., 2004; Mur-
ray et al., 2003; Melia and Pahl, 2009). These systems
also rely on close interaction with semantic process-
ing of interactions in order to support cognitive learn-
ing processes (Fang et al., 2016; Javed et al., 2013),
which would help to increase the understandability of
the DaaS offering provided.
The ultimate aim is to to automate the problem
cause identification, e.g., through the analysis of ML
techniques such as regression, classification or clus-
tering or through the use of statistical (probabilistic)
models, e.g., to use Hidden Markov Models HMM
to map observable DaaS function quality to hidden
data quality via reason-based probability assignment.
The automation of assessment and analyses is a fur-
ther concern that we aim to address in the future.
1
In addition to time series, aggregation is a mechanism
based on location or time. However, this has not been cov-
ered in the use cases.
REFERENCES
Amershi, S., Begel, A., Bird, C., DeLine, R., Gall, H., Ka-
mar, E., Nagappan, N., Nushi, B., and Zimmermann,
T. (2019). Software engineering for machine learning:
A case study. In Intl Conf on Software Engineering -
Software Engineering in Practice track. IEEE.
Azimi, S. and Pahl, C. (2020a). A layered quality frame-
work in machine learning driven data and information
models. In 22nd International Conference on Enter-
prise Information Systems.
Azimi, S. and Pahl, C. (2020b). Root cause analysis and
remediation for quality and value improvement in ma-
chine learning driven information models. In 22nd
International Conference on Enterprise Information
Systems.
Caruana, R. and Niculescu-Mizil, A. (2006). An empiri-
cal comparison of supervised learning algorithms. In
Proceedings of the 23rd International Conference on
Machine Learning, page 161168.
Casado-Vara, R., de la Prieta, F., Prieto, J., and Corchado,
J. M. (2018). Blockchain framework for iot data qual-
ity via edge computing. In Proceedings of the 1st
Workshop on Blockchain-Enabled Networked Sensor
Systems, page 1924.
De Hoog, J., Mercelis, S., and Hellinckx, P. (2019). Improv-
ing machine learning-based decision-making through
inclusion of data quality. CEUR Workshop Proceed-
ings, 2491.
Deja, K. (2019). Using machine learning techniques for
data quality monitoring in cms and alice. Proceedings
of Science, 350.
Ehrlinger, L., Haunschmid, V., Palazzini, D., and Lettner,
C. (2019). A daql to monitor data quality in machine
learning applications. In Database and Expert Sys-
tems Applications, pages 227–237.
Fang, D., Liu, X., Romdhani, I., Jamshidi, P., and Pahl, C.
(2016). An agility-oriented and fuzziness-embedded
semantic model for collaborative cloud service search,
retrieval and recommendation. Future Gener. Comput.
Syst., 56:11–26.
Fowley, F., Pahl, C., Jamshidi, P., Fang, D., and Liu, X.
(2018). A classification and comparison framework
for cloud service brokerage architectures. IEEE Trans.
Cloud Comput., 6(2):358–371.
CLOSER 2021 - 11th International Conference on Cloud Computing and Services Science
334

Javed, M., Abgaz, Y. M., and Pahl, C. (2013). Ontology
change management and identification of change pat-
terns. J. Data Semant., 2(2-3):119–143.
Kenny, C. and Pahl, C. (2005). Automated tutoring for a
database skills training environment. In 36th Tech-
nical Symposium on Computer Science Education,
SIGCSE, pages 58–62. ACM.
Kleiman, R. and Page, D. (2019). Aucµ: A performance
metric for multi-class machine learning models. In
Intl Conference on Machine Learning, pages 3439–
3447.
Mahdavinejad, M. S., Rezvan, M., Barekatain, M., Adibi,
P., Barnaghi, P., and Sheth, A. P. (2018). Machine
learning for internet of things data analysis: a sur-
vey. Digital Communications and Networks, 4(3):161
– 175.
Melia, M. and Pahl, C. (2009). Constraint-based valida-
tion of adaptive e-learning courseware. IEEE Trans.
Learn. Technol., 2(1):37–49.
Murray, S., Ryan, J., and Pahl, C. (2003). Tool-mediated
cognitive apprenticeship approach for a computer en-
gineering course. In International Conference on Ad-
vanced Learning Technologies, pages 2–6. IEEE.
Nguyen, T. L. (2018). A framework for five big vs of big
data and organizational culture in firms. In Interna-
tional Conference on Big Data.
O’Brien, T., Helfert, M., and Sukumar, A. (2013). The value
of good data- a quality perspective a framework and
discussion. In International Conference on Enterprise
Information Systems.
Pahl, C., Barrett, R., and Kenny, C. (2004). Supporting
active database learning and training through interac-
tive multimedia. In 9th Conference on Innovation and
Technology in Computer Science Education, ITiCSE,
pages 27–31. ACM.
Pahl, C., Fronza, I., Ioini, N. E., and Barzegar, H. R. (2019).
A review of architectural principles and patterns for
distributed mobile information systems. In Interna-
tional Conference on Web Information Systems and
Technologies.
Pahl, C., Ioini, N. E., Helmer, S., and Lee, B. A. (2018).
An architecture pattern for trusted orchestration in iot
edge clouds. In Intl Conf on Fog and Mobile Edge
Computing. IEEE.
Plewczynski, D., Spieser, S. A. H., and Koch, U. (2006).
Assessing different classification methods for virtual
screening. Journal of Chemical Information and Mod-
eling, 46(3):1098–1106.
Saha, B. and Srivastava, D. (2014). Data quality: The other
face of big data. In 2014 IEEE 30th International
Conference on Data Engineering, pages 1294–1297.
IEEE.
Scolati, R., Fronza, I., Ioini, N. E., Samir, A., and Pahl,
C. (2019). A containerized big data streaming archi-
tecture for edge cloud computing on clustered single-
board devices. In Intl Conf on Cloud Computing and
Services Science.
Sicari, S., Rizzardi, A., Miorandi, D., Cappiello, C., and
Coen-Porisini, A. (2016). A secure and quality-aware
prototypical architecture for the internet of things. In-
formation Systems, 58:43 – 55.
Sridhar, V., Subramanian, S., Arteaga, D., Sundararaman,
S., Roselli, D. S., and Talagala, N. (2018). Model
governance: Reducing the anarchy of production ml.
In USENIX Annual Technical Conference.
Thatipamula, S. (2013). Data done right: 6 di-
mensions of data quality. https://smartbridge.com/
data-done-right-6- dimensions-of-data-quality/. Ac-
cessed on 2021-01-16.
von Leon, D., Miori, L., Sanin, J., Ioini, N. E., Helmer, S.,
and Pahl, C. (2018). A performance exploration of ar-
chitectural options for a middleware for decentralised
lightweight edge cloud architectures. In Intl Conf on
Internet of Things, Big Data and Security, pages 73–
84.
von Leon, D., Miori, L., Sanin, J., Ioini, N. E., Helmer, S.,
and Pahl, C. (2019). A lightweight container middle-
ware for edge cloud architectures. In Fog and Edge
Computing, Wiley Series on Parallel and Distributed
Computing, pages 145–170. Wiley.
Continuous Data Quality Management for Machine Learning based Data-as-a-Service Architectures
335
