
A Dempster–Shafer Big Data Readiness Assessment Model
Natapat Areerakulkan
1
and Worapol Alex Pongpech
2
1
College of Logistics and Supply Chain, Suan Sunandha Rajabhat University, Thailand
2
Faculty of Applied Statistics, NIDA, Thailand
Keywords:
Data-driven Transformation, Big Data Readiness, Assessment Model, Five Tiers Framework,
Dempster–Shafer Theory.
Abstract:
Data-driven Transformation is a process where an organization transforms its infrastructure, strategies, opera-
tional methods, technologies, or organizational culture to facilitate and encourage data-driven decision-making
behaviors. Most importantly is the ability to handle big data in the organization. Literature shown that assess-
ing the big data readiness for the transformation of organizations in a systematically and logically model is
a topic that have yet to be addressed. An ability to create a systematically and logically big data readiness
assessment model is crucial to the progress of the transformation. Such model must also be able to handle
uncertainty, which arises during the assessment due to various circumstances. To this end, we proposed a five
tiers big data readiness assessment framework based on a Dempster–Shafer model to allow a comprehensible
and a quantify readiness standing. We also presented a numerical example of our framework and model based
on an organization that we have assessed prior.
1 INTRODUCTION
Most organizations struggled to become data-driven
organizations. Stating that companies’ inability to
handle and make use of big data in the organization is
the main reason for their struggle toward data-driven
transformation is rather apparent. The question is why
they have attempted such a problematic transforma-
tion if they are aware that they are not quite ready.
One possible reason is that they must have assessed
their readiness inaccurately.
How do companies know if they are more or less
ready for the transformation? Is there a quantitative
big data readiness assessment on how ready they are
for the data-driven transformation. We have found
that most big data readiness assessment evaluations
are qualitative reports. It is difficult for organiza-
tions to measure and compare theirs standing with the
others based on qualitative evaluation. Quantitative
evaluations, however, allow organizations to bench-
marking and measuring their big data readiness stand-
ing systematically and quantitatively.
One of the problems that are very difficult in quan-
titative evaluations is the uncertainty that can arise in
the evaluation process. Because the uncertainty is al-
ways a part of any assessment; thus, any quantitative
big data readiness assessment model should carefully
consider this uncertainty. To the extent of our knowl-
edge, we have found no research addressing the quan-
titative assessment model for assessing organizations’
big data readiness. Motivated by this research gap, we
developed a five-tier assessment framework to facili-
tate an evaluation model that allows qualitative big
data readiness standing for organizations. We termed
this big data readiness assessment (BDRA). We mod-
eled the uncertainty of assessors using the Demp-
ster–Shafer theory. The suitability of using Dempster-
Shafer theory for the BDRA model stem from the fact
that the assessment requires drawing on various lim-
ited sources of information, such as uncertainty, inad-
equate information, and inability to yield a pinpoint
qualitative evaluations by experts.
The paper is organized as follows: Section 2 de-
scribes related works in data-driven works and back-
ground on dempster-shafer. Section 3 introduces
our five dimensions Big Data Readiness Assessment
framework and the dempster-shafer model. A numeri-
cal example of the proposed model is also given at the
end of section 3. Finally, we summarize our discus-
sion and highlight the main points presented in sec-
tion 4.
Areerakulkan, N. and Pongpech, W.
A Dempster–Shafer Big Data Readiness Assessment Model.
DOI: 10.5220/0010506205810585
In Proceedings of the 23rd International Conference on Enterprise Information Systems (ICEIS 2021) - Volume 2, pages 581-585
ISBN: 978-989-758-509-8
Copyright
c
2021 by SCITEPRESS – Science and Technology Publications, Lda. All rights reserved
581
2 RELATED WORKS
While there is some research focusing on data-driven,
most of them focused on data-driven management and
data-driven decision making. Berndtsson (Berndtsson
et al., 2018) discussed how an organization could be-
come a data-driven organization, and Kolbjornsrund
(Kolbjørnsrud et al., 2018) focused on intelligence at
a scale of the data-driven organization. Some of the
data-driven decision-making research are Pongpech
(Pongpech, 2018) on using data-driven for ranking
warehouses, Lin (Li et al., 2009), on using data-driven
to detect bottleneck in manufacturing systems, and
Lusher (Lusher et al., 2014) on Data-driven medici-
nal chemistry in the era of big data.
We have found very few works focusing on the
big data readiness in itself. Pongpech (Pongpech,
2019) focused on modeling and computing relation-
ships in data-driven organizations. Ruben (Buitelaar,
2018) focused on a data-driven assessment frame-
work, which is the only work we have found that deals
directly and comprehensively with a data-driven as-
sessment model.
In our experience, big data readiness dimensions
are rather complex and composed of systems, pro-
cesses, policies, groups of users, and culture. It is
challenging to give a clear cut score on the assess-
ment. A statistical assessment model that does not
consider uncertainty might not be adequate for big
data readiness assessment. We have also found that
a rigid assessment can be difficult for the assessors
to evaluate. Big data readiness assessment models
should be somewhat flexible and allows some degree
of belief to be decided by the assessors. We address
the uncertainty that arises during the assessment and
provides flexibility for the assessors through a degree
of belief.
The Dempster-Shafer (D-S) theory has been im-
plemented widely for the assessment of various ap-
plications with uncertain information. Mathathir
(Bappy et al., 2019) presented the assessment of sup-
ply chain sustainability based on a triple bottom line
(TBL) aspects, namely economic, social, and environ-
mental aspects. Mayat (Tehrany and Kumar, 2018)
studied the prediction of flood-susceptible areas in
Brisbane, Australia based on D-S theory, where the
related flood-conditioning factors are elevation, as-
pect, plan curvature, slope, topographic wetness index
(TWI), geology, stream power index (SPI), soil, land
use/cover, rainfall, distance from road and distance
from rivers. Muhammad (Hafeez, 2011) implemented
D-S theory to predict the chance of occurrence of fire
accidents in coal mining.
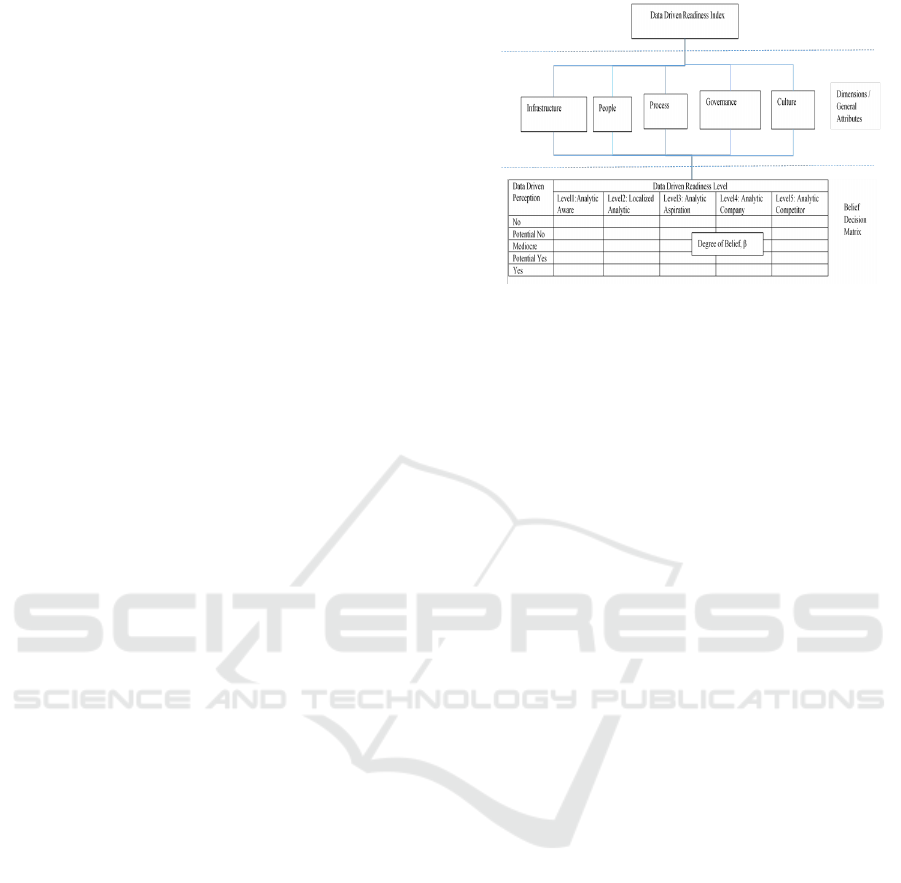
Figure 1: Data Driven Assessment Framework.
3 FRAMEWORK
The framework presents five dimensions of big data
readiness components as Infrastructure, People, Pro-
cess, Governance, and Culture, as illustrated in the
figure below. The framework then specifies five lev-
els from one to five of big data readiness standing that
can be given with each dimension, as illustrated in
figure 1.
The lowest level is called Big data Unawareness,
and it is given to organizations that are not yet pre-
pared. The second level is called Big data Awareness,
and it is given to organizations that are doing localized
analytic. The third level is called Big data Aspirators,
and it is given to organizations that are working to-
ward data-driven readiness. The fourth level is called
Big data Savvy, and it is given to organizations that
are actively using big data in the organization. The
last and the highest standing is called Big data Com-
petitor. It is given to organizations that are fully uti-
lizing big data to compete with other organizations.
The degree of belief score is range from 0.00
to 1.00 where the higher score reflects confident of
the assessors on the level of data-driven evaluation.
When aggregate degree of belief value of each level,
we obtain a matrix referred to as belief decision ma-
trix which is an input for D-S theory implementation
steps.
3.1 The Big Data Readiness Assessment
Model
The big data readiness assessment model (BDRAM)
consists of two parts, namely the developed DDRA
matrix and the assessment technique based on D-S
theory. In this paper, we adopted notation from (Wang
et al., 2009) all through out our equations.
ICEIS 2021 - 23rd International Conference on Enterprise Information Systems
582

3.1.1 The BDRA Matrix
Aimed to tackle the aforementioned uncertainty, the
BDRA matrix is designed including two factors
which are data-driven perception based on existing
evidences and data-driven readiness level of evaluated
organization.
Noted that, the data driven levels are mutu-
ally exclusive and collectively exhaustive for as-
sessment, which are divided into 5 levels ranked
from lowest to highest. The data driven level
can be quantified as u(level1)=0, u(level2)=0.25,
u(level3)=0.75, u(level4)=0.75, u(level5)=1 The data
driven perception is the assessors’ perception on re-
lated evidences, also divided into five levels com-
pared to that of Likert scale as No (strongly dis-
agree), Probable No (disagree), Mediocre (neu-
tral), Probably Yes (agree), and Yes (Strongly
agree). The relative weights of the perception
levels are quantified as w
i
= w
1
, w
2
, w
3
, w
4
, w
5
=
1
15
,
2
15
,
3
15
,
4
15
,
5
15
=0.067,0.133,0.200,0.267,0.333,
where denominator obtained from summation of the
five rating scores.
Degrees of belief or basic probability assignments
(bpa) are assigned to the data driven levels by the ex-
perts. For information aggregation, the D-S rule of
combination is applied, where the judgment on differ-
ent dimensions (general attributes) can be combined
in any order due to the inherent properties of the D-S
rule.
3.1.2 The Assessment Technique
The evidential reasoning (ER) algorithm is imple-
mented for aggregating multiple dimensions (at-
tributes) based on a belief decision matrix and the evi-
dence combination rule of the D-S theory. The details
of this approach is demonstrated as follows.
Step 1. Let a problem has M alternatives a
l
,l=1,...
,M five dimensions, referred to as general attributes,
namely infrastructure, people, process, governance,
and structure. Each dimension contains L data-
driven perception levels p
i
, i = 1, . . . , L. The rela-
tive weights of the L perception levels are denoted by
W=(w
1
,. . . ,w
L
), which obtained from section 3.1.1
and satisfy the conditions 0 ≤ w
i
≤1 and
∑
L
i=1
w
i
= 1. Then, M alternatives are all assessed using the
same set of N data driven readiness assessment grade
H
n
,n=1,. . . ,N which are required to be mutually ex-
clusive and collectively exhaustive for the assessment
of all dimensions. The N assessment grades formu-
late the frame of discernment H = H
1
, . . . H
n
in the
D-S theory of evidence. If alternative a
l
is assess to a
grade H
n
on an attribute e
i
to a belief degree of β
n,i
The individual assessment of the M alternatives
on the L perception levels can be represented by the
following belief decision matrix:
D
g
= (S (e
i
(a
l
)))
L×M
(1)
The ER algorithm transforms the original belief de-
grees into basic probability masses by combining the
relative weights and the belief degrees using the fol-
lowing equations:
m
n,i
= m
i
(H
n
) = w
i
β
n,i
(a
l
), n = 1, . . . , N, i = 1, . . . , L,
(2)
m
H,i
= m
i
(H) = 1 −
N
∑
n=1
m
n,i
=1 − w
i
N
∑
n=1
β
n,i
(a
l
),
(3)
m
H,i
= m
i
(H) = 1 − w
i
, i = 1, . . . , L, (4)
˜m
H,i
= ˜m
i
(H) = w
i
1 −
N
∑
n=1
β
n,i
(a
l
)
!
, i = 1, . . . , L,
(5)
with m
H,i
= m
H,i
+ ˜m
H,i
and
∑
L
i=1
w
i
= 1.
Step 2. The basic probability masses on the L ba-
sic attributes are aggregated into the combined prob-
ability assignments by using the following analytical
formula:
{
H
n
}
: m
n
= k
"
L
∏
i=1
(m
n,i
+ m
H,i
+ ˜m
H,i
)−
L
∏
i=1
(m
H,i
+ ˜m
H,i
)
#
,
n = 1, . . . , N
{
H
}
: ˜m
H,i
= k
"
L
∏
i=1
(m
H,i
+ ˜m
H,i
)−
L
∏
i=1
(m
H,i
)
#
,
{
H
}
: ˜m
H,i
= k
"
L
∏
i=1
m
H,i
#
(6)
Step 3. The combined probability assignments are
normalized into overall belief degrees by using the
following equations
{
H
n
}
: β
n
=
m
n
1 − m
H
, n = 1, . . . , N, (7)
{
H
}
: β
H
=
˜m
H
1 − m
H
(8)
where β
n
and β
H
represent the overall belief de-
grees of the combined assessments, assigned to the
assessment grades H
n
and H respectively. The
combined assessment is also a distribution as-
sessment, which can be denoted by S (y (a
l
)) =
{
(H
n
, β
n
(a
l
)), n = 1, . . . , N
}
A Dempster–Shafer Big Data Readiness Assessment Model
583

Table 1: Infrastructure and People Assessments.
Infra Level1 Level 2 Level 3 Level 4 Level 5
NO 1 1
Potential NO 0.4 0.4
Mediocre 0.5 0.4
Potential Yes 0.2 0.6
Yes 1
People Level 1 Level 2 Level 3 Level 4 Level 5
No 1
Potential No 0.2 0.8
Mediocre 0.5 0.5
Potential Yes 0.6 0.2
Yes 0.1 0.9
Step 4. The expected utility measure can be deter-
mined using the following equations:
u
max
(a
l
) =
N−1
∑
n=1
u(H
n
)β
n
(a
l
)+ u (H
N
)β
N
(a
l
)+β
H
(a
l
)
(9)
u
min
(a
l
) = u (H
1
)β
1
(a
l
)+β
H
(a
l
)+
N
∑
n=2
u(H
n
)β
n
(a
l
)
(10)
u
average
(a
l
) =
(u
max
(a
l
) + u
min
(a
l
))
2
(11)
3.2 Numerical Example
We present numerical example of the framework. The
assessments are based on a real company that we have
gave our assessment on data driven readiness of the
company. where the require belief data are collected
based on available knowledge or information. On the
infrastructure assessment, the assessors strongly dis-
agree that its infrastructure is in the state of an analytic
competitor, which states that the degree to which the
evidence supports big data readiness level 5 is 100%
no.
Similarly, the assessors disagreed that its infras-
tructure is in the state of an analytic company and an-
alytic aspiration, which also states that the degree to
which the evidence supports big data readiness level
3 and level 4 is 40% and 40% potential no, respec-
tively. We observed that the assessment is not com-
plete, and it express 80% basic probability assignment
(bpa) whereas the remaining 20% bpa denotes igno-
rance. At the neural stage, the assessors gave a mixed
belief score of 0.5 and 0.4 on level 2 and level 3, re-
spectively. The assessors agreed that its infrastructure
is in the mix states of localized analytic (level 2) and
analytic aware (level 1) at the degree of belief val-
ues of 0.6 and 0.2, respectively. Finally, the assessors
strongly agreed that its infrastructure is in the analytic
awared state with a degree of belief value of 1. Other
assessment information for different dimensions illus-
trated in table 1 – 3.
While the infrastructure is not quite advance, the
company is doing quite well on the people standing
Table 2: Process and Governance Assessments.
Process Level 1 Level 2 Level 3 Level 4 Level 5
No 1
Potential No 0.2 0.8
Mediocre 0.7 0.2
Potential yes 0.8 0.2
Yes 1
Governance Level 1 Level 2 Level 3 Level 4 Level 5
No 0.2 0.8
Probably No 0.4 0.5
Mediocre 0.5 0.5
Probably Yes 0.8 0.2
Yes 1
Table 3: Culture Assessment.
Culture Level 1 Level 2 Level 3 Level 4 Level 5
No 1
Probably No 0.1 0.8
Mediocre 0.7 0.3
Probably Yes 0.7 0.2
Yes
of the big data readiness, as shown in table 1. On the
other hand, most companie’ processes have not quite
adapted for handling big data transformation. Most
of the business processes have not yet considered ad-
justments for big data. The standing on the data gov-
ernance dimension of the company is also not in a top
standing, as shown in table 2. It is no surprise that the
data culture of the company also scored rather low, as
shown in table 3.
Following the calculation steps as stated in sec-
tion 3.1.2, we obtain combined probability assign-
ment and overall belief degree ( β
n
, β
H
), depicted in
table 4.
Table 4: Data Driven Readiness Overall Belief Degree.
Data Driven Readiness β
n
Dimension Level 1 Level 2
Infrastructure 0.44 0.26
People 0.00 0.03
Process 0.77 0.8
Governance 0.36 0.32
Culture 0.39 0.13
We observed that for the cultural dimension, the unas-
signed degree of belief for uncertainty is 31%, which
originated from the fact that this dimension is hard to
assess in nature incorporated with several qualitative
aspects. Therefore, the assessors could not be able
to evaluate it with crisp judgment as to the absentee
of belief score at the final perception level. To get
the single value of big data readiness index, the max-
imum, minimum, and average expected utilities are
sequentially calculated by using equation 12-14. The
Table 5: Data Driven Readiness Overall Belief Degree.
Data Driven Readiness β
n
Dimension Level 3 Level 4 Level 5 β
n
Infrastructure 0.12 0.04 0.05 0.09
People 0.66 0.22 0.05 0.04
Process 0.02 0.07 0.04 0.01
Governance 0.20 0.07 0.04 0.01
Culture 0.01 0.10 0.06 0.31
ICEIS 2021 - 23rd International Conference on Enterprise Information Systems
584

calculation result demonstrates that the average util-
ity value for the big data readiness index is 0.29955,
which lies between the unified utility value of readi-
ness of level 2 and 3.
4 CONCLUSIONS
In this paper, we presented a five-dimensional Big
data readiness assessment framework and a Demp-
ster–Shafer big data readiness assessment model. We
also presented a numerical example of the framework
and the model on an organization that we have eval-
uated prior. We have found that there will always
be uncertainty when assessing organizations’ big data
readiness, as illustrated clearly on the score in the ta-
bles above. It could be from to incomplete informa-
tion or various background knowledge of each asses-
sor. Our framework and model wield the uncertainty
into a more practical big data readiness standing for
the organization.
In our numerical example, we were able to cal-
culate a big data readiness assessment standing of
0.29985 for the organization. This calculation pro-
vides the organization with a more concrete standing
that can be used as a baseline score. The computed
readiness standing score puts the organization in be-
tween level 2 and level 3 standing. It indicates that
the organization is moving toward an analytic aspi-
ration organization, but it still has a couple of levels
to improve toward being considered a big data ready
organization.
REFERENCES
Bappy, M. M., Ali, S. M., Kabir, G., and Paul, S. K. (2019).
Supply chain sustainability assessment with dempster-
shafer evidence theory: Implications in cleaner pro-
duction. Journal of Cleaner Production, 237:117771.
Berndtsson, M., Forsberg, D., Stein, D., and Svahn, T.
(2018). Becoming a data-driven organisation.
Buitelaar, R. (2018). Building the data-driven organization:
a maturity model and assessment. Master’s thesis,
Leiden Institute of Advanced Computer Science (LI-
ACS), The Netherlands.
Hafeez, M. (2011). Application of dempster shafer theory to
assess the status of sealed fire in a cole mine. Master’s
thesis, , School of Engineering.
Kolbjørnsrud, V., Andersen, E., Johnson, J., and Ragnvald,
S. (2018). The data-driven organization: Intelligence
at SCALE, pages 23–42.
Li, L., Chang, Q., and Ni, J. (2009). Data driven bottle-
neck detection of manufacturing systems. Interna-
tional Journal of Production Research, 47(18):5019–
5036.
Lusher, S. J., McGuire, R., [van Schaik], R. C., Nicholson,
C. D., and [de Vlieg], J. (2014). Data-driven medicinal
chemistry in the era of big data. Drug Discovery To-
day, 19(7):859 – 868. Theme sections: • Huntington’s
Disease. Guest Editor: Craig Blackstone • Exercise
Physiology. Guest Editor: Pontus Almer Bostrom.
Pongpech, W. A. (2018). On application of learning to rank
for assets management: Warehouses ranking. In Yin,
H., Camacho, D., Novais, P., and Tall
´
on-Ballesteros,
A. J., editors, Intelligent Data Engineering and Au-
tomated Learning - IDEAL 2018 - 19th International
Conference, Madrid, Spain, November 21-23, 2018,
Proceedings, Part I, volume 11314 of Lecture Notes
in Computer Science, pages 336–343. Springer.
Pongpech, W. A. (2019). Modeling data driven interac-
tions on property graph. In Yin, H., Camacho, D.,
Ti
˜
no, P., Tall
´
on-Ballesteros, A. J., Menezes, R., and
Allmendinger, R., editors, Intelligent Data Engineer-
ing and Automated Learning - IDEAL 2019 - 20th
International Conference, Manchester, UK, Novem-
ber 14-16, 2019, Proceedings, Part I, volume 11871
of Lecture Notes in Computer Science, pages 68–75.
Springer.
Tehrany, M. and Kumar, L. (2018). The application of
a dempster–shafer-based evidential belief function in
flood susceptibility mapping and comparison with fre-
quency ratio and logistic regression methods. Environ-
mental Earth Sciences, 77.
Wang, Y.-M., Yang, J.-B., Xu, D.-L., and Chin, K.-S.
(2009). The evidential reasoning approach for mul-
tiple attribute decision analysis using interval belief
degrees. European Journal of Operational Research,
175:35–66.
A Dempster–Shafer Big Data Readiness Assessment Model
585
