
A Novel Approach of Environment Impact Assessment and Emission
Measurement on the Inter-city Transportation in the Greater Bay
Area (GBA) of China using a Modified Gravity Model
Eugene Yin Cheung Wong
1
, Danny Chi Kuen Ho
1
, Stuart So
1
,
Eve Man Hin Chan
2
and Chi-Wing Tsang
3
1
Department of Supply Chain and Information Management, The Hang Seng University of Hong Kong, Hong Kong
2
Department of Design, Faculty of Design and Environment, Technological and Higher Education
Institute of Hong Kong (THEi), Hong Kong
3
Department of Construction Technology and Engineering, Technological and Higher Education
Institute of Hong Kong (THEi), Hong Kong
Keywords: Carbon Footprint, Emission, EV, GBA, Gravity Model, HFCV, LCA, Linear Regression.
Abstract: The Guangdong-Hong Kong-Macau Greater Bay Area (GD-HK-MO) also referred as Greater Bay Area
(GBA), is a megalopolis, consisting of nine cities and two special administrative regions, i.e., Hong Kong and
Macao in South China. GBA has a total population of approximately 71.2 million people representing about
5% of China’s total population with a combined regional GDP at USD 1642 billion in 2018, i.e. about 12%
of GDP for the whole mainland China. Hong Kong acting as a window of China, plays a critical role in
contributing to the growth of the GDP. Given the enormous scale of this regional economy and increasing
collaboration among these GBA cities, it is utmost important to design a novel environmental impact
assessment and emission measurements of the cross-border transportation among Hong Kong and various
GBA cities with the aim of proposing countermeasures on carbon emissions of vehicles in the transport and
logistics sector of the GBA. In the study, two modified gravity models are designed by considering social,
economic, and other variables affecting the carbon
emission of vehicles travelling within and across cities in
the GBA. Further study will be pursued using decomposition analysis based on the modified gravity model
to analyse the crucial contributors and determinants of carbon emission among the GBA cities.
1 INTRODUCTION
The need for sustainable low-carbon transport and
logistics has become a top priority in many countries
since emission targets were set at the Conference of
Parties to the United Nation Framework Convention
on Climate Change (COP21), and a number of
countries have set policies to ban new petrol and
diesel cars by 2030 or 2040 (Clover, 2017;
McKinnon, 2018; Vaughan, 2018). Carbon
mitigation in the transport and logistics sector was
emphasised at the recent World Economic Forums
because this sector is the world’s second-largest
carbon emitter, growing from 22% of global carbon
emissions in 2011 to 23% in 2015 (IEA, 2012; IEA,
2017). The 2018 Policy Address of Hong Kong
promoted the development of renewable energy as an
integral part of mitigating climate change (Lam,
2018). Hong Kong has set a target of reducing carbon
intensity by between 65% and 70% by 2030
compared with the 2005 level, which is equivalent to
an absolute reduction of 26% to 36%, or a reduction
in per-capita emissions from about 5.7 tonnes in 2015
to about 3.3 to 3.8 tonnes in 2030. Thus, exploring the
use of renewable energy for major vehicles is critical
for sustaining Hong Kong’s long-term
decarbonisation strategy as a smart city with low
carbon transport and logistics (Alaswad, 2016;
Environment Bureau, 2017). Currently, there are only
11,417 road-use electric vehicles (EV) in Hong Kong,
including private cars and goods vehicles; as these
account for less than 1.5% of all licensed vehicles, the
challenges of achieving decarbonisation and
renewable energy for sustainable transport and
logistics are huge. There are studies that hydrogen-
powered vehicles have lower carbon emissions, faster
686
Wong, E., Ho, D., So, S., Chan, E. and Tsang, C.
A Novel Approach of Environment Impact Assessment and Emission Measurement on the Inter-city Transportation in the Greater Bay Area (GBA) of China using a Modified Gravity Model.
DOI: 10.5220/0010500806860692
In Proceedings of the 7th International Conference on Vehicle Technology and Intelligent Transport Systems (VEHITS 2021), pages 686-692
ISBN: 978-989-758-513-5
Copyright
c
2021 by SCITEPRESS – Science and Technology Publications, Lda. All rights reserved

refuelling speeds and lower maintenance costs over
EVs, and a number of countries, including Germany,
France, Japan and South Korea, have introduced
hydrogen-powered fuel cells with government-
supported pilot runs on the road (Cano et al., 2018;
Ryall, 2018; Schoentgen, 2018; Topel, 2018; UNDP,
2017). Hydrogen-powered vehicles suit the emerging
needs of long-range and high-utilisation
transportation vehicles for logistics cars and trucks
(Cano et al., 2018). With the large number of licensed
vehicles in Hong Kong and cities in the Greater Bay
Area (GBA; e.g., 3.18 million in Shenzhen, 2.34
million in Guangzhou, 62 thousands in Zhuhai, and
78 thousands in Hong Kong), achieving zero-carbon
emissions in transport and logistics requires effective
measurement of the carbon footprint of a vehicle and
its usage in addition to the development of renewable
energy for motor cars and trucks, especially given the
increasing traffic flow between Hong Kong and
Zhuhai across the Hong Kong–Zhuhai–Macau Bridge
(HZMB) (National Bureau of Statistics of China,
2018). Thus, structured and systematic measurement
of the carbon footprint of a vehicle is necessary, both
from cradle-to-gate and cradle-to-grave, as is the
exploration of renewable energy to mitigate carbon
emission in transport and logistics in GBA cities. The
car-manufacturing process is complex, involving
component manufacturing and assembly, and there is
a lack of research on the product carbon footprints of
automotive, in particular cars and trucks (Berners-Lee
& Clark, 2013; Zhao et al., 2012). In addition,
because the hydrogen-oxygen combustion product is
the cleanest substance (water and heat) and has a fast-
refuelling speed, it has great potential for use in
automobiles and automotive products. Replacing
fossil fuels in the transport sector by renewable
energy will help combat climate change through
reducing the carbon footprint significantly within the
vehicle operation cycle. The economic and
environmental impact of the use of renewable energy
vehicles travelling both within and amongst Hong
Kong and GBA cities should thus be analysed.
The proposed project aims to develop an
environmental impact assessment and product carbon
footprint measurement for selected EV used in
transport and logistics and to design a renewable
energy hydrogen-powered fuel cell prototype for
motor cars and trucks. A novel method for EV carbon
footprint measurement and a renewable energy fuel
cell will be developed. It is the objective to incoproate
these carbon footprint measurements into the graviity
model which is not covered by previous studies which
usually emphasise on economic mass. A hybrid
product carbon footprint will be adopted that
integrates process-based and organisation-level
approaches. Upon measuring the current emission
level of vehicle automotive products in pilot
companies, a solid-state hydrogen-powered fuel cell
will be explored. A hydrogen fuel cell prototype will
be developed and applied to vehicles’ automotive
system. The carbon emissions from conventional,
hybrid, electric and hydrogen fuel cell vehicles will
be evaluated and compared, and a sensitivity analysis
and cost and benefit analysis will be conducted. A
model analysing the economic and environmental
impact on Hong Kong and cities in the Greater Bay
Area (GBA) will be evaluated. A database platform
with the carbon emissions of vehicles in the transport
and logistics sector will be established that includes
emission factors and carbon emitted by various types
of energy-consumed vehicles. This database will
facilitate measurement and research analysis
activities to mitigate carbon emissions in transport
and logistics in Hong Kong and GBA cities.
2 LITERATURE REVIEW
2.1 Gravity Model
The concept of a center of gravity of a material body
is derived from physics and was first applied to
analyze the spatial distribution of the population in
the U.S. in 1872 (Hilgard, 1872). A center of gravity
represents the point that can balance all of the gravity
produced by the fulcrum that pushes back into the
gravitational field, regardless of the location of the
object (Kumler and Goodchild, 1992). In terms of the
economic centers of gravity, the assumption is that
economic forces, such as gross domestic product
(GDP) and population, balance the regional economy
(Kumler and Goodchild, 1992). Over the years, a large
number of research studies in economics have widely
applied the gravity model (Kandogan, 2014) to study
the impact of geographic distribution on trade (Chan et
al., 2018), immigration (Karemera et al., 2000, Lewer
and Berg, 2008), population (Kumler and Goodchild,
1992, McKee et al., 2015; Yang and He, 2017), and
land utilization (Chen and Zhou, 2011, Xiaolin and Fei,
2011). Existing studies have also used the gravity
model to analyze the spatiotemporal distributions of
carbon dioxide (CO
2
)
emissions and energy
consumption (Zhang et al., 2012; Wang and Feng,
2017), urbanization (Fu et al., 2015), energy supply
and demand (Zhang et al., 2012), and trajectory of CO
2
emissions of gravity centers as well as study their
spatial and temporal differences (Song et al., 2015;
Wang and Feng, 2017; Zhang et al., 2012). However,
A Novel Approach of Environment Impact Assessment and Emission Measurement on the Inter-city Transportation in the Greater Bay Area
(GBA) of China using a Modified Gravity Model
687

there have yet to be studies that use the model to
investigate CO
2
emissions among the Guangdong-
Hong Kong-Macau Greater Bay Area (GBA) cities.
2.2 Transportation in Greater Bay
Area
The Great Bay Area has a great potential for
developing a comprehensive delivery network on the
road as they are so near, the distance is not far away.
There are roads to connect the Great Bay Area Cities.
Each city has well infrastructure to fit The Great Bay
Area development. As the city between cities is not
far, using trucks to deliver is the most efficient, it is
cheaper than barge and plane, so they will use trucks
as their major transportation to deliver goods.
However the carbon emissions of trucks are very
high, it will cause serious pollution problems. Hence,
it needs to replace traditional trucks by renewable
energy vehicles. Also there are more truck EVs
developing. It is a great opportunity to change the
traditional trucks to renewable energy vehicles, thus,
to improve the air pollution problem.
Huang, Guo and Xu (2020) issued a study that
aims to develop a new method for examining the
regional integration and the spatial connection that
affect vehicle emission via crowdsourced traffic data
and an emission model because GBA lacks an
effective framework for accurately estimating the
real-time transportation performance. The research
selected the AutoNavimo and OpenStreetMap as
sources to collect detailed traffic conditions of GBA
including vehicle types, time periods, geographical
areas, pollutants, vehicle operating characteristics,
and road types. Next, creates a project-level database
for the data input. Characteristic traffic data from the
directions service and site-specific data (e.g. fuel
information and meteorology conditions) are
imported and stored in this database. The third step
runs the developed model to calculate emission
inventories. The final step is to establish different
strategies to reduce the emission of GBA. The result
found that vehicle energy consumption and emission
have a difference between the expressway and other
urban roads based on the speed . Based on the article,
the project can consider using AutoNavimo and
OpenStreeMap as sources to collect detailed traffic
conditions of GBA cities.
2.3 Development of Hydrogen
Fuel-cell Vehicles in the GBA
The development of the renewable-energy of
hydrogen fuel cell vehicles in Hong Kong and South
China is still in the starting phase; its impact,
particularly on traffic flow and emissions, has yet to
be evaluated. A growing number of studies have
examined carbon emissions in this context, but a
number of research gaps remain. First, previous
studies examined this issue in various geographical
settings at the national (Gambhir et al., 2015),
provincial (Zheng et al., 2015) and city levels (Wang
et al., 2017; Zeng et al., 2016) and in connected
metropolitan areas (Du et al., 2017). However,
research on cities in the GBA is inadequate. Second,
studies at the city level have examined the carbon
emissions of transport services within specific
geographical boundaries, whilst carbon emissions
from intercity road transport flow across city
boundaries have received less research attention.
Third, the potential of hydrogen fuel cells for carbon
emission reduction in GBA cities remains
underexplored, as the adoption of hydrogen-powered
fuel cell vehicles remains in its infant stage. As such,
road transport carbon emissions both within and
between the 11 cities in the GBA and the carbon
emission reduction potential of alternative fuel types,
including a hydrogen fuel cell, will be analysed in this
project. A modified gravity model will be designed
and developed based on theoretical analysis,
considering social, economic and other variables
affecting the CO2 emission of vehicles travelling
within and across cities in the GBA (Zhou et al., 2018;
Anderson, 2011; Jung et al., 2008).
3 METHODOLOGY
3.1 Research Model
In response, the use of the gravity model will be
extended in this study to analyze the crucial
contributors of CO
2
emissions among the GBA cities.
Until recently, this model has been mainly applied to
aggregated data with cross-sectional or time-series
estimation techniques to analyze traffic flow
statistics. Here, the conventional gravity model is
applied to determine the volume of CO
2
emissions in
GBA cities and extended to cover other factors not
considered in previous studies, such as number of
domestic and cross border vehicles, type of energy
source, traffic mix, etc. In addition, the determinants
used are related to road transportation and policies
including qualitative variables (as the dummy
variables). The model will be subjected to a panel
data analysis to investigate the fixed effects over time
for each scenario, thus exploring the changes and
increasing the manipulation of the data quality and
VEHITS 2021 - 7th International Conference on Vehicle Technology and Intelligent Transport Systems
688
quantity which would otherwise not be possible with
the use of cross sectional or time series estimation
alone. The model will be utilized to investigate the
impacts of energy emissions, city-specific social and
political determinants as well as economic indicators
that affect the CO
2
emissions between Hong Kong
and the GBA cities. In studies on traffic flow and
population migration (Anderson, 2011), the gravity
model is regarded as a common method to evaluate
the strength of the flows. The conventional gravity
model is based on Newton's Law of Gravitation and
shown as follows:
where T
ij
is the expected strength of the traffic flow;
P
i
is the quantity of generated traffic; P
j
is the
attracted quantity of traffic; D
ij
is the distance
between different traffic zones; and k is a gravity
constant, which is usually set to 1 (Jung et al., 2008).
The model in this study will include various
factors of the conventional explanatory variables,
such as the distances between the 11 cities, GDP,
population, and factors related to road transport, such
as the number of domestic vehicles, number of cross
boarder vehicles that post the impact to the traffic
flow. A modified gravity model using a hierarchical
factor approach is derived based on the conventional
model by taking the logarithm as follows:
ln (Tj) = α0 + α1ln(GDPi) + α2ln(GDPj) +
α3ln(Li) + α4ln(Lj) + α5ln(Dij)+ α6(TRKij)
+ εij
(1)
where GDPi and GDPj are the gross domestic product
for cities i and j, Li and Lj are the populations of cities
i and j, TRKij represents the number of registered
vehicles of cities i and j. εij is a random error term,
usually taken to be normally distributed. This formula
is applied in the analysis.
In order to analyze the crucial contributors of CO
2
emissions,
a second modified gravity model is
constructed based on the conventional model as
follows with the consideration of other factors on
transportation and energy including the influence
from the type of energy source and traffic mix, that
contribute to CO2 emissions.:
ln (CO
2
ij) = α0 + α1ln(Yi) + α2ln(Yj) +
α3ln(Li) + α4ln(Lj) + α5ln(Dij) + α6(Aij) +
εij
(2)
where CO
2
ij are the CO
2
emissions from GBA city i
to j, Yi and Yj are the income values for cities i and j,
Li and Lj are the populations of cities i and j, and Dij is
the distance between cities i and j. Aij represents the
factors that contribute to CO
2
emissions between the
pairs of cities. Likewise, εij is a random error term.
Model (2) in this study is targeted to include
various factors of conventional explanatory variables,
such as the distance between 5 cities, GDP,
population as well as the factors that are related to
road transport, for example, the number of domestic
and cross border vehicles, type of energy used, traffic
mix, etc., all of which contribute to CO
2
emissions.
On the other hand, Model (1) is an alternative
approach to quantifying the impact of environmental
impact of the cross-border traffic in the GBA region.
Owing to the research work is still in progress, only
Model (1) is used to demonstrate the significance of
our theoretical framework in this study.
3.2 Data Analysis Method
3.2.1 Panel Data Estimation Approach
The data were analyzed by using the panel data
estimation approach with an econometric and
statistical software – EViews, which is designed for
econometric analysis. The findings will demonstrate
the impacts of the crucial elements of CO
2
emissions
on the GBA cities.
A pool cross sectional (PCS) or cross sectional
(CS) ordinary-least-square (OLS) is often applied in
the gravity model. Unfortunately, Cheng and Wall
(2005) showed that these estimation approaches
create biased results. Since there is no heterogeneity
allowed in the error term for standard CS regression
equations, the gravity model overestimates the
results. In order to solve the problem of using OLS,
the panel data estimation method will be utilized to
determine the variables that affect the CO
2
emissions
among the GBA cities over time. As Baltagi (2013)
noted, the advantages of using this method will
increase the volume of informative data in variability
but with less collinearity among the variables.
Moreover, the method will allow for more degrees of
freedom and efficiency.
3.2.2 Data Collection
A panel dataset of 5 cities over the period of 2015 to
2020 is used in this study. Data of CO2 emissions in
China are obtained from the China Emissions
Accounts and Datasets (http://www.ceads.net/),
which can be found and referenced in Shan et al.
(2016). The other explanatory variables will be
collected from the China Statistical Yearbook. The
A Novel Approach of Environment Impact Assessment and Emission Measurement on the Inter-city Transportation in the Greater Bay Area
(GBA) of China using a Modified Gravity Model
689
socioeconomic indexes of 5 cities including the
annual population, GDP (at 2015 constant prices) as
well as other socioeconomic data will be sourced
from the statistical yearbooks, population and GDP
(at 2015 constant prices) time series data of Hong
Kong and Macao respectively, and obtained from the
database of Census and Statistics Department of
Hong Kong and Statistics and Census Service of
Macao. The exchange rates of the Hong Kong dollar
(HKD) and Macao pataca (MOP) to renminbi (RMB)
will be collected from the China Statistics yearbook
and China Foreign Exchange Trade System (CFETS,
2021). Emissions from Hong Kong and Macao will
be collected from the Emissions Database for Global
Atmospheric Research (EDGAR, 2021).
4 ANALYSIS AND DISCUSSION
In order to be able to use the Gravity model, we first
collected the data of two major cities in the GBA in
order to demonstrate the significance of the modified
gravity model in terms of the preliminary assessment
on environmental impact by the cross-border traffic.
We collected data from the Census & Statistics
Department of the Governments in Hong Kong and
Shenzhen between 2003 and 2019, i.e., the period
after China joined the World Trade Organization
(WTO). Data includes traffic flow between the two
places, GDP of the two cities, Population of two
cities, number of registered vehicles of two cities and
the distance between two HK and SHZ.
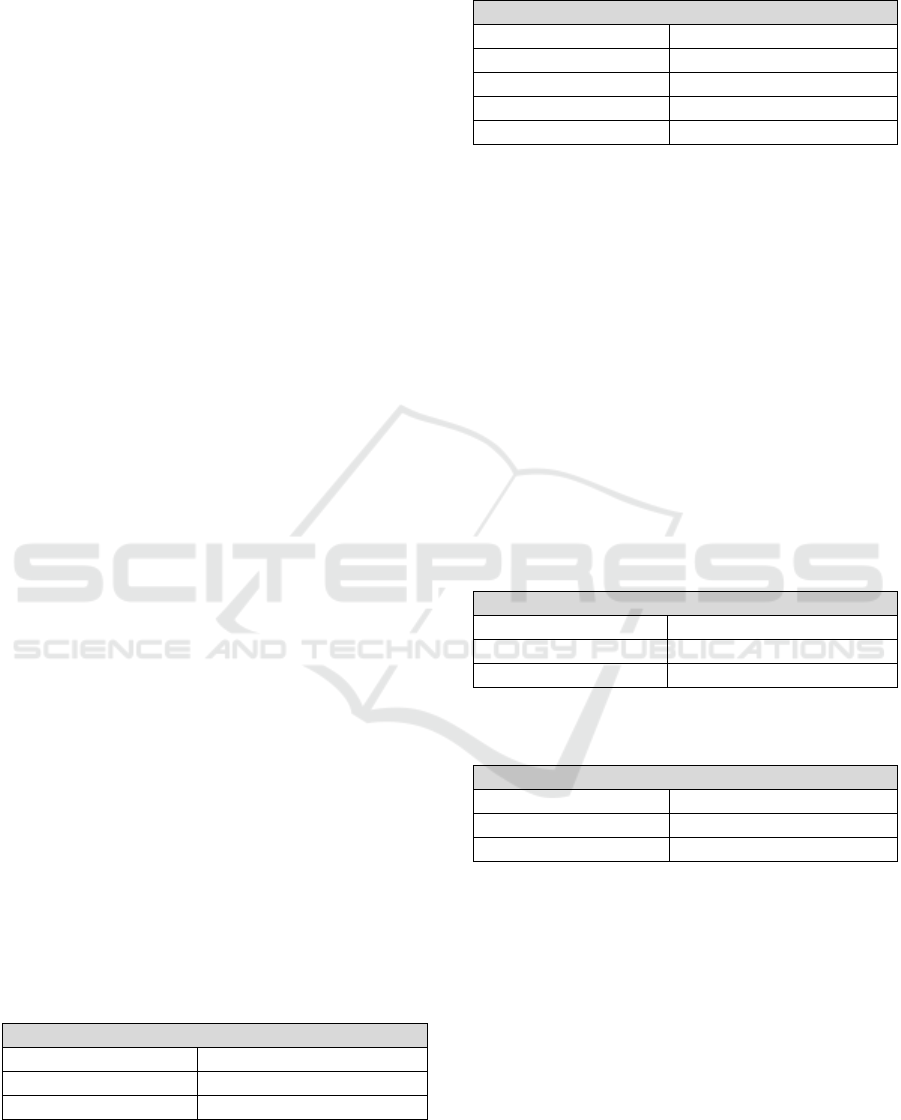
Model 1 was tested with multiple regression
analysis in the SPSS 17.0 software, while the
resulting regression statistics are shown in Table 1,
the regression coefficients of various predictors ae
shown in Table 2. The approach enables the study to
obtain the explanatory power of each independent
variable separately as well as the significance of the
hypothesised relationships for determining the fitness
of the proposed conceptual model through evaluating
the significance of multiple correlation coefficients
and the beta values.
Table 1: Regression statistics of gravity model 1 (first
iteration).
Regression Statistics
R
2
0.858
Adjusted R
2
0.794
p-value 0.000
Table 2: Regression coefficients of gravity model 1 (first
iteration).
Regression Coefficients (Sig.)
GDP SHZ 0.982
GDP HK 0.384
Population SHZ 0.074
Population HK 0.075
Total Vehicles 0.009
The results in Table 1 shows how good the model
explanability is, i.e., model prediction, while Table 2
shows how good the coefficient estimates are, i.e., the
predictability of independent variables (IVs). The
results indicate that the regression model is
significant, but the coefficient estimates of the model
are insignificant except the IV, total vehicles.
According to the results of correlation analysis, the
correlation among the GDPs and other IVs exceeds
0.5 (the correlation between variables is becoming
more significant where the range of values of
correlation coefficient is between 0 and 1 ) which has
a poor multicollinearity. Then, we exclude the GDP
variables and re-run the test and summarized in the
results in Table 3 and Table 4 below.
Table 3: Regression statistics of gravity model 1 (second
iteration).
Regression Statistics
R
2
0.848
Adjusted R
2
0.812
p-value 0.000
Table 4: Regression coefficients of gravity model 1 (second
iteration).
Regression Coefficients (Sig.)
Population SHZ 0.048
Population HK 0.016
Total Vehicles 0.001
The results in Table 3 remains significant, while
the coefficient estimates summarized in Table 4
indicates that the results are significantly improved.
Hence, we obtained the following regression model
based on the results in the second iteration of the test.
In(T
ij
) = (28.589) + (0.3995) In (L
i
) +
(-2.486) In (L
j
) + (0.102) In(TRKi
j
) +
(0) In (D
i
j
)
(3)
We can use the model to forecast traffic flow. With
more time-series based CO
2
emission obtained later on,
we will include the total life cycle emission of each
VEHITS 2021 - 7th International Conference on Vehicle Technology and Intelligent Transport Systems
690

vehicle in Model 2 with the aim to find the total
emission in the further of different types of vehicle.
5 CONCLUSIONS
The modified gravity model is developed in this
regard. The model will analyse the crucial
contributors of CO2 emission among the GBA cities.
Until recently, gravity model has been mainly applied
to aggregated data with cross-sectional or time-series
data estimation techniques to analyse traffic flow
statistics. Here, the novel model is applied to CO2
emissions from GBA cities and extended to cover
other factors not considered in previous studies. In
addition, the determinants which are related to road
transportation and policies including qualitative
variables. The model will be subjected to a panel data
analysis to investigate the fixed effects over time for
each scenario, thus exploring the changes and
increasing the manipulation of the data quality and
quantity which would otherwise not be possible with
the use of cross sectional or time series estimation
alone. The model will be utilized to investigate the
impacts of energy emission, city-specific social and
political determinants as well as economic indicators
that affect the CO
2
emission between Hong Kong and
the GBA cities.
ACKNOWLEDGEMENTS
The work described in this paper was partially
supported by a grant from the Research Grants
Council of the Hong Kong Special Administrative
Region, China (UGC/IDS(C)14/B01/19).
REFERENCES
Alaswad, A., Baroutaji, A., Achour, H., Carton, J., Al
Makky, A., & Olabi, A. G. (2016). Developments in
fuel cell technologies in the transport sector.
International Journal of Hydrogen Energy, 41(37),
16499-16508.
Anderson, J. E. (2011). The gravity model. Annu. Rev.
Econ., 3(1), 133-160.
Baltagi, B. H. (2013). Econometric Analysis of Panel Data,
5th ed., New York: John Wisely and Sons.
Berners-Lee, M. and Clark, D. (2013). The Burning
Questions. Profile Books Ltd., London.
Cano, Z. P., Banham, D., Ye, S., Hintennach, A., Lu, J.,
Fowler, M., & Chen, Z. (2018). Batteries and fuel cells
for emerging electric vehicle markets. Nature Energy,
3(4), 279.
CFETS (2021). China Foreign Exchange Trade System
(Last accessed 9 March 2021:
http://www.chinamoney.com.cn/english/).
Clover, C. (2017) China eyes eventual ban of petrol and
diesel cars. Financial Times. (Last accessed 3 Jan 2018:
https://www.ft.com/content/d3bcc6f2-95f0-11e7-a652-
cde3f882dd7b).
Chan, M.H. E., Chu W.C., Lau Y.Y., Ho C.K.D & Nguyen,
H.O. (2018). What are the opportunities for
manufacturing in the “one belt one road” initiative? The
case of Hong Kong’s textiles and clothing sector,
Journal of Textile Engineering and Fashion
Technology, 4(6):355-360.
Chen, X. L., Zhou, F. (2011). Gravity center change in the
coastal area of the Pearl River Estuary based on GIS
and RS, International Conference on Information and
Management Engineering, Innovative Computing
Information, 281-286.
Cheng, I.H. & Wall, H.J. (2005). Controlling for
Heterogeneity in Gravity Models of Trade and
Integration, Federal Reserve Bank of St. Louis Review,
87(1): 49-63.
Du, K., Xie, C., & Ouyang, X. (2017). A comparison of
carbon dioxide (CO2) emission trends among provinces
in China. Renewable and Sustainable Energy Reviews
73 19-25.
EDGAR (2021). Emissions Database for Global
Atmospheric Research (EDGAR), Joint Research
Centre (JRC) Data Catalogue, European Union (EU).
(Last accessed 10 March 2021:
https://data.jrc.ec.europa.eu/collection/edgar).
Environment Bureau (2017). Hong Kong’s climate action
plan 2030+. (Last accessed: https://www.enb.gov.
hk/sites/default/files/pdf/ClimateActionPlanEng.pdf).
Fu, X., Shen, Y., Dong, R., Deng, H., & Wu, G. (2015).
Analysis of urbanization based on center-of-gravity
movement and characteristics in Songhua River basin
of China and its southern source sub-basin between
1990 and 2010. China Geographical Science, 26, 117-
128.
Gambhir, A., Tse, L.K.C., Tong, D. & Martinez-Botas, R.
(2015). Reducing China’s road transport sector CO2
emissions to 2050: Technologies, costs and
decomposition analysis. Applied Energy 2015 157 905-
917.
Graham, T.W., Tsang, C.-W., Chen, X., Guo, R., Jia, W.,
Lu, S.M., Sui-Seng, C., Ewart, C.B., Lough, A.,
Amoroso, D. et al. (2010). Catalytic solvolysis of
ammonia borane. Angewandte Chemie International
Edition [Engl], 49(46), 8708-8711.
Hilgard, J. (1872). The advance of population in the United
States. Scribner’s Monthly Magazine, 4, 214-218.
International Energy Agency (IEA). (2012) CO2 Emissions
from fuel combustion. Highlights. OECD/IEA 2012.
International Energy Agency (IEA). (2017) CO2 Emissions
from Fuel Combustion 2017. OECD/IEA 2017.
A Novel Approach of Environment Impact Assessment and Emission Measurement on the Inter-city Transportation in the Greater Bay Area
(GBA) of China using a Modified Gravity Model
691

Jung, W.S., Wang F., & Stanley, H.E. (2008). Gravity
model in the Korean highway. Europhysics Letters,
81(4), 6.
Karemera, D., Oguledo, V.L., & Davis, B. (2000). A
gravity model analysis of international migration to
North America. Applied Economic, 32(13), 1745-1755.
Kandogan, Y. (2014). Globalization and shifting economic
centers of gravity. Thunderbird International Business
Review, 56, 261-271.
Kumler, M.P., & Goodchild, M.F. (1992). The population
center of Canada-just north of Toronto. Geographical
Snapshots of North America, Guilford, New York, 275-
279.
Lam, C. (2018) The Chief Executive’s 2018 policy address
– striving ahead rekindling hope. Office of the Chief
Executive, The Hong Kong Special Administrative
Region of the People’s Republic of China.
Lewer, J.J., & Van den Berg, H. (2008). A gravity model of
immigration. Economic Letter, 99(1), 164-167.
McKinnon, A. (Ed.). (2018). Decarbonizing logistics:
distributing goods in a low carbon world. Kogan Page
Publishers.
National Bureau of Statistics of China (2018). Licensed
vehicle in 2017 (Last accessed in 30 December 2018:
http://data.stats.gov.cn)
Ryall, J. (2018). Hydrogen vehicles benefit from joint
venture. South China Morning Post. (Last accessed on
20 December 2018: https://www.scmp.com/country-
reports/business/topics/japan-business-report-2018/
article/2143438/hydrogen-vehicles-benefit)
Schoentgen, R. (2018). The green hydrogen revolution has
started, and it won't be stopped. World Economic
Forum.
Shan Y., Liu J., Liu Z., Xu X., Shao S., Wang P., et al.
(2016). New provincial CO2 emission inventories in
China based on apparent energy consumption data and
updated emission factors. Applied Energy, 184: 742-
750.
Song, Y., Zhang, M., & Dai, S. (2015). Study on China’s
energy-related CO2 emission at provincial level,
Journal of the International Society for the Prevention
and Mitigation of Natural Hazards, 77, 89-100.
Topel, R. H. (2018, January). Calibrating the social value
of prospective new goods: The case of hydrogen fuel
cell electric vehicles. In AIP Conference Proceedings
(Vol. 1924, No. 1, p. 020010). AIP Publishing.
UNDP. (2017) Accelerating a hydrogen-based future in
South China. UNDO (Last accessed on 20 December
2018: http://www.cn.undp.org/content/china/en/home/
presscenter/articles/2017/09/14/accelerating-a-
hydrogen-based-future-in-south-china.html)
Vaughan, A. (2018) Ban new petrol and diesel cars in 2030,
not 2040, says thinktank. The Guardian. (Last accessed
on 3 January 2018: https://www.theguardian.com/
environment/2018/mar/18/uk-should-bring-2040-petrol-
and-diesel-car-ban-forward-2030-green-alliance)
Wang M., Feng, C. (2017). Decomposition of energy-
related CO2 emission in China: an empirical analysis
based on provincial panel data of three sectors. Applied
Energy, 190, 772-787.
Wang, S., Liu, X., Zhou, C., Hu, J., & Ou, J. (2017).
Examining the impacts of socioeconomic factors, urban
form, and transportation networks on CO
2
emissions in
China’s megacities. Applied Energy, 185, 189-200.
Xiaolin, C., Fei, Z. (2011). Gravity center change in the
coastal area of the Pearl River Estuary based on GIS
and RS. International conference on Informational and
Management Engineering. Springer, 281-286.
Zhao, R., Deutz, P., Neighbour, G. & McGuire, M. (2012).
Carbon Emissions Intensity Ratio: An Indicator for an
Improved Carbon Labelling Scheme. Environmental
Research Letters 7(1):014014.
Zheng, B., Zhang, Q., Borken-Kleefeld, J., Huo, H., Guan,
D., Klimont, Z., ... & He, K. (2015). How will
greenhouse gas emissions from motor vehicles be
constrained in China around 2030? Applied Energy,
156, 230-240.
Zhou, Y., Shan, Y., Liu, G., & Guan, D. (2018). Emissions
and low-carbon development in Guangdong-Hong
Kong-Macao Greater Bay Area cities and their
surroundings. Applied Energy, 228, 1683-1692.
VEHITS 2021 - 7th International Conference on Vehicle Technology and Intelligent Transport Systems
692
