
Success Factors of Business Intelligence and Performance
Dashboards to Improve Performance in Higher Education
Asmaa Abduldaem and Andy Gravell
*
Electronics and Computer Science, Southampton University, Southampton, U.K.
Keywords: Success Factors, Business Intelligence, Performance Dashboards, Performance Measurement, Balanced
Scorecard, Higher Education.
Abstract: The need for more effective communication becomes more important as the size of an organisation increases.
This underlines the importance of using tools like Business Intelligence (BI) and dashboards to monitor and
improve their output, as well as to improve accuracy and efficiency of the data that is available. However,
there is a lack of understanding of applying analytics and strategic insight into analytics in Higher Education
(HE), compared to other sectors such as business, government, and healthcare. In addition, the use of BI and
dashboards in HE has been studied by a small number of papers, which is particularly limited in investigating
the factors to ensure successful application within this context or understanding the metrics that determine
this success. This highlights the importance of understanding successful adoption of such technologies to
improve performance and decision-making processes, particularly within HE institutions. In this paper, we
concentrate on investigating successful adoption of business intelligence and department-related level of
tactical dashboards to support performance measurement and decision-making processes in HE. As the
research area is complex and multidimensional, the triangulation method has been applied to support a rich
set of data and a mixture of a qualitative approach to gather insights into potential factors, and a quantitative
approach to confirm these factors. By adapting the concept of Balanced scorecard to measure the success
factors, we conjecture that it would enhance successful adoption within this sector.
1 INTRODUCTION
The need for more effective communication becomes
more important as the size of an organisation
increases. This underlines the importance of using
tools like dashboards to monitor and improve their
output, as well as to improve accuracy and efficiency
of the data that is available (Koopman et al., 2011).
Since 1970, performance measurement has been
supported with the development of technology
replacing paper-based reports (Vallurupalli and Bose,
2018). Consequently, Decision Support Systems
(DSS) emerged to enhance information access and
recognition of patterns and trends (Vallurupalli and
Bose, 2018). Following this, Executive Information
Systems (EIS) appeared to support top-level
managers and remained widespread until 1990 when
BI systems featured as an umbrella term in response
to the vast growth of data to improve integration,
access and analysis to support performance
*
https://www.ecs.soton.ac.uk/people/gravell
measurement and decision making (Teixeira and
Misaghi, 2013). The term BI emerged at the early of
1990s to be considered as an umbrella of various
decision support applications. BI can be defined as “a
broad category of technologies, applications, and
processes for gathering,
storing, accessing, and
analysing data to help its users make better decisions”
(Wixom and Watson, 2010). However, the BI
definition is believed to be identical to that of
Business analytics (BA), as “the extensive use of
data, statistical and quantitative analysis, explanatory
and predictive models, and fact-based management to
drive decisions and actions” (Arnott and Pervan,
2016).
1.1 BI and Analytics in HE
It is crucial to establish a common language of
analytics in Higher Education (HE) based on what we
mean by analytics, what type of analytics we need,
392
Abduldaem, A. and Gravell, A.
Success Factors of Business Intelligence and Performance Dashboards to Improve Performance in Higher Education.
DOI: 10.5220/0010499503920402
In Proceedings of the 23rd International Conference on Enterprise Information Systems (ICEIS 2021) - Volume 2, pages 392-402
ISBN: 978-989-758-509-8
Copyright
c
2021 by SCITEPRESS – Science and Technology Publications, Lda. All rights reserved

and what technologies are involved, as Van
Barneveld et al. (2012) argue. There are different
types of analytics in HE such as academic analytics,
learning analytics, predictive analytics, and action
analytics. However, there is a lack of understanding
of applying analytics and strategic insight into
analytics in HE, compared to other sectors such as
business, government, and healthcare (Siemens et al.,
2013).
Business Intelligence and Dashboards target three
different levels: strategic, tactical and operational.
Operational dashboards concentrate on tracking and
monitoring the operational process, while tactical
dashboards focus on analysis and departmental
process more than monitoring; and strategic
dashboards converge and monitor the fulfilment of
strategic objectives as summarized in table 1
(Eckerson, 2010).
Table 1: Three different types of dashboards (Eckerson,
2010).
Operational Tactical Strategic
Purpose Operations/
monitoring
Measuring
progress
Strategy
execution
Users Supervisors/
specialists
Managers,
analysts
Executives/
managers
staff
Scope Operational Departmental enterprise
Information Detailed Detailed/
summary
Detailed/
summary
Updates Intra-day Daily/ weekly Monthly/
quarterly
Emphasis Monitoring analysis management
However, one of the main limitations of BI and
dashboards that there is no explicit link to a corporate
strategy (Taylor and Baines, 2012). There is a
misalignment between measures and targets which
might cause failure (Rahman et al., 2017). Further,
several organizations misunderstand how or whether
measures used for the decision-making process are
associated with their goals (Trinkenreich et al., 2017).
Consequently, these measures might not be beneficial
if they are not being trusted by users (Schwendimann
et al., 2017).
1.1 Goal and Content of This Paper
Higher education should advance their approaches of
thinking, doing, evaluating, and demonstrating
impact (Siemens et al., 2013). Universities face high
levels of pressure from different factors such as raised
competition, government constraints, increased
number of students, and increasing demand for
accountability (Taylor and Baines, 2012; Guitart and
Conesa, 2015). Consequently, HE should develop
appropriate techniques to overcome such pressure by
adopting supporting technologies and strategies such
as BI and dashboards. As BI and dashboards are
recognised technologies within business sectors,
demand exists to investigate the efficiency of these
technologies in HE and investigate ways to utilise
such tools. However, applying tools which are widely
utilized within profit sector could be different,
complex and unique at universities because they have
different missions and visions compared to business
(Guitart and Conesa, 2015).
The aim of this paper is to obtain a better
understanding of effective usage of BI and
performance dashboards within the Higher Education
sector (HE), as well as to improve the quality of
decisions and actions to enhance performance. This
aim will be met through the following objectives:
discovering the factors for ensuring adoption of BI
and dashboards is successful, aligning these factors to
be presented based on the framework of the common
approach of the balanced scorecard (BSC), and
confirming the proposed framework. BSC connects
the different levels of the organisations to the
corporate strategy based on four different
perspectives: internal process, financial, customer
and learning and growth (Kaplan and Norton, 1992;
Martinsons, Davison and Tse, 1999).
2 SUCCESS FACTORS
Martinsons, Davison and Tse (1999) developed BSC
to measure and evaluate information systems (IS)
activities based on four perspectives named business
value, user orientation, internal process and future
readiness and generated specific measures for each
dimension. They argue that the new generations of IT
and IS applications cannot be measured based on only
financial indices because they tend to provide wider
range of services. This conceptual framework is
approved by Delone and Mclean to enhance measures
of IS activities (Delone and Mclean, 2003).
They highlighted in their highly cited papers that
input or independent variables are widely addressed
while output or dependent variables need to be
defined appropriately (Delone and Mclean, 2003;
DeLone and McLean, 1992).
DeLone and McLean (1992) conducted a
cumulative study to summarize the factors and
measures that affect Information Systems’ success
between 1981 and 1987. They highlighted that input
or independent variables are widely addressed while
output or dependent variables need to be defined
Success Factors of Business Intelligence and Performance Dashboards to Improve Performance in Higher Education
393

appropriately. Bourne et al. (2000) highlight the
importance of Performance Measurement System
(PMS) implementation and suggest three main
phases: the design of the performance measures, the
implementation of the performance measures, and the
use of the performance measures. Kennerley and
Neely (2002) indicated that measures should be
dynamic, not static, to stay relevant to any potential
changes. Bourne et al. (2002) identified two main
drivers of successful implementation: top
management support and perceived benefits. Further,
the commitment of the operative level and the tool
being appropriate for the organisation’s requirements
are identified as key factors that affect successful
implementation of measurement systems
(Jääskeläinen and Sillanpää, 2013). De Waal (2003)
stated that the use stage is the most important stage to
ensure success of PMS and how it can be affected by
the behavioural factors.
Figure 1: Adapting BSC to generate success factors of BI
and dashboards (Abduldaem, Gravell, 2019).
BSC can facilitate the data analysis process by
designing an appropriate framework of metrics to
enhance input and displayed data, enabling a quality
of output that is aligned with the strategy of the
organisation as illustrated in figure 1 (Abduldaem,
Gravell, 2019). This alignment would be improved by
combining both measurement approaches BSC and
Goal Question Metric (GQM) to generate the
appropriate measures as stated by Becker and
Boostlman (1999). However, we would like to
emphasize that we are mainly concentrating on
investigating the factors of successful adoption of BI
and dashboards in HE by adopting BSC as the main
framework. Integrating the approach of GQM to
generate the appropriate measures will be considered
later as future work.
2.1 The Research Questions
RQ1: How the balanced scorecard (BSC) approach
could be adapted to measure successful adoption of
Business Intelligence and Dashboards (DB) to
support performance measurement and decision
making in higher education?
1.1 What are the financially related factors to ensure
successful adoption of BI and dashboards to
support performance measurement in HE?
1.2 What are the customer related factors to ensure
successful adoption of BI and dashboards to
support performance measurement in HE?
1.3 What are the factors related to learning and
growth perspective to ensure successful
adoption of BI and dashboards to support
performance measurement in HE?
1.4 What are the factors related to internal process
perspective to ensure successful adoption of BI
and dashboards to support performance
measurement in HE?
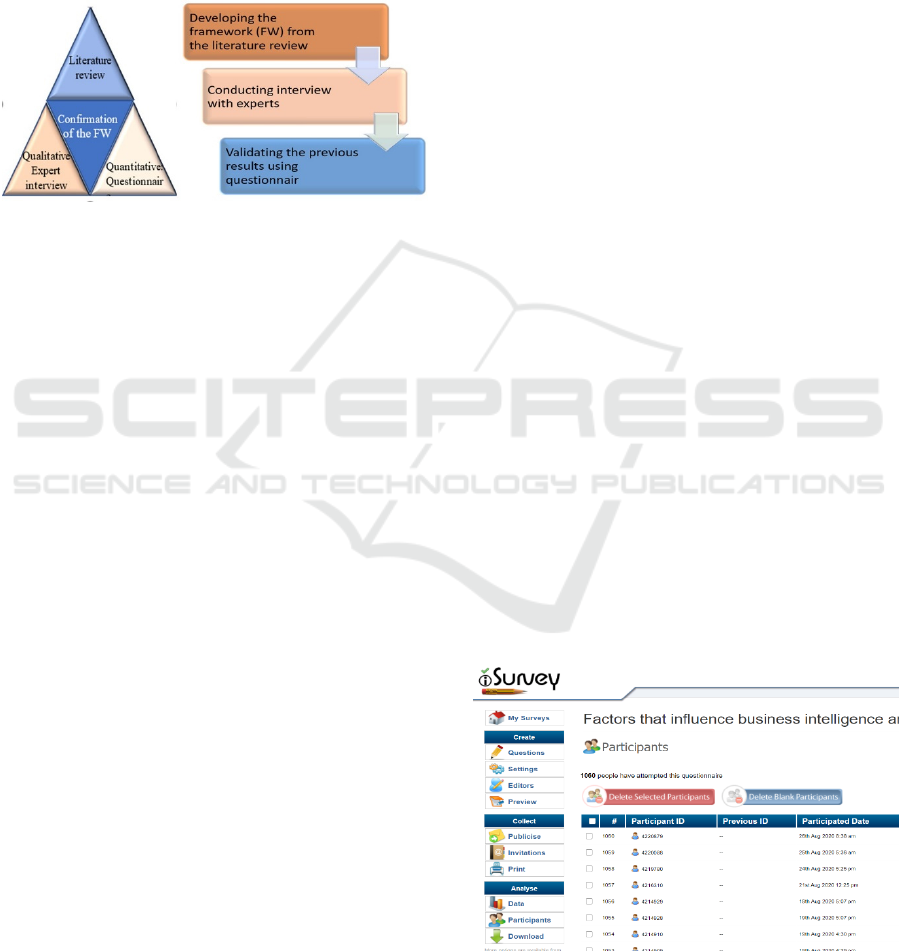
3 METHODOLOGY
Mixed methods research adopts methodologies that
include collecting, analysing, and interpreting
qualitative and quantitative data in a single study,
either simultaneously or sequentially (Leech and
Onwuegbuzie, 2009). One example of this is the
triangulation approach which is applied in this study
to collect data from various resources. The researcher
started by looking at the literature review and
analysing the previously published factors of
different studies and various contexts to generate the
first copy of the proposed framework. This followed
by examining the proposed factors using semi-
structured interviews with 12 experts who are
assortment of decision makers, consultants, and
planning and strategy members within the sector of
higher education to produce the second copy of the
proposed framework. Finally, the questionnaire is
applied to confirm the previously acknowledged
results as it can be seen figure 2.
3.1 Interviews
In order to discover and validate the factors of the
proposed framework related to successful adoption of
BI and dashboards to advocate performance
measurement within HE organisations, this study
conducted semi-structured interviews with 12
experts. The target experts are classified into three
categories: decision makers, strategy and planning
members, and consultants. Strategy and planning
members indicate individuals who work with
strategies related to organisational performance
measurement; and consultants refers to individuals
ICEIS 2021 - 23rd International Conference on Enterprise Information Systems
394
who have been part of the consultation process with
the HE sector. As the study looked to improve the
understanding of, and advocating for, organisational
performance measurement in the HE sector, the
researcher decided to drill down from university-wide
level into faculty-based level because accessibility to
decision makers should be more possible. Therefore,
decision makers were one of the following: head of
school, dean, or vice-dean of a faculty.
Figure 2: Triangulation to validate the proposed FW.
3.1.1 Interview Design
The interview design involved using a semi-
structured approach, including open- and closed-
ended questions. Open-ended questions are designed
to investigate the factors presented in the proposed
framework, whether factors belong to the appropriate
perspective, and if other factors should be included.
Closed-ended questions were designed using a Likert
5-point scale was applied with a response scale from
1 to 5, where 1 equal strongly disagree, then disagree,
neutral, agree, and strongly agree, respectively.
Before conducting interviews, ethical approval was
applied and approved. In qualitative studies, sampling
techniques are non-random, non-probability such as
convenience, and expert sampling which is applied in
this phase (Bhattacherjee, 2012).
In the beginning, the communication with experts
occurred using either email or messages using
‘WhatsApp’ to invite them to participate. When the
invitation is accepted, they receive the following
documents: the consent form, the proposed
framework, and information about the study. Further,
the suitable time, date and the communication method
to conduct the interview are determined.
Most of the interviews were conducted via phone
and a few were conducted face-to-face. Only two of
the interviews were accomplished via email and
messages. They received the interview questions, list
of definitions and wrote down their answers. This was
because of their time limitation. They were informed
at the beginning that the interview was expected to
last for an hour.
3.2 Questionnaire
The questionnaire is designed and published to
accomplish the three main phases of the triangulation
methodology that is applied during this stage of the
study and conducted to confirm the previously
acknowledged results.
3.2.1 Questionnaire Design
The questionnaire includes two main sections. The
first section contains 35 close-ended questions with
answers structured based on Likert scale of the
following options: absolutely essential, very
important, of average importance, of little
importance, not important at all. The second section
consists of open-ended questions to gain an insight of
participants’ opinions and suggestions.
The questionnaire was designed and generated
using iSurvey tool and distributed by contacting
participants throughout their email address which is
stated in their profile or organisation’s web site based
on their role. The emails comprised the participant
information sheet, a brief description of the study, and
a link to access the survey. A reminder was sent to
participants every two or three weeks to remind them
in case they did not complete the survey.
The chosen method of sampling is convenience
sampling technique, and the main aimed participants
are individuals who their major responsibilities
include strategic or operational decisions, beside
people who are taking part in developing or designing
business intelligence systems or dashboards.
However, achieving the required response level was
challenging as there was around a thousand attempts
over more than three months and only 37 participants
at the end completed the survey as it can be seen in
figure 3.
Figure 3: Number of attempts to the questionnaire.
Success Factors of Business Intelligence and Performance Dashboards to Improve Performance in Higher Education
395

I sought to find out a justification to overcome this
obstacle. One suggested reason was the desired time
to submit the questionnaire was too long. However,
this is unlikely to be the situation as the majority
accomplished the survey within 10 minutes. Another
reason could be that participants might decide they
are not suitably qualified to fill in the survey and it
seemed likely to be the reason. This could be because
that the concept of using business intelligence and
dashboards is not clear enough within the sector of
higher education. Since I found the appropriate
people by contacting two of non-profit organisations
that support institutions of higher education and
research with various aspects including business
intelligence, I received more responses and reached
the required number of participants.
4 RESULTS AND DISCUSSION
In this section, the results of the interviews and surveys
experts are presented. As mentioned in the
methodology section, the qualitative data are generated
from semi-structured interviews with 12 experts from
different organisations. The main purposes of the
interviews were to examine and identify the factors of
successful adoption of BI and dashboards to support
performance measurement in HE.
4.1 Results and Discussion of
Interviews
Each perspective included in the framework will now
be reviewed and the findings related to the factors of
these perspectives discussed, to specify which parts
of the framework are confirmed, what modifications
and identifications of factors have been proposed, and
what parts of these modifications and identifications
are approved by the researcher. Further, whether
these factors belong to the specified perspectives, and
what experts think about the proposed framework will
be outlined. In addition, some potential relationships
among different factors will be presented and the
updated framework will be illustrated.
Within the following paragraphs the researcher
presents the confirmed factors and discusses some of
the main points related to these factors.
Regarding vision and strategy, all experts except
one have confirmed all the factors. It is confirmed that
it is essential to have clear vision and strategy within
HE organisations. This emphasizes the importance of
defining and understanding the concepts behind both
expressions ‘vision’ and ‘strategy’. This is assisted by
Expert-06 who had an attempt to define vision as
‘your dreams’. However, this definition could be
ambiguous, as Expert-12 believes that this is the most
difficult thing to be put into meaningful and
measurable words of statement rather than being
dreams. Dreams are more related to fancy, rather than
being applicable. This is because the HE sector is not
used to adopting strategic approaches to deal with
different aspects, as profit organisations do.
Accordingly, goals and objectives should be declared.
Interestingly, goals are described by Expert-06 as ‘the
purpose’ that will be accomplished by defining the
objectives, while Expert-04 defined goals as groups
of KPIs presented using dashboards that illustrate if
these goals are reached or not. This underlines the
significance of this factor, bearing in mind being
doable, as Expert-12 stated. Within this perspective,
all experts agreed that the presented factors belong
appropriately to it.
Here to the internal process perspective, there is
general agreement of the factors. However, there are
some suggested modifications.
Clearly, management support is approved as a
crucial factor to adopt BI successfully. This support
commences by having top management that believes in
data-driven performance measurement and decision
making, otherwise adoption would be challenging and
fail. This is because of the importance of their role in
increasing awareness among employees and following
up with them. Further, empowering them with the
appropriate environment, requirements and solving the
raised problems.
In addition to this factor, management process is
important to ensure clear and well-defined policies.
clear, detailed and well-defined policies are vital, and
policies should be checked frequently. Project
management is another factor that could play a major
role to gain successful adoption. However, there is a
lack in understanding and applying this concept within
HE sectors. It is suggested that specialized people in
project management, including risk management,
proper planning and scoping of projects, feasibility
studies and so on, should be available.
Additionally, effective governance is important to
boost the understanding of various management
positions and the required tasks. It encourages smooth
and flexible execution of projects. the importance of
system quality inclusive of ease of access, capability
and accessibility were confirmed. Moreover, proper
infrastructure and data quality are approved as
essential factors.
In the learning and growth perspective, the
majority of experts confirmed the presented factors,
even though some amendments are proposed.
Obviously, training can save and maintain resources
ICEIS 2021 - 23rd International Conference on Enterprise Information Systems
396

such as time, money and human: which was presented
clearly in the example provided by Expert-2. This is
supported by another example from Expert-08 about
receiving training over four different stages to use the
system. In addition, training would increase
efficiency: firstly, by overcoming the lack of skills to
assist accomplishment of tasks; secondly, to have a
better understanding and support of strategy by all
members in all levels. This emphasises that training
should be provided to members at various levels.
Interestingly, training is seen as a form of
involvement, being part of the process, or
understanding decisions made, which reduces
resistance, as pointed out by Expert-08 and Expert-
09. It is crucial to evaluate the services by collecting
and receiving feedback. This includes understanding
commitment and usage of the system and services
provided, that would improve decisions, measures
and gain new ideas. However, it is stated that
feedback is not applied sufficiently and there is no
clear mechanism towards collecting, receiving or
dealing with feedback.
Interestingly, expert opinions on external support
varied according to their role. Decision makers
believe that, as HE sectors have competencies,
consultation is supposed to be internal rather than
external. For example, Expert-03 does not believe in
external consultation because it is expensive,
prestigious and useless and can be replaced with
internal consultation “consultants are more
prestigious than demanded” and explained “when we
bring a consultant and have a meeting, at the end of
the meeting we find that what we got is nothing extra
than what we already know”. He believes that “They
say or do things that we can do without their
consultation, it is more expensive than being
supportive”. In other examples, Expert-06 and
Expert-12 think that it depends on the organisation
itself. So, if the appropriate consultation could not be
obtained internally, they use an external consultant.
Similarly, planning and strategy members have
similar opinions to decision makers: as Expert-07
says “If the organisation depends on external support,
I do not think you should be there”.
However, Expert-08 pointed out that external
support could help to overcome the ambiguity “There
is lots of ambiguity about quality. So, we ask the
quality department to provide us with people to
support us to have better understanding. So, I think
external support is important”. Further, external
consultation can identify problems that are not
noticed internally and avoid politics and cultural
boundaries “when I provide a consultation for another
organisation, I can avoid courtesy and such social
restrictions and be critical comfortably. Sometimes I
become part of internal consultation but, in this case,
politics play a role regarding my consultation. For
example, I do not want to make the chairman of the
committee unsatisfied and so on. Especially as you
know our culture is based on social aspects” stated
Expert-09. He tried to highlight why consultation
might fail because consultants do not understand their
roles “Consultants sometimes do not understand their
role are they part of making decisions or not? Are they
facilitators to the decisions? Do they have the chance
to approve or disapprove some decisions?
Moving to the customer perspective, User and
stakeholder involvement should improve the belief in
a project and support usage. Further, this involvement
would enhance information accuracy, services and
increase motivation. Involvement should be over all
processes and includes various people such as
instructors, students and stakeholders. Additionally,
satisfaction plays a major role to encourage usage of
the system and indicates usefulness and performance
of the system. However, satisfaction could be affected
by expectations, as per the question raised by Expert-
09 “what the limit of the satisfaction should be?
Should satisfaction be within a specific range: either
partly or fully satisfied for example” and a comment
added by Expert-07 “I need to know user’s
expectations to grow and then reach satisfaction”.
Understanding and managing expectations should
consolidate satisfaction. This would clarify the
misunderstanding in the statement of Expert-12 “I do
not pay that much attention to their expectations as
long as they feel the system is not complicated and
easy to use. The latter is more important for me. I do
not care about their satisfaction about the system”.
4.2 Results and Discussion of the
Survey
Based on the frequency tables, more than half of the
participants believed that the following factors:
Management Process, Governance, Proper
Infrastructure, System Quality, Data Quality and Data
Governance, Change Management, Management
Support, Internal Consultation, Information and
Output Quality Monitoring, Net Benefits, Feedback,
Training, User Involvement, Stakeholder
Involvement, Stakeholder Satisfaction, User
Satisfaction, User Expectations, Stakeholder
Expectations, Budgetary Resources, Financial
Sustainability, Proper Scoping, Return of Investment,
Clear Vision, Define Objectives and Goals are
absolutely essential or very important as it can be seen
in table 2. It summarizes the frequency of the factors
Success Factors of Business Intelligence and Performance Dashboards to Improve Performance in Higher Education
397

Table 2: Frequency table of the factors.
Factors Frequency Percent Valid Percent Cumulative Percent
5 4 3 2 1 T 5 4 3 2 1 T 5 4 3 2 1 T
Management Process
(1)
14, 13, 10, 0, 0, T = 37 37.8, 35.1, 27.0, 0, 0, T
= 100.0
37.8, 35.1, 27.0, 0, 0, T
= 100.0
37.8, 73, 100.0
Management Process
(2)
10, 19, 6, 1, 1, T = 37 27.0, 51.4, 16.2, 2.7,
2.7, T = 100.0
27.0, 51.4, 16.2, 2.7,
2.7, T = 100.0
27.0, 78.4, 94.6,
97.3, 100.0
Project management
office
2, 5, 15, 11, 4, T = 37 5.4, 13.5, 40.5, 29.7,
10.8, T= 100.0
5.4, 13.5, 40.5, 29.7,
10.8, T= 100.0
5.4, 18.9, 59.5, 89.2,
100.0
Governance (1) 14, 20, 3, 0, 0, T = 37 37.8, 54.1, 8.1, 0, 0, T
= 100.0
37.8, 54.1, 8.1, 0, 0, T
= 100.0
37.8, 91.9, 100.0
Governance (2) 8, 19, 9, 1, 0, T = 37 21.6, 51.4, 24.3, 2.7, 0,
T= 100.0
21.6, 51.4, 24.3, 2.7, 0,
T= 100.0
21.6, 73.0, 97.3,
100.0
Proper infrastructure 18, 18, 1, 0, 0, T = 37 48.6, 48.6, 2.7, 0, 0, T
=100.0
48.6, 48.6, 2.7, 0, 0, T
=100.0
48.6, 97.3, 100.0
System quality 16, 18, 3, 0, 0, T = 37 43.2, 48.6, 8.1, 0, 0, T=
100.0
43.2, 48.6, 8.1, 0, 0, T=
100.0
43.2, 91.9, 100.0
Data quality & data
governance
19, 17, 1, 0, 0, T = 37 51.4, 45.9, 2.7, 0, 0, T =
100.0
51.4, 45.9, 2.7, 0, 0, T =
100.0
51.4, 97.3, 100.0
Automation 1, 17, 14, 5, 0, T= 37 2.7, 45.9, 37.8, 13.5, 0,
T= 100.0
2.7, 45.9, 37.8, 13.5, 0,
T= 100.0
2.7, 48.6, 86.5,
100.0
Change management 4, 18, 14, 1, 0, T = 37 10.8, 48.6, 37.8, 2.7, 0,
100.0
10.8, 48.6, 37.8, 2.7, 0,
100.0
10.8, 59.5, 97.3,
100.0
Management support 13, 21, 3, 0, 0, T = 37 35.1, 56.8, 8.1, 0, 0, T =
100.0
35.1, 56.8, 8.1, 0, 0, T =
100.0
35.1, 91.9, 100.0
External consultation 0, 2, 20, 15, 0, T= 37 0, 5.4, 54.1, 40.5, 0, T =
100.0
0, 5.4, 54.1, 40.5, 0, T =
100.0
5.4, 59.5, 100.0
Internal consultation 10, 17, 10, 0, 0, T = 37 27.0, 45.9, 27.0, 0, 0,
100.0
27.0, 45.9, 27.0, 0, 0,
100.0
27.0, 73.0, 100.0
Networking 1, 13, 19, 4, 0, T =37 2.7, 35.1, 51.4, 10.8, 0,
T =100.0
2.7, 35.1, 51.4, 10.8, 0,
T =100.0
2.7, 37.8, 89.2,
100.0
Information & output
quality
13, 20, 4, 0, 0, T = 37 35.1, 54.1, 10.8, 0, 0, T
= 100.0
35.1, 54.1, 10.8, 0, 0, T
= 100.0
35.1, 89.2, 100.0
Monitoring 12, 14, 11, 0, 0, T= 37 32.4, 37.8, 29.7, 0, 0, T
= 100.0
32.4, 37.8, 29.7, 0, 0, T
= 100.0
32.4, 70.3, 100.0
Net benefits (1) 5, 17, 13, 2, 0, T = 37 13.5, 45.9, 35.1, 5.4, 0,
T = 100.0
13.5, 45.9, 35.1, 5.4, 0,
T = 100.0
13.5, 59.5, 94.6,
100.0
Net benefits (2) 7, 19, 10, 1, 0, T = 37 18.9, 51.4, 27.0, 2.7, 0,
T = 100.0
18.9, 51.4, 27.0, 2.7, 0,
T = 100.0
18.9, 70.3, 97.3,
100.0
Feedback 8, 19, 10, 0, 0, T = 37 21.6, 51.4, 27.0, 0, 0, T
= 100.0
21.6, 51.4, 27.0, 0, 0, T
= 100.0
21.6, 73.0, 100.0
Training 13, 20, 2, 2, 0, T = 37 35.1, 54.1, 5.4, 5.4, 0,
T=100.0
35.1, 54.1, 5.4, 5.4, 0,
T=100.0
35.1, 89.2, 94.6,
100.0
User involvement 7,18, 9, 3, 0, T = 37 18.9, 48.6, 24.3, 8.1, 0,
T= 100.0
18.9, 48.6, 24.3, 8.1, 0,
T= 100.0
18.9, 67.6, 91.9,
100.0
Stakeholder
involvement
7, 25, 4, 1, 0, T = 37 18.9, 67.6, 10.8, 2.7, 0,
T = 100.0
18.9, 67.6, 10.8, 2.7, 0,
T = 100.0
18.9, 86.5, 97.3,
100.0
User satisfaction 10, 23, 3, 1, 0, T = 37 27.0, 62.2, 8.1, 2.7, 0, T
= 100.0
27.0, 62.2, 8.1, 2.7, 0, T
= 100.0
27.0, 89.2, 97.3,
100.0
Stakeholder satisfaction 7, 27, 3, 0, 0, T = 37 18.9, 73.0, 8.1, 0, 0, T =
100
18.9, 73.0, 8.1, 0, 0, T =
100
18.9, 91.9, 100.0
User expectations 10, 22, 5, 0, 0, T = 37 27.0, 59.5, 13.5, 0, 0, T
= 100.0
27.0, 59.5, 13.5, 0, 0, T
= 100.0
27.0, 86.5, 100.0
Stakeholder
expectations
11, 18, 8, 0, 0, T = 37 29.7, 48.6, 21.6, 0, 0,
T= 100.0
29.7, 48.6, 21.6, 0, 0,
T= 100.0
29.0, 78.4, 100.0
ICEIS 2021 - 23rd International Conference on Enterprise Information Systems
398

Table 2: Frequency table of the factors (cont.).
Factors Frequency Percent Valid Percent Cumulative Percent
5 4 3 2 1 T 5 4 3 2 1 T 5 4 3 2 1 T
Experience 6, 9, 16, 4, 2, T = 37 16.2, 24.3, 43.2, 10.8,
5.4, T =100
16.2, 24.3, 43.2, 10.8,
5.4, T =100
16.2, 40.5, 83.8,
94.6, 100.0
Technology experience 2, 4, 15, 15, 1, T = 37 5.4, 10.8, 40.5, 40.5,
2.7, T=100
5.4, 10.8, 40.5, 40.5,
2.7, T=100
5.4, 16.2, 56.8, 97.3,
100.0
Budgetary resources 19, 16, 2, 0, 0, T = 37 51.4, 43.2, 5.4, 0, 0, T =
100
51.4, 43.2, 5.4, 0, 0, T =
100
51.4, 94.6, 100.0
Financial sustainability 14, 19, 3, 1, 0, T = 37 37.8, 51.4, 8.1, 2.7, 0,
100.0
37.8, 51.4, 8.1, 2.7, 0,
100.0
37.8, 89.2, 97.3,
100.0
Budgetary resources 19, 16, 2, 0, 0, T = 37 51.4, 43.2, 5.4, 0, 0, T =
100
51.4, 43.2, 5.4, 0, 0, T =
100
51.4, 94.6, 100.0
Financial sustainability 14, 19, 3, 1, 0, T = 37 37.8, 51.4, 8.1, 2.7, 0,
100.0
37.8, 51.4, 8.1, 2.7, 0,
100.0
37.8, 89.2, 97.3,
100.0
Proper scoping 12, 14, 10, 1, 0, T = 37 32.4, 37.8, 27.0, 2.7, 0,
T = 100.0
32.4, 37.8, 27.0, 2.7, 0,
T = 100.0
32.4, 70.3, 97.3,
100.0
Return on investment 10, 17, 8, 2, 0, T= 37 27.0, 45.9, 21.6, 5.4, 0,
T = 100.0
27.0, 45.9, 21.6, 5.4, 0,
T = 100.0
27.0, 73.0, 94.6,
100.0
Clear vision 15, 14, 5, 3, 0, T = 37 40.5, 37.8, 13.5, 8.1, 0,
T = 100.0
40.5, 37.8, 13.5, 8.1, 0,
T = 100.0
40.5, 78.4, 91.9,
100.0
Define objectives &
goals
14, 15, 7, 1, 0, T = 37 37.8, 40.5, 18.9, 2.7, 0,
T = 37
37.8, 40.5, 18.9, 2.7, 0,
T = 37
37.8, 78.4, 97.3,
100.0
Define mission &
values
6, 13, 11, 6, 1, T = 37 16.2, 35.1, 29.7, 16.2,
2.7, T=100
16.2, 35.1, 29.7, 16.2,
2.7, T=100
16.2, 51.4, 81.1,
97.3, 100
based on the previously stated options of the survey
Each number in the table 2 of the fields Frequency,
Percent, Valid percent represent the number of
participants who decided one of the following:
absolutely essential, very important, of average
importance, of little importance, not Important at all
respectively. T represents total.
The questionnaire is analysed using SPSS
software and one tailed t test is adopted to examine
the significance of the proposed factors. The One
Sample T-test is used to analyse the results of the
quantitative data to compare the mean µ of the
population with a hypothesized value µ0 = 3. the
hypotheses for testing each factor are as following:
• H0: If the mean rating of the proposed factor µ < 3,
the factor is not significant.
• H1: If the mean rating of the proposed factor µ >=
3, the factor is significant. The Bonferroni correction
is used to test the significant of the questionnaires’
statements.
Applying the Bonferroni correction means any
observed p-value less than the corrected p-value α/n
= 0.05/35= 0.001 is declared to be statistically
significant. Using SPSS we got table 3 by selecting
analysis using One-Sample T-test, setting the test
value to 3, and confidence interval percentage of
90% because we want to apply one tailed test to put
the entire 5% of our α = 0.05 into each tail of the test.
Almost all the factors are statistically significant
and should be included in the proposed framework.
The average rating of the factors is equal or higher
than the average hypothesized rate which is 3. The t
value of the factors exceeds the critical value CV (36)
= 1.688 and the P value < 0.001, further, the
confidence interval does not across 0.
However, the mean of the following factors:
project management office, external consultation, and
technology experience is 2.73, 2.65, 2.76 frequently
which is less than the hypothesized value, so accept
the H
0
and these factors are not statistically
significant. Further, the P value α = 0.057, 0.001,
0.053 frequently which is not less than the corrected
P value 0.001.
Finally, the results of the following factors:
automation, networking, define mission and values,
and experience illustrate that the means of all these
factors are greater than 3.0 but P value > 0.001 as it
can be seen in table 3. These factors are included in
the framework after analysing the results of the
qualitative part of the previously conducted stage
within the triangulation methodology. As the sample
of the quantitative part (37) larger than the sample of
the qualitative part (12), the researcher decided to
remove these factors from the framework.
Success Factors of Business Intelligence and Performance Dashboards to Improve Performance in Higher Education
399
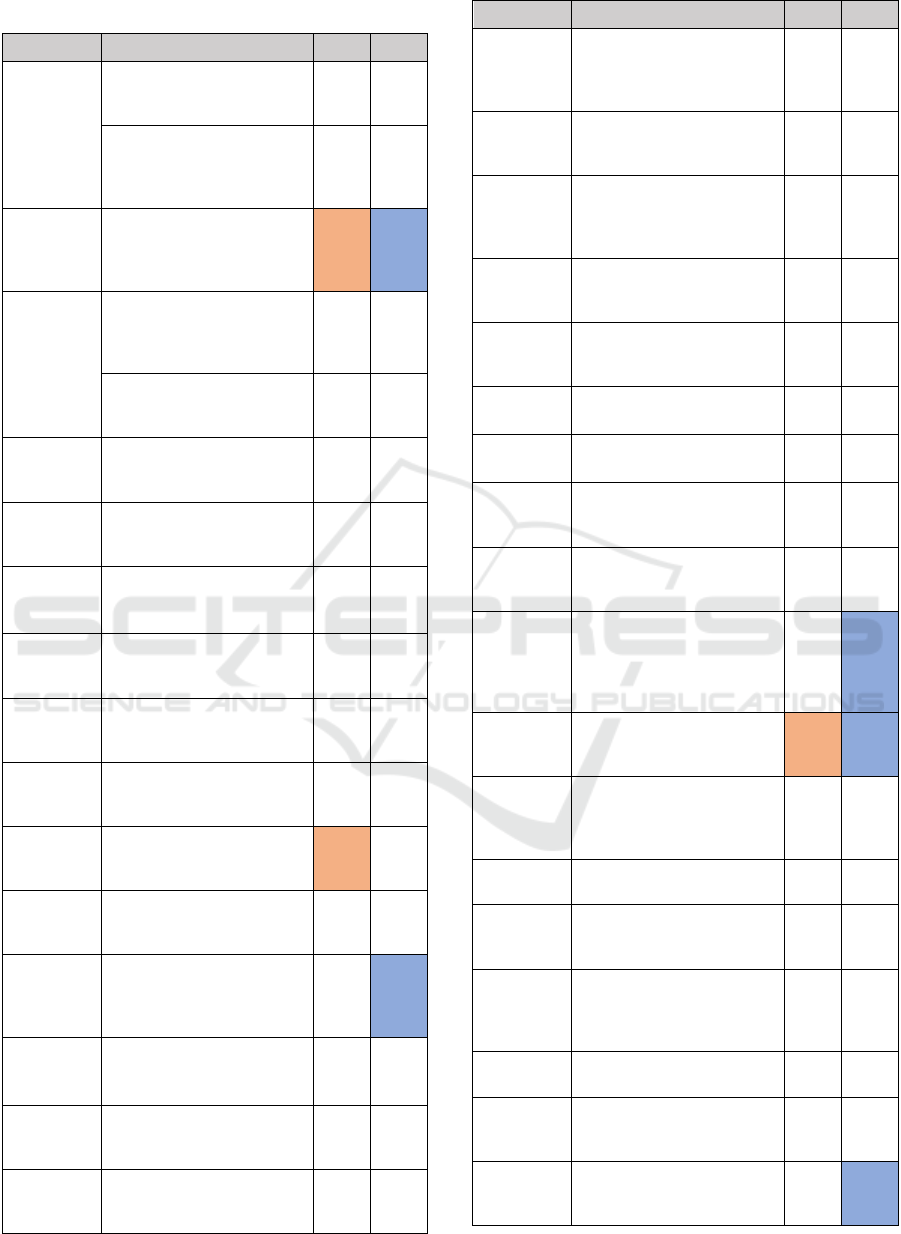
Table 3: T-test results.
Factors Statements Mean P-value
Management
process
How important is it that policies
for system’s implementation are
clear and well-defined?
4.11 <0.001
How important is it to check
processes of the system
frequently? (e.g. processes of
collecting data)
3.97 <0.001
Project
Management
Office
How important is it to have
project management office
(PMO) to launch and control
the system?
2.73 0.057
Governance
How important is it to have
sufficient communication
between different levels of the
organisation?
4.30 <0.001
How important is it that
management roles are clearly
defined and well understood?
3.92 <0.001
Proper
infrastructure
How important is it to have an
appropriate infrastructure
(Hardware, Software, tools)?
4.46 <0.001
System
quality
How important is it that the
system is user friendly and has
good accessibility?
4.35 <0.001
Data quality &
data
governance
How important is it to have
clearly defined and valid data
for the system?
4.49 <0.001
Automation
How important is it to reduce
the need for humans to enter
data?
3.38 0.002
Change
management
How important is it to deal with
people who might resist the
system and refuse to use it?
3.68 <0.001
Management
support
How important is it to make
sure that any problems of the
system are resolved?
4.27 <0.001
External
consultation
How important is it to have
external consultation for the
system?
2.65 0.001
Internal
consultation
How important is it to have
internal consultation for the
system?
4.00 <0.001
Networking
How important is it to have
networking with other
organisations for sharing ideas
and overcoming obstacles?
3.30
0.007
Information
and Output
Quality
How important is it to learn
from the information presented
by the system?
4.24 <0.001
Monitoring
How important is it to monitor
the impact of the applied
decisions?
4.03 <0.001
Net Benefits
How important is it to measure
positive and negative impacts
of the system on users?
3.68 <0.001
Factors Statements Mean P-value
Net Benefits
How important is it to measure
positive and negative impacts
of the system on the
organisation?
3.86 <0.001
Feedback
How important is it to collect
feedback from users to improve
the system?
3.95 <0.001
Training
How important is to do training
to increase the confidence of
users in using or finding value
in the system?
4.19 <0.001
User
Involvement
How important is it to involve
users in all stages of
introducing the system?
3.78 <0.001
Stakeholder
Involvement
How important is it to involve
stakeholders to improve the
system?
4.03 <0.001
Stakeholder
Satisfaction
How important is it to consider
Stakeholder’s satisfaction?
4.11 <0.001
User
Satisfaction
How important is it to consider
user’s satisfaction?
4.14 <0.001
User
Expectations
How important is it to manage
user’s expectations of the
system?
4.14 <0.001
Stakeholder
Expectations
How important is it to manage
stakeholder’s expectations of
the system?
4.08 <0.001
Experience
How important is it that users
need to have different kinds of
experience with the system (e.g.
business planning and
management strategy)?
3.35
0.025
Technology
Experience
How important is it that users
need to have technological
experience?
2.76 0.054
Budgetary
Resources
How important is it to have
adequate
b
udgetary resources to
implement the system
successfully?
4.46 <0.001
Financial
Sustainability
How important is it to ensure
financial sustainability?
4.24 <0.001
Proper
Scoping
How important is it to scope the
system carefully to avoid
wasting resources?
4.00 <0.001
Return of
Investment
How important is it that the
system contribute to the
financial performance of the
university?
3.95 <0.001
Clear Vision
How important is it to have
clear vision for the system?
4.11 <0.001
Define
Objectives
and Goals
How important is it to define
objectives and goals of the
system?
4.14 <0.001
Define
Mission and
Values
How important is it to define
mission and values?
3.46
0.006
ICEIS 2021 - 23rd International Conference on Enterprise Information Systems
400

Regarding the open-ended questions, it is inquired
about any additional comments towards the presented
perspectives in the first question. It was mentioned
that managing expectations of senior management
and involving stakeholders in some stages should be
emphasized. Further, it is suggested that enabling
forecasting forthcoming events would be beneficial.
Communicating potential changes and ensuring
transparency specifically while dealing with data and
data provenance were also highlighted. In addition,
capability of the system to deliver the required
knowledge that can be used by many people for
various purposes was introduced. Finally, it is
suggested that the significance of these factors might
vary based on the maturity level.
The second question investigating participants’
opinion to find out if there are other perspectives
should be considered. It is introduced that the selected
tool should be as decision support system that is
suitable to deliver the required function and enable
easy access. Moreover, the adopted methodology to
apply the system is essential to be taken into
consideration. Additionally, increasing the awareness
of data literacy which could be improved by having
champions to optimize system usage besides change
management was proposed. Having single sources of
data to avoid conflict and mistrust was highlighted
too. Finally, it is mentioned that assigning specific
time to achieve related tasks should be realistic.
5 CONCLUSION
Supporting decision making processes to improve
performance measurement is an essential task within
organisations. The awareness of this importance has
been raised not only by profit organisations but also
non-profits. This correlates with the increase of data
available, which can support organisations with their
decisions. By focusing on performance measurement
and decision making in HE, this study demonstrated
the factors that have an impact on successful adoption
of BI and dashboards through considering them in
alignment with performance measurement strategy.
Whilst other studies have touched upon success
factors, this study emphasise the importance of
alignment to improve the efficiency of using these
technologies. Further, metrics that measure success
should be multidimensional as the study advocates
utilizing the four perspectives of BSC which are
finance, internal process, learning and growth, and
customer in alignment with the factors of success. this
study adopted the sequential triangulation
methodology which commenced by investigating the
literature review to determine, this followed with
collecting qualitative data through interviewing
experts, who were categorized as decision makers,
planning and strategy members, and consultants, to
gain insight that is more comprehensive and consider
different points of views. The main contribution will
be through the data I collect to gain insight to people
within this sector. To thus far, findings indicate that
universities are not yet advanced to adopt BI and
dashboards successfully. Further research will follow
to generate the appropriate metrics, develop
guidelines, and highlight the challenges and
opportunities.
REFERENCES
Abduldaem, A., & Gravell, A. (2019, February). Principles
for the design and development of dashboards:
literature review. In Proceedings of INTCESS 2019-6th
International Conference on Education and Social
Sciences (pp. 4-6).
Arnott, D. and Pervan, G., 2016. A critical analysis of
decision support systems research revisited: the rise of
design science. In Enacting Research Methods in
Information Systems (pp. 43-103). Palgrave
Macmillan, Cham.
Becker, S.A. and Bostelman, M.L., 1999. Aligning strategic
and project measurement systems. IEEE software,
16(3), pp.46-51.
Bhattacherjee, A., 2012. Social science research:
Principles, methods, and practices.
Boosalis, C. N., Pokhrel, B., Myhre, O. & Turner, C.
Creating powerful dashboards and visualizations of
direct and indirect SLOs measures using Google's
Dataset Publishing Language (DPSL) and Google's
Public Data Explorer (GPDE) to advance assessment
practices in institutional research at institutions of
higher education. Future Technologies Conference
(FTC), 2016. IEEE, 1305- 1309.
Bourne, M., Mills, J., Wilcox, M., Neely, A. and Platts, K.,
2000. Designing, implementing and updating
performance measurement systems. International
journal of operations & production management.
Bourne, M., Neely, A., Platts, K. and Mills, J., 2002. The
success and failure of performance measurement
initiatives. International journal of operations &
production management.
Cheowsuwan, T. 2016. The strategic performance
measurements in educational organizations by using
balance scorecard. International Journal of Modern
Education and Computer Science, 8, 17.
De Waal, A.A., 2003. Behavioral factors important for the
successful implementation and use of performance
management systems. Management Decision.
DeLone, W.H. and McLean, E.R., 1992. Information
systems success: The quest for the dependent variable.
Success Factors of Business Intelligence and Performance Dashboards to Improve Performance in Higher Education
401

Information systems research, 3(1), pp.60-95. Delone,
W.H. and McLean, E.R., 2003.
Denwattana, N. & Saengsai, A. A framework of Thailand
higher education dashboard system. Computer Science
and Engineering Conference (ICSEC), 2016
International, 2016. IEEE, 1-6.
Eckerson, W. W., 2010. Performance dashboards:
measuring, monitoring, and managing your business.
John Wiley & Sons.
Guitart, I. and Conesa, J., 2015, September. Analytic
information systems in the context of higher education:
Expectations, reality and trends. In 2015 international
conference on intelligent networking and collaborative
systems (pp. 294-300). IEEE.
Jääskeläinen, A. and Sillanpää, V., 2013. Overcoming
challenges in the implementation of performance
measurement: Case studies in public welfare services.
International Journal of Public Sector Management.
Kaplan, R & Norton, D. 1992. The Balanced Scorecard:
Measures That Drive Performance, Harvard Business
Review.
Koopman, R. J., Kochendorfer, K. M., Moore, J. L., Mehr,
D. R., Wakefield, D. S., Yadamsuren, B., Coberly, J. S.,
Kruse, R. L., Wakefield, B. J. & Belden, J. L. 2011. A
diabetes dashboard and physician efficiency and
accuracy in accessing data needed for high-quality
diabetes care. The Annals of Family Medicine, 9, 398-
405.
Leech, N. L. & Onwuegbuzie, A. J. 2009. A typology of
mixed methods research designs. Quality & quantity,
43, 265-275.
Martinsons, M., Davison, R. and Tse, D., 1999. The
balanced scorecard: a foundation for the strategic
management of information systems. Decision support
systems, 25(1), pp.71-88.
Pauwels, K., Ambler, T., Clark, B. H., Lapointe, P.,
Reibstein, D., Skiera, B., Wierenga, B. & Wiesel, T.
2009. Dashboards as a service: why, what, how, and
what research is needed? Journal of Service Research,
12, 175-189.
Rahman, A. A., Adamu, Y.B. and Harun, P., 2017, July.
Review on dashboard application from managerial
perspective. In 2017 International Conference on
Research and Innovation in Information Systems
(ICRIIS) (pp. 1-5). IEEE.
Schwendimann, B. A., Rodriguez-Triana, M. J., Vozniuk,
A., Prieto, L. P., Boroujeni, M. S., Holzer, A., Gillet, D.
& Dillenbourg, P. 2017. Perceiving learning at a glance:
A systematic literature review of learning dashboard
research. IEEE Transactions on Learning Technologies,
10, 30-41.
Siemens, G., Dawson, S. and Lynch, G., 2013. Improving
the quality and productivity of the higher education
sector. Policy and Strategy for Systems-Level
Deployment of Learning Analytics. Canberra,
Australia: Society for Learning Analytics Research for
the Australian Office for Learning and Teaching.
Taylor, J. and Baines, C., 2012. Performance management
in UK universities: implementing the Balanced
Scorecard. Journal of Higher Education Policy and
Management, 34(2), pp.111-124.
Teixeira, M. R. and Misaghi, M., 2013. Business
Intelligence in an Educational Landscape. DBKDA
2013, p.250
The DeLone and McLean model of information systems
success: a ten-year update. Journal of management
information systems, 19(4), pp.9-30.
Trinkenreich, B., Santos, G., Barcellos, M. P. & Conte, T.
Eliciting strategies for the GQM+ strategies approach
in IT service measurement initiatives. Empirical
Software Engineering and Measurement (ESEM), 2017
ACM/IEEE International Symposium on, 2017. IEEE,
374-383.
Vallurupalli, V. and Bose, I., 2018. Business intelligence
for performance measurement: A case based analysis.
Decision Support Systems, 111, pp.72-85.
Van Barneveld, A., Arnold, K.E. and Campbell, J.P., 2012.
Analytics in higher education: Establishing a common
language. EDUCAUSE learning initiative, 1(1), pp.l-ll.
Wixom, B. and Watson, H., 2010. The BI-based
organization. International Journal of Business
Intelligence Research (IJBIR), 1(1), pp.13-28.
ICEIS 2021 - 23rd International Conference on Enterprise Information Systems
402
