
Detection, Estimation & Tracking Road Objects for Assisting Driving
Afnan Alshkeili, Wenliang Qiu and Bidisha Ghosh
Dept. of Civil, Structural & Environmental Engineering, Trinity College Dublin, Ireland
Keywords:
Multi-object Tracking, Object Detection, Traffic Flow Estimation, Distance Estimation.
Abstract:
The new era of mobility is moving towards automation. Detecting, estimating, and tracking objects from
moving vehicles using dash-cam images in real-time can provide substantial advantages in supporting drivers’
decision making in advance. In this paper, an advanced deep learning-based object detection, distance es-
timation, and tracking framework has been proposed for this purpose. RetinaNet algorithm with ResNeXt
backbone network has been used to detect five traffic object classes, including cars, cyclists, pedestrians,
buses, and motorcycles, with improved accuracy. Additionally, distance estimation algorithm was introduced
to increase both reliability and precession of detection. Moreover, an improved Simple Online and Real-
time Tracking (SORT) algorithm were sequentially used to estimate traffic parameters such as volume and
approach speed of each of these traffic object classes. The algorithm was trained and tested on stock imagery
(COCO2017, MOT16, and TDD) of real-world videos taken from urban arterials with multimodal, signalized
traffic operations.
1 INTRODUCTION
Autonomous vehicles (AV), self-driving cars, or
driverless cars are widely used phrases to describe ve-
hicles capable of sensing the environment and safely
driving with no or little human inputs. These cars
were introduced to reduce driving efforts, especially
on urban roads (Aneesh et al., 2019), and due to their
safety implications. It is estimated that the penetra-
tion rate of AV in traffic fleets can reduce traffic con-
flicts proportionally with over 90% reduction if all ve-
hicles on the road are AVs (Papadoulis et al., 2019).
Concerning AVs, moving object detection, clas-
sification, and tracking algorithms have received ex-
tensive research attention. The object detection al-
gorithms studied in literature considered multiple
objects focusing primarily on pedestrians and road
signs. R-CNN (Bunel et al., 2016) is a common
deep learning algorithm used for object detection.
However, this cannot be implemented for real-time
on road traffic object detection due to high com-
putational complexity. Faster R-CNN (Zhao et al.,
2016) was developed to overcome this. The latest
algorithms, such as Single Shot Multi-Box Detector
(SSD) (Lin et al., 2017a) and You Only Look Once
(YOLO) achieved high efficiency as they overcome
some disadvantages presented in CNN and R-CNN.
Gavrila (Gavrila, 2000) proposed a prototype system
for pedestrian detection from a moving vehicle using
a two-step approach algorithm. Lee et al. (Lee et al.,
2009) developed an object detection algorithm in 3D
cues for detecting pedestrians and vehicles. In 2013,
(Felix Albu, 2013) invented an object detection from
image profiles that is enables enhancing digital im-
ages.
In this paper, a RetinaNet based multi-class ob-
ject detection and tracking framework is proposed to
detect moving objects such as neighboring vehicles,
pedestrians, and other traffic modes. By conduct-
ing vision-based analysis using video footage from
a moving vehicle in an urban signalized road net-
work. Detection based on RetinaNet has been inves-
tigated in the literature concerning autonomous driv-
ing. (Pei et al., 2020) (Aneesh et al., 2019)(Hoang
et al., 2019) used a single-stage detector where Reti-
naNet was applied to form a traffic sign detection net-
work and a CNN-based classifier for road signs, traf-
fic light detection, and sign recognition. RetinaNet
showed an improvement in detection accuracy and
real-time classification operations. These algorithms
have been used for multispectral pedestrian detection
(Rajendran et al., 2019). Moreover, pedestrian detec-
tion has been investigated where (He and Zeng, 2017)
has developed a warning system using Faster R-CNN
that aims to lower traffic accidents.
Our proposed framework detected five different
traffic-related objects (cars, buses, motorcycles, cy-
clists, and pedestrians) simultaneously using Reti-
678
Alshkeili, A., Qiu, W. and Ghosh, B.
Detection, Estimation Tracking Road Objects for Assisting Driving.
DOI: 10.5220/0010496806780685
In Proceedings of the 7th International Conference on Vehicle Technology and Intelligent Transport Systems (VEHITS 2021), pages 678-685
ISBN: 978-989-758-513-5
Copyright
c
2021 by SCITEPRESS – Science and Technology Publications, Lda. All rights reserved
naNet (Xie et al., 2017) having ResNeXt (Xie et al.,
2017) as a backbone. The framework utilized a se-
quential tracking algorithm employing Simple On-
line and Real-time Tracking (SORT) to track all ob-
jects’ classes. Furthermore, the framework estimated
traffic parameters such as traffic volume, speed, and
distance. Estimating these parameters using vision-
based analysis from a moving vehicle by analyzing
video images from a single camera source is a sig-
nificant improvement in assisting driving. Results of
the method were first trained on different datasets and
then tested on single data.
The paper is organized as follows: Section 1 pro-
vides background and points on the associated topic’s
main algorithm. Section 2 covers the methodology
used, and the framework developed. Section 3 high-
lights the data used for this paper. Section 4 an analy-
sis and the results of the application. Finally, section
5 discusses the proposed method’s applications, and a
conclusion of the study is provided.
2 METHODOLOGY
The complete proposed framework for detecting mov-
ing objects from a moving vehicle in an urban trans-
port network is described in this section.The theoreti-
cal background of the different elements of the frame-
work is discussed.
The study focuses on developing methodologies
for detecting, estimating, and tracking the flow, speed,
and distance of pedestrians, cyclists, and other types
of vehicles from an autonomous vehicle utilizing only
visual information. The study utilizes videos captured
from a single dash-cam of a human-driven car in the
absence of access to an autonomous vehicle or ap-
propriate video footage acquired from an autonomous
vehicle.
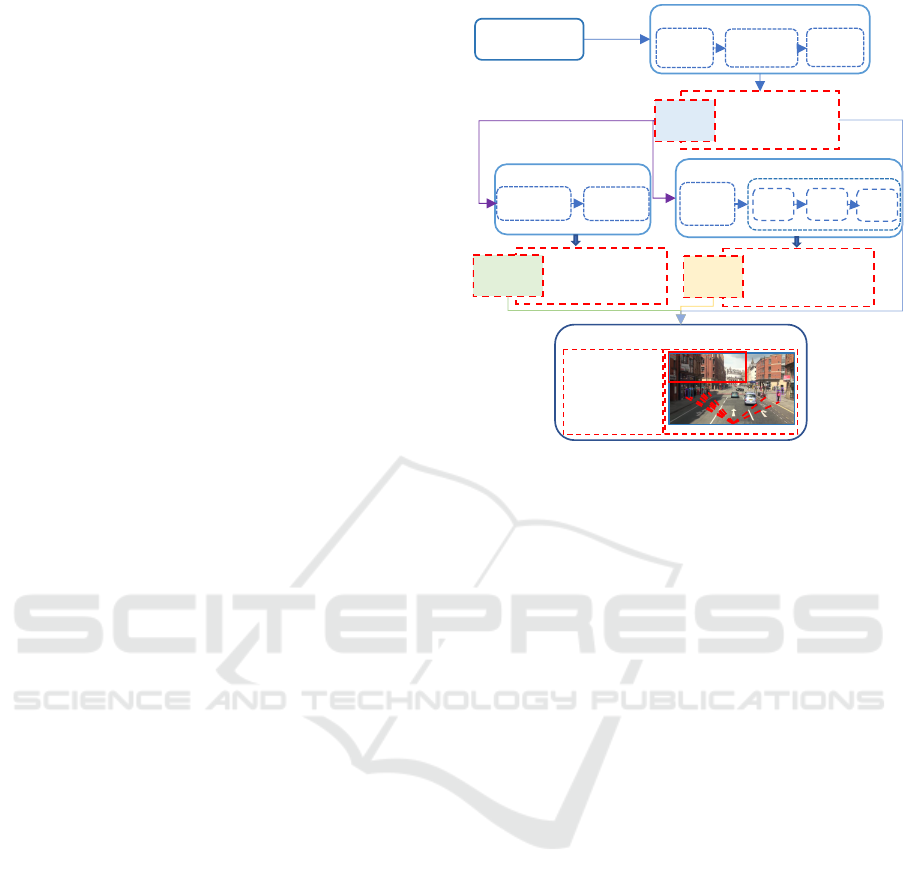
2.1 Framework
The framework module consists of three main mod-
ules: detection, estimation, and tracking. The detec-
tion module consists of a RetinaNet detector, which
contains the ResNeXt backbone network (Xie et al.,
2017), Feature Pyramid Network (FPN) (Welch et al.,
1995), and class/bbox subnets (Lin et al., 2017b)
where it outputs a visual and a numerical results. The
visual results are boundary boxes that show relative
categories, and the numerical result is the confidence
score, which is then fed to the next module. The esti-
mation module, where the algorithm is adopted iden-
tifies the distance, volume, flow rate per second, and
the detected pedestrian’s speed. In this module, the
Input
images/video
Detection (Traffic RatenaNet)
ResNeXt
Feature
Pyramid Net
Class/Bbox
subnet
Detection
Results
Detection per object :
1. Boundary boxes
(bbox)/location
2. Confidence score
3. Object class/category
Detected
Pedestrians
Distance
Estimation
Estimation (Similar triangle based)
Detecti
on
Results
Kalman
Prediction
Object
Association
Update
Tracker
Tracking(Improved SORT)
Estimation
Results
Estimation per object :
Boundary boxes (bbox)/location
Confidence score
Object class/category
Distance
Tracking
Results
Result per object :
ID
Boundary boxes (bbox)/location
Confidence score
Object class/category
• Flow of pedestrian
• Flow of vehicle
• Relative speed of
pedestrian
• Relative speed of
vehicle
• Distance to the front
pedestrian
Numerical
Visual
Output
PersonSpeed:
VehicleSpeed:
Figure 1: Framework of detection, tracking and estimation.
only inputs that will be processed are pedestrians due
to applying an object filter to select the pedestrian
class from the detected results. It will output both
visual and numerical results, a visual with distance
indicated, and flow shown will be displayed and the
estimated volume and flow will be displayed. The
third module is the improved SORT tracking algo-
rithm, which consists of Kalman prediction (Welch
et al., 1995), object association, buffer module for
miss detection, and tracking information update. The
output result from the detection and estimation will be
further tracked. Figure 1 provides schematics of the
whole process.
2.2 Traffic RetinaNet
This study uses a simple dense RetinaNet detector
formed by improving existing single-stage object de-
tection models presented in FPN for object detection
and Focal Loss for Dense Object Detection . To ini-
tialize our network, we started by transfer learning us-
ing a pre-trained model. Thus we can use the weight
and architecture obtain and apply it to our problem
statement. ImageNet dataset is a widely used dataset
to build various architectures since it is large enough
to create a generalized model. The dataset is made of
14,197,122 images, 21841 synsets indexed, and about
500 images per node (Russakovsky et al., 2015a). The
problem statement is to train a model to classify im-
ages into five different categories, as mentioned ear-
lier. The pre-trained model shows a strong ability to
generalize images outside the dataset (ImageNet) by
transfer learning. Fine-tuning is the process in which
Detection, Estimation Tracking Road Objects for Assisting Driving
679
model parameters are precisely adjusted to fit with
certain observations (Gunawan et al., 2011). This was
used on the COCO dataset in order for modifications
to take place to suit our model.
Class
Bounding
Box
ResNeXt Feature Pyramid Net
Class/Bbox subnet
A block of ResNeXt
2x up
1x1 conv
+
A block of lateral
connection
Details of subnet
WxH
x256
WxH
X256
x4
WxH
xK(4)A
• K: # category
• A: # anchor
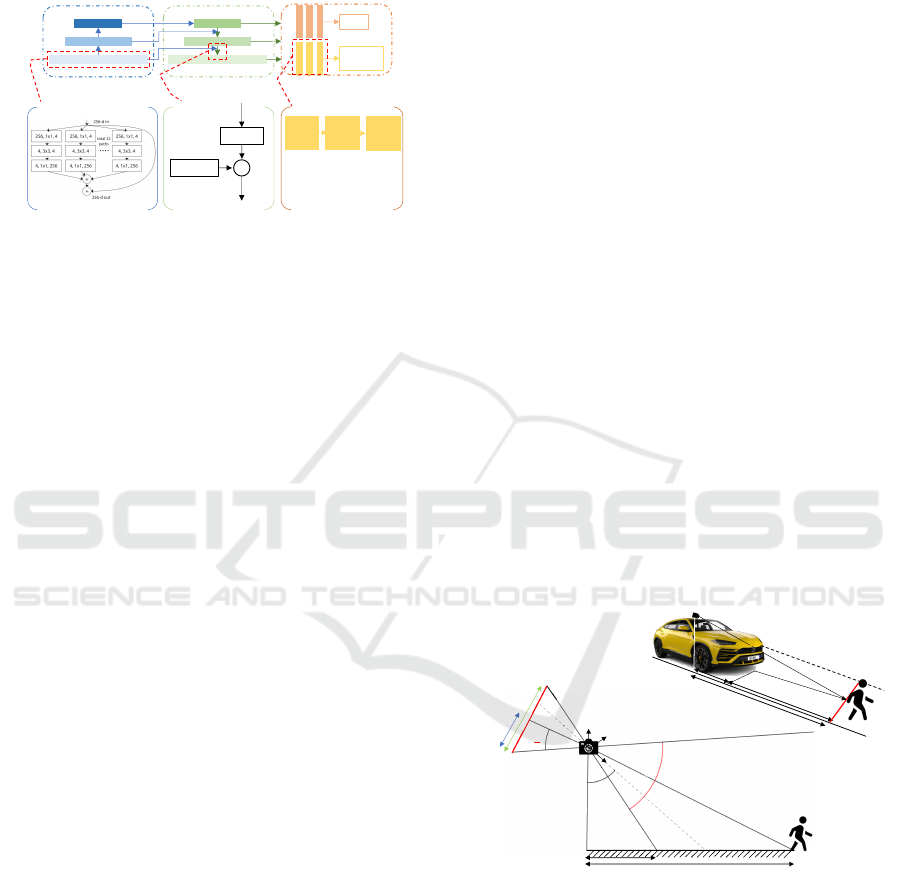
Figure 2: Framework of RetinaNet with ResNeXt backbone
(Traffic RetinaNet).
2.2.1 ResNeXt
In order to achieve more efficient detection, we uti-
lize ResNext (Xie et al., 2017) as the backbone of, as
shown in Figure 2. The initialization product and fine-
tuning output obtained from the previous steps are
now feed into ResNeXt. The network is made of re-
peated building blocks that aggregates through several
transformations with the same topology. ResNeXt
is a homogeneous, multi-branch architecture that has
only a few hyper-parameters to set. As shown in Fig-
ure 2, the input image passes through a set of lower-
dimensional embeddings (by 1×1 convolutions), fol-
lowed by specialized filters (3x3, 5×5, etc.). A block
of ResNeXt with 32 cardinalities with similar com-
plexity in which aggregation of residual transforma-
tion is performed (Xie et al., 2017). The output of
each convolution is then passed to the feature pyra-
mid net.
2.2.2 Feature Pyramid Net
Feature Pyramid Net (FPN) developed is an accurate
in-network feature pyramid that can replace featured
image pyramids without sacrificing representational
power, speed, or memory (Lin et al., 2017a). This
designed network passes the high-level semantic fea-
tures to shallow layers using a lateral connection. In
which each level of the pyramid is detecting objects at
a different scale. Figure 2(top middle) illustrates the
pathway, and Figure 2(bottom middle) shows the lat-
eral connection details. The outputs are then passed
to the last subnet.
2.2.3 Class/Box Subnet
For each pyramid level, a featured network attached
to it. As shown in Figure 2(right), the classification
subnet predicts the object’s present probability at each
position. The box regression subnet in Figure 2(bot-
tom right) regresses each anchor’s offset and matches
it to the nearest ground-truth. Both subnets (object
classification and box regression) though sharing a
common structure, use separate parameters (Lin et al.,
2017b).
2.2.4 Focal Loss
Focal Loss is an improvement on cross-entropy loss
that reduces the relative loss for well-classified exam-
ples and focuses on challenging, misclassified exam-
ples (Lin et al., 2017b). Equations to calculate the
cross-entropy losses were adopted from (Lin et al.,
2017b) where:
FL(p,t) = −α
t
(1 − p
t
)
γ
log(p
t
) (1)
where α is the weighting factor and (1 − p)
γ
is the
modulating factor to the cross-entropy loss, with tun-
able focusing parameter γ ≥ 0.
The proposed RetinaNet with ResNeXt backbone
network is termed as Traffic-RetinaNet (TRN) from
this section onwards. The output obtained from this
algorithm (boundary box that illustrates the location
of the object, configuration score, and the object
class) used as an input for both estimation and track-
ing.
2.3 Distance Estimation
𝛼𝜃
!
H
𝑑
"
𝑍
!
Image Plane
𝑌
!
𝑋
!
DASH CAM
𝛼
2
Object
ℎ
#
Road Surface
H
camera
D
Pedestrian Objec t
d1
d2
d1
d2
(
𝛽
)
𝛽
)
𝛾
)
𝜃
!
𝑓
Figure 3: Distance estimation in 2D image plane.
After detection, a pedestrians object filter is applied,
using a similar triangle-based distance estimation al-
gorithm to estimate the distance of road objects more
accurately. The center point of the bottom line of the
boundary box is considered as the input for this stage.
We performed an experiment in which a dash-
cam was located toward the car rear mirror looking
forward at a height H above the road surface, and
an angle α, the camera was tilted at an angle θ
c
in
XcY cZc coordinates. Supposing the detected object
VEHITS 2021 - 7th International Conference on Vehicle Technology and Intelligent Transport Systems
680
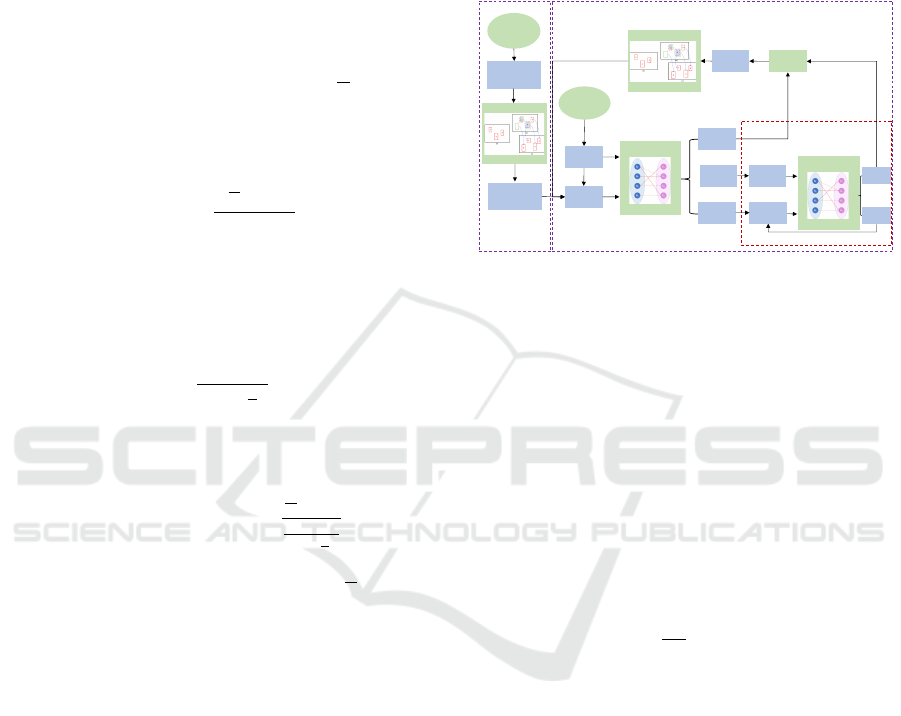
on the road sense, located on an unknown position
(XwY wZw). θ
v
is the angle of the projected ray (from
the camera) pointing to the intersection of the planar
of the detected object with the road surface planar, as
shown in Figure 3 (the top figure). The distance D is
the actual distance between the vehicle and the object
that is equal to d2 − d1 can be calculated using the
following equation (Rezaei et al., 2015):
D = H ∗tan (θ
v
) − H ∗ tan(γ)
= H ∗
h
tan (θ
c
+ β) −tan
θ
c
−
α
2
i
(2)
To compute D we need β as both θ
c
and α are known.
On the other hand, we have (Rezaei et al., 2015):
tan (β) =
h
i
2
− d
p
f
(3)
where h
i
is the hight captured image plane (in pixel),
d p is the distance from the bottom side of the detected
vehicle to the bottom of the image plane (in pixel),
and f is the focal length of the camera. Where (Rezaei
et al., 2015):
f =
h
i
2tan
α
2
(4)
Substituting all the parameters back to evaluate D we
will get the following equation (Rezaei et al., 2015):
D = H ∗
tan
θ
c
+ tan
−1
h
i
2
− d
p
h
i
2tan
(
α
2
)
−tan
θ
c
−
α
2
i
(5)
2.4 Improved Simple Online and
Realtime Tracking (SORT)
Simple Online and Realtime Tracking (SORT) is a
method used for online and real-time tracking. It
tracks multiple objects in a simple, efficient manner.
SORT algorithm combines both Kalman filter (Welch
et al., 1995) and Hungarian (Kuhn, 1955) method thus
to handle motion prediction and the data association
components (Bewley et al., 2016).
Following both detection and estimation, tracking
by detection using visuals only is introduced. The
state of each detected object is modeled as:
x = [u, v, s, r, ˙u, ˙v, ˙s]
T
(6)
where u and v represent the targeted object’s verti-
cal pixel location. The other two variables, s, and r,
correspond to scale (area) and the aspect ratio of the
targeted object bounding box, respectively (Bewley
et al., 2016).
The overlapping of objects in traffic scenes can
result in miss tracking some of these objects. The
original SORT algorithm failed to track those objects.
To solve this issue, we proposed a simple yet power-
ful buffer module is introduced after the unmatched
track-lets, as shown in Figure 4.
Detection
Kalman box predictor
Predictions
Frame 1
Detection
Traffic
RatinaNet
Prediction
of previous
frame
Association
Hungary algorithm
dets trks
Trackers
Prediction
Kalman box predictor
Prediction
Association
Hungary algorithm
dets trks
Buffer
Frame 2 to end
(a)
(b)
Traffic
RatinaNet
Matched
Unmatched
dets
Unmatched
trks
New
Trackers
Keep for k
iters
Matched
Unmatched
Update
Figure 4: Framework of improved SORT.
2.5 Number and Speed Estimation
The number of objects in key classes and their ap-
proach speed are estimated based on the average dif-
ference of location in 5 consecutive frames. The flow
was estimated and computed using the detection re-
sults (boundary box and class), where we considered
only the detected objects of both cyclist and pedestri-
ans class. Speed estimation carried out using tracking,
where objects speed was estimated by computing the
average difference of consecutive frames, as shown in
the following equation (Kumar and Kushwaha, 2016):
S = α
1
mn
∑
D
∑
n
d f (7)
where d is the difference in distance between con-
secutive frames in meter, f is the frame rate in
frames/second, n is the number of tracking object
(pedestrian / vehicle) per frame, m is the frame pair,
and α is a parameter introduced to convert units to
(meters/second).
3 DATASET
In this section, we will highlight the different datasets
used for training and testing purpose. TRN was de-
ployed on Ubuntu16.04 with pyTorch 1.2 environ-
ment. The backbone net was initialized according
to ResNeXt (Hoang et al., 2019) pre-trained on Im-
ageNet (Russakovsky et al., 2015b). The rest of conv
layers except class/bbox subnet are initialized with
Detection, Estimation Tracking Road Objects for Assisting Driving
681

bias, b = 0 and a Gaussian weight with standard devi-
ation, σ = 0.01. For class/bbox subnet, the bias is ini-
tialized as b = −log
10
((1 − τ)τ), where τ = 0.01. We
trained the model with synchronized Stochastic Gra-
dient Descent (SGD) over single GTX2080Ti GPUs
with a total of 2 images per minibatch. The initial
learning rate of 0.0025, weight decay of 0.0001 and
momentum of 0.9 were used. Dataset was splited as
follow 80000 images for training, 40000 for valida-
tion and 20000 for testing.
For estimation distance, we established a Traffic
Distance Dataset (TDD) which was collected using
dash camera, with 30 fps recording rate, a frame di-
mension of 1920 x 1080 pixel, 70
◦
vertical field of
view, camera was located at height H = 155 cm
above road surface and tilled at an angle θ
c
= 88.5
◦
.
Those parameters where used to estimate distance us-
ing Matlab and to compare the obtained values to the
ground truth values. Additionally, for testing pur-
poses, different datasets (COCO data and data col-
lected) are used to test pedestrians and cyclists’ flow
and volume.
We introduced an unsupervised learning method
for tracking, where MOT (Multi-Object Tracking)
dataset is used. We chose this particular dataset be-
cause it consists of the different classes we are inter-
ested in (pedestrians, vehicles, occlusion targets, and
other categories). Improved SORT algorithm is then
tested on the real-time data captured. Analysis and
evaluation of all algorithms introduced and developed
are evaluated and discussed in the next section.
4 ANALYSIS & RESULTS
4.1 Evaluation of TRN
4.1.1 Objective Evaluation of Detection using
TRN
RetinaNet detector can work with different backbone
encoders such as ResNet (He et al., 2016), ResNeXt
(Hoang et al., 2019), and DenseNe (Lin et al., 2017b).
Using ResNeXt as a backboned, we managed to in-
crease the detection’s average precision compared
to the original RetinaNet, which includes a ResNet
backbone (A.Alshkeili et al., 2019). Table 1 show the
results obtained by applying the proposed algorithm
on the COCO2017 dataset.
In this application, small stands for object had a
pixel area of < 32
2
pixels. Medium stands for ob-
jects with an area range of 32
2
< area < 96
2
pixels.
Large stands for objects with an area of 96
2
< area
pixels. The object detection results showed that both
the AP and AR values improved for TRN except in
medium objects. AP and AR were evaluated un-
der IoU (Intersection over Union of boundary boxes)
= 0.5 : 0.05 : 0.95 with AP: MaxDets = 100 (given
100 detection 100 image), AR: MaxDets = 1 (given 1
detection per image).
Table 1 shows the precision and recall for each
category of objects detected. TRN achieves good re-
sults on pedestrians and buses, reasonable for cars
and motorcycles but limited for cyclists. The main
reason for this is the imbalance of training data in
the COCO2017 dataset as it is not designed for this
specific purpose of object detection from moving ve-
hicles. However, due to the lack of an appropri-
ately labeled dataset for evaluating these algorithms,
it was prudent to use a well-known stock video such
as COCO2017.
Table 1: Average percentage and average recall of the dif-
ferent categories.
Detected
objects
Average Precision
All Small Medium Large
Pedestrian 0.513 0.335 0.593 0.689
Cyclist 0.263 0.155 0.322 0.506
Car 0.393 0.301 0.549 0.563
Motorcycle 0.384 0.215 0.34 0.55
Bus 0.595 0.17 0.4 0.763
Detected
objects
Average Recall
All Small Medium Large
Pedestrian 0.185 0.475 0.685 0.776
Cyclist 0.223 0.268 0.5 0.0718
Car 0.172 0.459 0.687 0.756
Motorcycle 0.251 0.338 0.509 0.675
Bus 0.481 0.331 0.649 0.843
4.1.2 Subjective Evaluation of Detection using
TRN
In Figure 5, a chosen set of scenes detecting all ob-
ject types for illustrative purposes. The algorithm
successfully detected different traffic object classes in
the same scene, as shown in the images. TRN suc-
cessfully classifies the different objects from different
angles and distances, which is crucial for analyzing
dash-cam footage from a moving vehicle where the
angles and distance are uncontrollable. The objects
were detected both in shadows and in illuminated ar-
eas of the same scene. Additionally, occlusion effects
were minimized as a large number of bounding boxes
(bbox) were identified in images in multiple objects.
4.1.3 Computational cost of Traffic RetinaNet
It is essential to estimate any traffic object-detection
algorithms’ computational costs to establish whether
real-time detection is plausibility. Floating-point op-
eration per second (FLOPs) is how fast the micropro-
VEHITS 2021 - 7th International Conference on Vehicle Technology and Intelligent Transport Systems
682
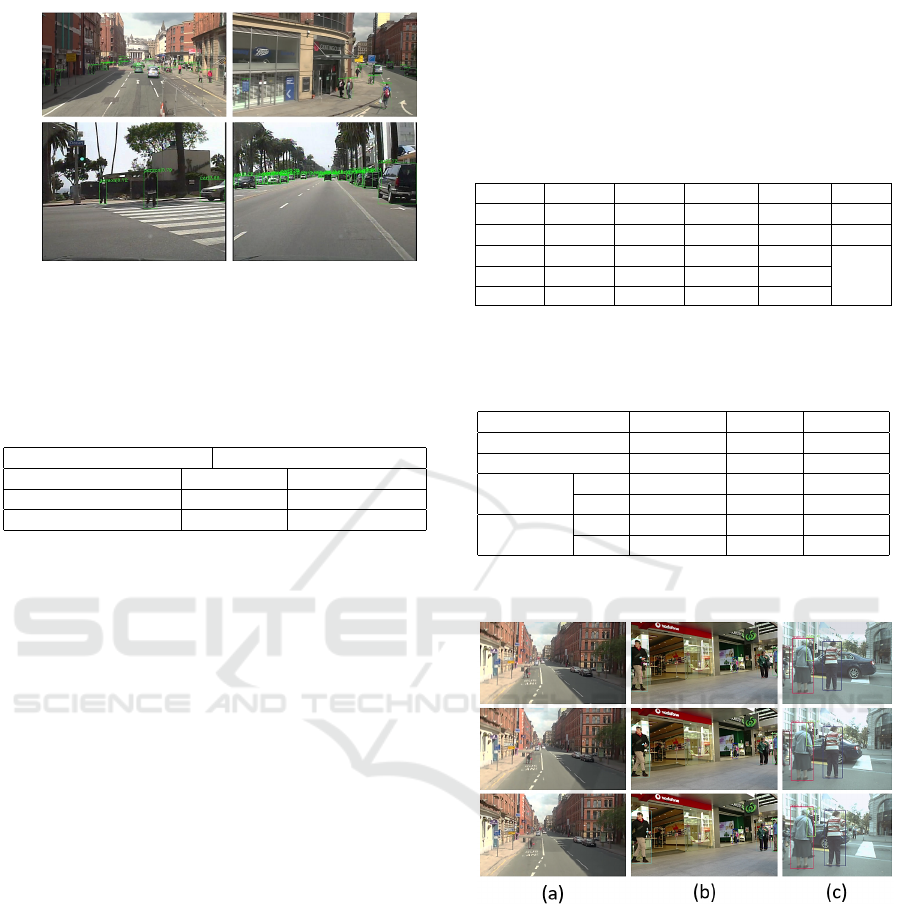
Figure 5: Detection of multiple classes of objects in MOT16
dataset.
cessor operates; it has a performance unit of the mul-
tiplier–accumulator (Mac). Table 2 shows the perfor-
mance parameters and FLOPs of the framework.
Table 2: Computational performance of the framework.
FLOPs:286.83 GigaMAC Parameters: 54.86 Million
Training Testing
Detection using TRN 3 days 18 h 9 Frames/Sec
Tracking - 263 Frames/Sec
The detection is at the rate of 9 fps, which is
slightly slower than a video rate of 30 fps. However,
this rate can be considered real-time for vehicles and
pedestrians in urban signalized roads from a relative
movement point of view. The tracking rate is much
higher than the video rate and is compatible with AV
advanced collision avoidance alarm requirements.
4.2 Evaluation of Tracking
4.2.1 Objective Evaluation of Tracking
In traffic scenes, the object’s scale is changing, so
scale-insensitivity is crucial for the tracker. We chose
SORT as it tracks objects only depending on the IoU
region of objects, robust to object size. Table 3 shows
the results of the improved SORT described earlier.
The specific evaluation indicators used are (Welch
et al., 1995):
• IDF1 : The ratio of correctly identified detections
over the average number of ground-truth and com-
puted detections
• IDP : Identification precision
• IDR : Identification recall
• GT : Total Number
• MT : Number of objects tracked for at least 80
percent of lifespan
• PT : Number of objects tracked between 20 and
80 percent of lifespan
• ML : Number of objects tracked less than 20 per-
cent of lifespan.
• MOTA : Multiple object tracker accuracy.
• MOTP : Multiple object tracker precision.
Table 3: Comparing results of the original SORT to the im-
proved.
IDF1 IDP IDR GT MT
SORT 44.1% 58.2% 35.5% 500 112
Imp 47.1% 56.9% 40.2% 500 118
PT ML MOTA MOTP
SORT 224 164 32.9 73.7
Imp 236 146 39.8 72.8
Additionally, statistical estimation of the videos
used presented in the following Table 4.
Table 4: Statistical Estimation Results of Videos.
Scene (a) (b) (c)
Length (frames) 750 525 837
FPS 25 30 14
Av.
Number
Ped. 14.7 14 8.7
Veh. 9.8 0 0.7
Av.
Speed
Ped. 3.48 m/s 1.7 m/s 1.87 m/s
Veh 12.5 km/h 0 km/h 3 km/h
4.2.2 Subjective Evaluation of Tracking
Figure 6: Tracking results in multiple scenes over three con-
secutive frames.
Figure 6 shows the result of tracking algorithm, where
the distance and robustness of tracking vary between
a) and c); thus, it shows the accuracy of the model.
Figure 7 illustrates the tracking of pedestrians for
illustrative purposes; however, the framework was ca-
pable of tracking vehicles. The variables in the figure
Q
p
, Q
v
, V
p
and V
v
(Q
p
is the number of pedestrian,Q
v
is the number of vehicles, V
p
is the estimated pedes-
trian speed flow and V
v
is the relative estimated speed
flow of vehicle) shows the number of objects tracked
and their average approach speed.
Detection, Estimation Tracking Road Objects for Assisting Driving
683
(a)
(b)
(c)
𝑄
!
: ~ 18
𝑄
"
: ~ 8
𝑄
!
: ~ 10
𝑄
"
: ~ 0
𝑄
!
: ~ 7
𝑄
"
: ~ 2
𝑉
!
: ~ 5.76 𝑚𝑠
#$
𝑉
"
: ~ 16.31 𝑘𝑚ℎ
#$
𝑉
!
: ~ 1.14 𝑚𝑠
#$
𝑉
!
: ~ 2.22 𝑚𝑠
#$
𝑉
"
: ~ 17.57 𝑘𝑚ℎ
#$
Figure 7: Flow and Speed estimation.
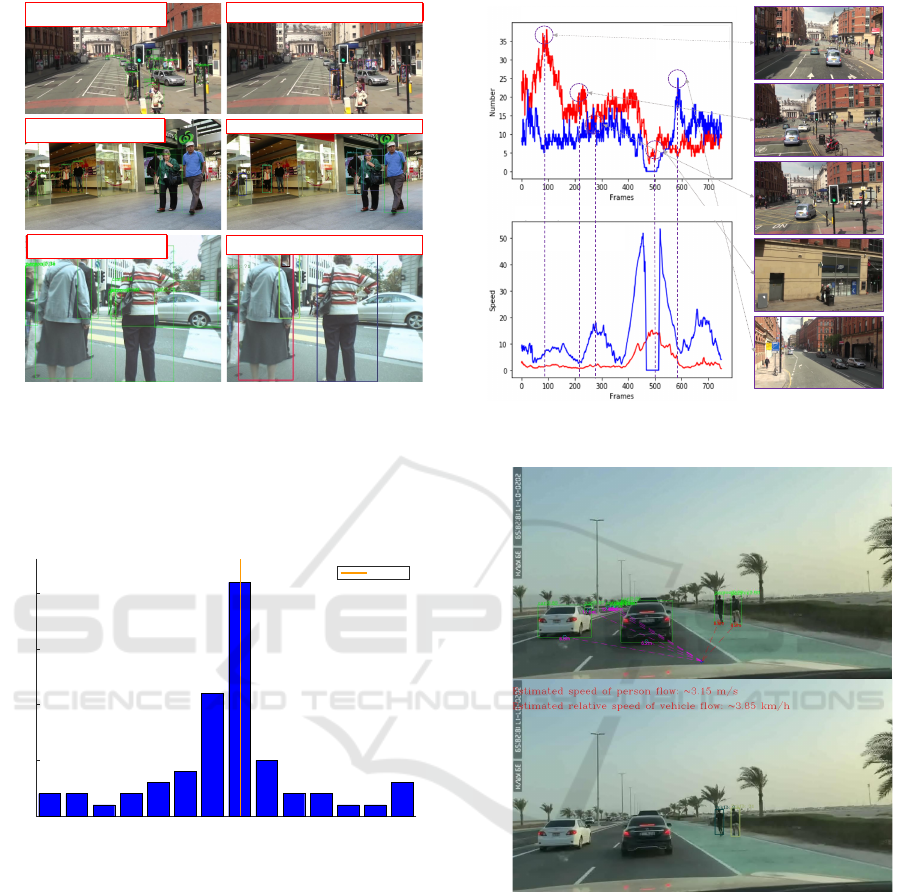
4.3 Distance, Speed and Flow
Estimation
4.3.1 Objective Evaluation
-21.5 -18.4 -15.4 -12.3 -9.3 -6.2 -3.2 0 2.9 6 9.1 12.1 15.2 18.3
0
5
10
15
20
Frequency
Errors (10
-
)
Zero Error
2
Figure 8: Percentage error of distance estimation.
Distance estimation error histogram illustrated in the
following Figure 8 where the distance to vehicle er-
rors, defined by comparing with ground truth repre-
sented by the red line. Objects are at a distance of 2 to
25m to the dash camera. We considered a confidence
interval of ±20cm for ground truth measurement. The
error level lies between ±20%, which is considered a
reasonable percentage in our experiment.
4.3.2 Flow, Speed and Distance Evaluation
Figure 9 shows the flow of pedestrians and vehicles
per frame. The curves’ tendency illustrates the ob-
ject speed Note that there is a gap around frame 480,
as shown in blue curves; no vehicles exist in that pe-
riod. Figure 10 presents an evaluation of the enter
Figure 9: Number and Speed of Pedestrian and Vehicle in
Scene (a).
(a)
(b)
Figure 10: Detection, Tracking and estimation results.
algorithm applied to our data. (a) illustrates the de-
tection and distance estimation results, (b) shows the
both vehicle and pedestrian estimated flow.
5 DISCUSSION & CONCLUSION
This paper proposed a driver assistance framework
based on visual information, including object detec-
tion, tracking, and traffic-related information estima-
tion. Visual information is easier to obtain and ap-
plied to existing vehicles on a large scale than sensor
information. Additionally, visual information is more
VEHITS 2021 - 7th International Conference on Vehicle Technology and Intelligent Transport Systems
684

in line with human perception of traffic. Based on the
above considerations, this paper utilized the ResNeXt
as the backbone net of the original RetinaNet, namely
Traffic RetinaNet, thus enhancing object detection
performance on five different traffic targets. More-
over, it also introduces the Improved SORT algorithm
with a buffer module to enhance multi-object track-
ing’s robustness. Finally, the object’s category, tra-
jectory, and location are used to inference the traffic
flow, relative speed, and distance. The framework’s
performance succeeded in different light conditions,
change of scenes due to the moving frame of refer-
ence, angles and relative distances, and crowded en-
vironments (occlusion). Comprehensive experiments
and detailed analysis via visualization demonstrate
the effectiveness of the proposed driver assistance
framework.
REFERENCES
A.Alshkeili, Ghosh, B., and Qiu, W. (2019). Cyclist and
pedestrian in autonomous vehicles view. In Irish
Transport Research Network (ITRN).
Aneesh, A. N., Shine, L., Pradeep, R., Moore, V. S., and
Lopes, J. (2019). Real-time traffic light detection and
recognition based on deep retinanet for self driving
cars. In 2019 2nd International Conference on Intel-
ligent Computing, Instrumentation and Control Tech-
nologies (ICICICT). ICICICT.
Bewley, A., Ge, Z., Ott, L., Ramos, F., and Upcroft, B.
(2016). Simple online and realtime tracking. In 2016
IEEE International Conference on Image Processing
(ICIP), pages 3464–3468.
Bunel, R., Davoine, F., and Philippe Xu (2016). Detec-
tion of pedestrians at far distance. In 2016 IEEE In-
ternational Conference on Robotics and Automation
(ICRA), pages 2326–2331.
Felix Albu, Larry Murray, P. S. I. R. (2013). Object detec-
tion from image profiles withinsequences of acouired
digital images.
Gavrila, D. M. (2000). Pedestrian detection from a moving
vehicle. In European conference on computer vision,
pages 37–49. Springer.
Gunawan, A., Lau, H. C., and Lindawati (2011). Fine-
tuning algorithm parameters using the design of ex-
periments approach. In Coello, C. A. C., editor,
Learning and Intelligent Optimization, pages 278–
292, Berlin, Heidelberg. Springer Berlin Heidelberg.
He, K., Zhang, X., Ren, S., and Sun, J. (2016). Deep resid-
ual learning for image recognition. In Proceedings of
the IEEE conference on computer vision and pattern
recognition, pages 770–778.
He, X. and Zeng, D. (2017). Real-time pedestrian warn-
ing system on highway using deep learning meth-
ods. In 2017 International Symposium on Intelligent
Signal Processing and Communication Systems (IS-
PACS), pages 701–706. IEEE.
Hoang, T. M., Nguyen, P. H., Truong, N. Q., Lee, Y. W., and
Park, K. R. (2019). Deep retinanet-based detection
and classification of road markings by visible light
camera sensors. Sensors, 19(2):281.
Kuhn, H. W. (1955). The hungarian method for the as-
signment problem. Naval research logistics quarterly,
2(1-2):83–97.
Kumar, T. and Kushwaha, D. S. (2016). An efficient ap-
proach for detection and speed estimation of moving
vehicles. Procedia Computer Science, 89(2016):726–
731.
Lee, P., Chiu, T., Lin, Y., and Hung, Y. (2009). Real-
time pedestrian and vehicle detection in video using
3d cues. In 2009 IEEE International Conference on
Multimedia and Expo, pages 614–617.
Lin, T.-Y., Doll
´
ar, P., Girshick, R., He, K., Hariharan, B.,
and Belongie, S. (2017a). Feature pyramid networks
for object detection. In Proceedings of the IEEE con-
ference on computer vision and pattern recognition,
pages 2117–2125.
Lin, T.-Y., Goyal, P., Girshick, R., He, K., and Doll
´
ar, P.
(2017b). Focal loss for dense object detection. In
Proceedings of the IEEE international conference on
computer vision, pages 2980–2988.
Papadoulis, A., Quddus, M., and Imprialou, M. (2019).
Evaluating the safety impact of connected and au-
tonomous vehicles on motorways. Accident Analysis
& Prevention, 124:12–22.
Pei, D., Jing, M., Liu, H., Sun, F., and Jiang, L. (2020).
A fast retinanet fusion framework for multi-spectral
pedestrian detection. Infrared Physics & Technology,
105:103178.
Rajendran, S. P., Shine, L., Pradeep, R., and Vijayaragha-
van, S. (2019). Fast and accurate traffic sign recogni-
tion for self driving cars using retinanet based detec-
tor. In 2019 International Conference on Communi-
cation and Electronics Systems (ICCES), pages 784–
790.
Rezaei, M., Terauchi, M., and Klette, R. (2015). Robust
vehicle detection and distance estimation under chal-
lenging lighting conditions. IEEE Transactions on In-
telligent Transportation Systems, 16(5):2723–2743.
Russakovsky, O., Deng, J., Su, H., Krause, J., Satheesh, S.,
Ma, S., Huang, Z., Karpathy, A., Khosla, A., Bern-
stein, M., and et al. (2015a). Imagenet large scale vi-
sual recognition challenge. International Journal of
Computer Vision, 115(3):211–252.
Russakovsky, O., Deng, J., Su, H., Krause, J., Satheesh, S.,
Ma, S., Huang, Z., Karpathy, A., Khosla, A., Bern-
stein, M., et al. (2015b). Imagenet large scale visual
recognition challenge. International journal of com-
puter vision, 115(3):211–252.
Welch, G., Bishop, G., et al. (1995). An introduction to the
kalman filter.
Xie, S., Girshick, R., Doll
´
ar, P., Tu, Z., and He, K. (2017).
Aggregated residual transformations for deep neural
networks. In 2017 IEEE Conference on Computer Vi-
sion and Pattern Recognition (CVPR), pages 5987–
5995.
Zhao, X., Li, W., Zhang, Y., Gulliver, T. A., Chang, S., and
Feng, Z. (2016). A faster rcnn-based pedestrian detec-
tion system. In 2016 IEEE 84th Vehicular Technology
Conference (VTC-Fall), pages 1–5.
Detection, Estimation Tracking Road Objects for Assisting Driving
685
