
Preliminary Evaluation of a Survey Checklist in the Context of
Evidence-based Software Engineering Education
Kai Petersen
1,2
and Jefferson Seide Moll
´
eri
3
1
University of Applied Sciences, Flensburg, Germany
2
Blekinge Institute of Technology, Karlskrona, Sweden
3
Simula Metropolitan Centre for Digital Engineering, Oslo, Norway
Keywords:
Checklist, Survey, One-group Quasi-experiment, Students.
Abstract:
Background: In order to judge evidence it is important to be able to assess study quality. Checklists are means
to objectify the assessment. In an earlier study we proposed and evaluated a checklist for surveys, which was
assessed by experts.
Objective: (1) To assess whether the use of the checklist enables students with limited experience in research
to consistently and accurately assess the quality of a research paper. (2) To elicit qualitative feedback to
identify improvements to the checklist.
Method: The students reviewed a survey in a one-group posttest-only quasi-experiment using the checklist.
In total 13 students participated in the context of the course Evidence-based software engineering as part of
the study program Information Systems at Flensburg University of Applied Sciences.
Results: In total the students achieved 74% percent of agreement among each other. However, the Kappa
values indicated mostly a poor level of agreement considering the classification by Fleiss. In addition, the
students were quite inaccurate assessing the questions. Though, they performed well on questions for research
objectives and the identification of population.
Conclusion: Findings indicate that students do not assess reliably. However, further investigations are needed
to substantiate the findings.
1 INTRODUCTION
The role of evidence in software engineering (SE)
practice is described by Dyb
˚
a (Dyb
˚
a et al., 2005).
Practitioners should be aware of how to assess evi-
dence as input for decision making (e.g. when choos-
ing a software engineering methodology). Conse-
quently as future practitioners, students of software
engineering benefit when developing the ability to
conduct empirical research, also to critically analyse
the evidence provided by such studies.
Saddler and Good (Sadler and Good, 2006) have
shown that students in the middle school context are
able to assess assignments consistently when given
concrete and well defined criteria (in their case eval-
uation rubrics). The assessment was highly consis-
tent with the grading of the experts (i.e. teachers).
The findings inspired our study. That is, could we
enable students with little experience in evidence-
based software engineering (EBSE) to consistently
and fairly assess research quality given concrete crite-
ria (in our case an already evaluated checklist with ex-
perts (Moll
´
eri et al., 2020)). A positive answer would
implicate that less experienced persons could be in-
corporated in internal and peer-review processes to
highlight needs for improvements in studies.
In this study we investigate the ability of stu-
dents to consistently and accurately assess the re-
search quality of survey studies given a checklist. The
checklist for survey research has been systematically
constructed and was evaluated using experts (Moll
´
eri
et al., 2020). More specifically, we investigate the fol-
lowing:
• Consistency: measured through inter-rater reli-
ability between the students with regard to the
answers to the questions in the checklist when
evaluating a survey. We analyzed the overall
results (all checklist questions) and whether
specific question categories (e.g. objectives,
instrument design, participant recruitment, etc.)
could be judged more reliably than others.
Petersen, K. and Molléri, J.
Preliminary Evaluation of a Survey Checklist in the Context of Evidence-based Software Engineering Education.
DOI: 10.5220/0010496204370444
In Proceedings of the 16th International Conference on Evaluation of Novel Approaches to Software Engineering (ENASE 2021), pages 437-444
ISBN: 978-989-758-508-1
Copyright
c
2021 by SCITEPRESS – Science and Technology Publications, Lda. All rights reserved
437

• Accuracy: measured through the number of an-
swers matching our gold standard. Here, we also
looked at the performance with respect to individ-
ual questions.
• Reflections and Improvement Suggestions: to the
checklist from the perspective of non-experts. We
looked at weaknesses of the paper that could be
exposed by the checklist, but also checklist ques-
tions that were unclear or hard to assess.
• Reflections on pedagogical implications are pro-
vided in the context of discussing the findings.
Similar to related studies (cf. (Moll
´
eri et al., 2018;
Rainer et al., 2006)), our goal is to explore the pro-
posed survey checklist with respect to consistency and
accuracy from the point of view novice reviewers. To
achieve such a goal, we analyzed the degree to which
students are consistent with assessing a research pa-
per. We also compared the students’ assessments with
a gold standard to learn how accurate their assessment
was.
The remainder of the paper is structured as fol-
lows: Section 2 presents the background and related
works. Section 3 describes the research method. The
results are presented in Section 4. We discuss our
findings in Section 5. Section 6 concludes the paper.
2 BACKGROUND & RELATED
WORK
2.1 A Checklist for Survey Research
Recently, Moll
´
eri et al. proposed a checklist for as-
sessing survey-based research in SE (Moll
´
eri et al.,
2020). The checklist
1
was systematically constructed
grounded in the most relevant guidelines for survey
research in the domain. Furthermore, the checklist
has been evaluated within experts, i.e. research prac-
titioners that conducted SE surveys.
The checklist comprises 38 items divided into 10
categories that outline the survey research process
(see Table 1). Each checklist item is related to one
or more recommended practices for surveys, and the
practices are in turn, related to rationales for carrying
them out. Therefore, researchers applying the check-
list are encourage to reflect on the reasons to adopt the
practices or not.
The evaluation with experts resulted in a set of po-
tential improvements for the checklist in terms of clar-
ification, editorial, and structural changes. In addition
to these, it is vital to validate whether the checklist
1
https://tinyurl.com/se-survey-checklist
Table 1: Checklist Items according to Survey Phases.
Survey Phases Checklist items
1. Research objective 1A - 1C
2. Study plan 2A - 2C
3. Identify population 3A - 3B
4. Sampling plan 4A - 4D
5. Instrument design 5A - 5H
6. Instrument validation 6A - 6D
7. Participant recruitment 7A - 7C
8. Response management 8A - 8B
9. Data analysis 9A - 9E
10. Reporting 10A - 10D
could support novices (i.e. students of EBSE) crit-
ically assess survey studies, and if the potential im-
provements are also beneficial to them.
2.2 EBSE Learning and Critical
Appraisal of Evidence
EBSE aims to integrate evidence from research with
SE practice in order to assess the benefits for adoption
of a new technology or new methodology (Kitchen-
ham et al., 2004; Dyb
˚
a et al., 2005). EBSE is de-
scribed by five steps as follows:
1. Convert a relevant problem or information need
into an answerable question
2. Search the literature for the best available evi-
dence to answer the question
3. Critically appraise the evidence for its validity,
impact and applicability
4. Integrate the appraised evidence with practical ex-
perience and the customer’s values and circum-
stances to make decisions about practice
5. Evaluate performance and seek ways to improve
it
Initiatives supporting EBSE in the educational con-
text has been introduced, e.g. (Jorgensen et al., 2005;
Rainer et al., 2006). In relation to the step 3, SE stu-
dents must develop the ability to appraise the evidence
in scientific literature critically. Checklists have been
suggested to help students in such assessment task
(Rainer et al., 2006; Moll
´
eri et al., 2018). Moll
´
eri
et al. (Moll
´
eri et al., 2018) investigate the use of two
checklists for reviewing experiments and case studies.
ENASE 2021 - 16th International Conference on Evaluation of Novel Approaches to Software Engineering
438

3 METHOD
The method used was a one-group posttest-only
quasi-experiment (Salkind, 2010), which lacks a com-
parison/control group. In this study we only consid-
ered one treatment (the checklist) to evaluate a sur-
vey article. Given that we wanted to assess how
novices with no training in research methods prior to
the EBSE course perform in assessing studies with a
checklist. A potential control-group could have been
to have students assess papers without the guidance of
a checklist. However, given the limited prior knowl-
edge and the limited number of students in the course,
the students were not split into two groups. We also
highlight that even without a control group we could
determine whether the subjects achieve acceptable re-
sults with the checklist.
3.1 Research Objectives and Questions
The research objective is expressed using the GQM
approach as proposed by Basili (Basili, 1992):
• Analyze the proposed survey checklist for the pur-
pose of evaluation
• with respect to consistency and accuracy
• from the point of view of the researcher
• in the context of third-year B.Sc. students review-
ing a survey using the checklist in a course on
EBSE.
Accordingly, we ask the following research questions:
• RQ1: To what degree are the students consistent
in their assessment?
• RQ2: To what degree are the students accurate in
their assessment?
• RQ3: How do students perceive the checklist?
3.2 Preparation and Planning
The preparation and planning comprises of sampling
selection, creation of the research materials, the def-
inition of the studied variables and the hypotheses to
be tested.
Context, Sample Selection and Commitment. The
evaluation took place in the context of the course
EBSE. The course was held in the fourth semester
of the B.SC. program Information Systems at the
Flensburg University of Applied Sciences (Hochshule
Flensburg). The course EBSE is an elective within
the B.Sc. program. The learning outcomes for the
EBSE course are:
• L1: Ability to describe evidence-based ap-
proaches for solving practical problems using sci-
entific methods
• L2: Critical reflection of alternative research
methods used in EBSE
• L3: Ability to plan, conduct and document a study
• L4: Ability to evaluate the practical relevance and
scientific rigor of studies and research results
The students also develop generic abilities such as
critical thinking, information search, problem solv-
ing strategies and analytic skills. The learning ap-
proaches are to attend lectures as an introduction to
different methods (experiments, case studies and ac-
tion research, surveys and systematic literature re-
views), selection and critical appraisal of evidence as
well as documentation of studies. In total five lec-
tures are held. As part of the course a paper review
was included, which was achieved through this quasi-
experiment contributing to learning outcome L4. The
students are also conducting a survey study within the
course and can use the review exercise to improve
their study process based on the paper review.
The link between study participation and learn-
ing outcomes was explicitly communicated to the stu-
dents, as well as the desire to utilize the results in the
publication. The results were anonymized and are not
traceable to specific students.
The students are a homogeneous group which may
be considered novice researchers with limited soft-
ware engineering experience. Only one student had
industry experience. The minority of students (four
of 13) utilized agile software development (the topic
of the survey) in courses at the university, the remain-
ing students never used it before. Nine of 13 students
participated in surveys as subjects before. All the stu-
dents were in the process of designing a survey or an
interview study in the EBSE course.
Research Materials. The research materials com-
prised of the checklist, introduction to the study, sur-
vey reviewed and the data collection form.
• Checklist: We used the checklist for survey stud-
ies in SE (Moll
´
eri et al., 2020)
• Introduction to the study: We introduced the one-
group quasi-experiment using a PowerPoint pre-
sentation. The topics covered were:
– Reviewing: The task and the links to the learn-
ing outcomes
– The rules of the one-group quasi-experiment
(e.g. no discussion in the group)
– Overview of the research material
– Brief introduction to the checklist
– Questions to be answered by the students
• Survey to be reviewed: Stavru (Stavru, 2014) al-
ready assessed a number of surveys and identified
their deficiencies. We conducted an independent
Preliminary Evaluation of a Survey Checklist in the Context of Evidence-based Software Engineering Education
439

evaluation of one study assessed by Stavru to pro-
duce our gold standard. The selected paper is Ro-
driguez et al. (Rodr
´
ıguez et al., 2012). We later
determined that our assessment when creating the
gold standard is aligned with the evaluation by
Stavru.
• Student Characterization: Prior to the evalua-
tion we characterized the experience of the stu-
dents. The student characterization focused on
their experience with software development and
surveys. General experience with software engi-
neering was captured asking for their experience
with programming in courses as well as in indus-
try. We also asked about their experience in agile
software development, which was the topic of the
selected survey paper.
• Data collection form: The checklist itself was in-
cluded in the data collection form, so that the stu-
dents could tick those items that they consider true
for the survey paper (Rodr
´
ıguez et al., 2012). In
addition the students should write down the main
weaknesses of the paper, and highlight which
questions were clear/unclear and which ones were
difficult to judge and why.
Variables. To evaluate consistency (RQ1) we cal-
culated the inter-rater agreement among the students
using percent agreement (McHugh, 2012) for each
questions and question groups (research objectives,
study plan, etc. - see Table 3). We also calculated the
Kappa statistic by Fleiss for multiple raters (Fleiss,
1971).
To evaluate accuracy (RQ2) we constructed a gold
standard (GS) solution where we applied the check-
list to the paper the students evaluated. We compared
the assessment with the one by Stavru to determine
whether the main deficiencies identified for the sur-
vey were also reflected/identified through the check-
list. The grade percentage (GP) was based on the fol-
lowing calculation:
GP =
#correct GS answers − #incorrect GS answers
#total GS answers
(1)
where #correct GS answers are student’s answers to
the checklist questions that match the gold stan-
dard, #incorrect GSanswers are answers that does not
match the gold standard, and #total GS answers are
the number of marked checklist items in the gold stan-
dard. Later, we compared each subjects’ GP to the
grading scheme shown in Table 2.
Finally, the perception of students (RQ3) was ob-
tained via discussion with peers. They reflected upon
three topics: 1) the main weaknesses of the reviewed
paper, 2) unclear questions in the checklist, and 3)
Table 2: Grading scheme.
Grade GP
A 0.9 - 1
B 0.8 - 0.89
C 0.7 - 0.79
D 0.6 - 0.69
E 0.5 - 0.59
F 0 - 0.49
questions particularly hard or easy to judge. The stu-
dents presented their reflection with the researcher
taking notes during their presentations.
3.3 Operation
The evaluation was conducted on the 26th of April
2018. The operation of the one-group quasi-
experiment comprised of the following steps:
1. Introduction (15 minutes) with the content we de-
scribed earlier (see Research materials).
2. Conducting the review (120 minutes) where the
students reviewed the paper using the checklist.
3. Post-test (5 minutes) where the students filled in
the student characterization questionnaire.
On the 3rd of May a follow-up was scheduled with the
students where the results of the evaluation were pre-
sented focusing on the agreement values. Thereafter,
the students discussed difficulties of using the survey
checklist in three groups for a duration of 90 minutes,
each group comprising of four to five students.
3.4 Data Analysis
Descriptive statistics and Kappa values were calcu-
lated. For the calculation the statistical R package irr
2
was used.
3.5 Threats to validity
Construct Validity. A potential bias concerns that
the same researchers that conducted the evaluation
are the creators of the checklist. We try to minimize
such bias by using objective measures: 1) consistency
(inter-rater agreement among the participants), and
2) accuracy (degree of alignment to our gold stan-
dard). Confounding factors could affect our results,
as pointed out in (Moll
´
eri et al., 2018).
Internal Validity. One-group posttest-only design
are is susceptible to threats to internal validity. Two
2
https://cran.r-project.org/web/packages/irr
ENASE 2021 - 16th International Conference on Evaluation of Novel Approaches to Software Engineering
440
Table 3: Inter-rater agreement by checklist category.
Kappa value Classification Classification
Category Agreement value (Fleiss) (Landis and Koch) (Fleiss)
1. Research objective 0.846 0.048 Slight Poor
2. Study plan 0.641 0.016 Slight Poor
3. Identify population 0.846 0.114 Slight Poor
4. Sampling plan 0.692 0.110 Slight Poor
5. Instrument design 0.683 0.183 Slight Poor
6. Instrument validation 0.712 0.065 Slight Poor
7. Participant recruitment 0.846 0.422 Moderate Intermediate to good
8. Response management 0.885 0.562 Moderate Intermediate to good
9. Data Analysis 0.785 0.238 Fair Poor
10. Reporting 0.673 0.088 Slight Poor
Total 0.74 0.27 Slight Poor
major limitations are 1) the lack of a comparison
group, and 2) the dependent variable is measured just
once (Salkind, 2010).
A single paper was used for assessment, given the
limited time in the course and a small number of par-
ticipants. An additional paper would have introduced
a learning effect between reviews as the students be-
come familiar with the checklist. The gold standard
was produced individually by the second author, and
further compared to the evaluation provided by Stavru
(Stavru, 2014). To not bias the results, we selected
one paper form the ones assessed by Stavru.
The student’s answers were anonymized and fur-
ther analyzed by a researcher that did not take part in
the course (i.e., second author). The results have been
aggregated and cannot be traced back to individual
students. The assessment task in our study was not
graded and, thus, does not affect the passing criteria
for the course. All this information was provided to
the students during the introduction.
The students are not native English speakers, al-
though they rated their language proficiency in the
range of good command to excellence command.
They also had limited time to complete the task (120
minutes). To reduce any potential misinterpretation
bias, the teacher was available for questions during
the operation, but not clarification was needed.
External Validity. Our results are not broadly gen-
eralizable. We used a specific paper, and thus the as-
sessment may be dependent on the specific style of
reporting and information provided in the paper. If
a larger group of students were available, we could
employ a combination of papers randomly assigned
among the participants, cf. (Moll
´
eri et al., 2018).
Furthermore, the participants of this study are un-
dergraduate students taking part in an EBSE course.
We cannot assume this sample fairly represents the
population of novice researchers in research/software
engineering. Another evaluation with experienced
practitioners is covered in (Moll
´
eri et al., 2020).
Conclusion Validity. We used multiple measures to
assess the consistency (RQ1) among students (i.e.,
percent agreement as well as inter-rater agreement).
We violated the Fleiss’ Kappa assumption that raters
were chosen at random from a larger population
(Fleiss, 1971). Although kappa statistics can be calcu-
lated for limited sample sizes, it is more likely to pro-
duce lower coefficient values (McHugh, 2012). In or-
der to reduce a potential interpretation bias, we com-
pared the scores by the multiple measures, i.e. per-
centage agreement, Fleiss’ classification, and Landis
and Koch’s classification.
4 RESULTS
4.1 Consistency (RQ1)
The mean percentage of agreement per category is
shown in Table 3. As can be seen the Study plan (2),
Sampling plan (4), Instrument design (5) and Report-
ing (10) have the lowest values.
We also calculated the inter-rater reliability using
the Kappa statistic (Fleiss). The table also shows the
degree of agreement according to the classifications
by Landis and Koch as well as Fleiss. Looking at
the p-values for the Kappa statistic all values are non-
significant (p< α=0.05), i.e. we were not able to re-
Preliminary Evaluation of a Survey Checklist in the Context of Evidence-based Software Engineering Education
441

ject the null-hypotheses associated with Kappa that
the agreement has occurred by chance.
When dividing the agreement value in five equally
large sets and assigning the individual checklist items
(questions) to these groups the following distribution
occurred (see Table 4). The data shows that the ma-
jority of items is within the categories Low and Very
low. As was also visible from the mean agreement
value the categories with most items in the low and
very low category were Study plan, Sampling Plan,
Instrument design and Reporting.
Table 4: Agreement of Checklist Items.
Sets No.
(value range) Items Checklist items
Very high 9 1A, 3A, 5A, 5H, 7C, 8B,
(90 < x ≤ 100) 9D, 9E, 10A
High 5 1B, 2C, 6C, 7A, 8A
(80 < x ≤ 90)
Medium 5 4B, 4D, 6B, 7B, 9A
(70 < x ≤ 80)
Low 11 1C, 3B, 4A, 5D, 5E, 5G,
(60 < x ≤ 70) 6A, 6D, 9B, 9C, 10C
Very low 8 2A, 2B, 4C, 5B, 5C, 5F,
( 50 ≤ x ≤ 60) 10B, 10D
4.2 Accuracy (RQ2)
The grading distribution for the subjects is shown in
Table 5. The table shows that the students did not
achieve fair to good results according to the grading
scheme.
Table 5: Number of subjects per grading scheme.
Grade No. of subjects
A (0.9 - 1) 0
B (0.8 - 0.89) 0
C (0.7 - 0.79) 0
D (0.6 - 0.69) 2
E (0.5 - 0.59) 1
F (0 - 0.49) 10
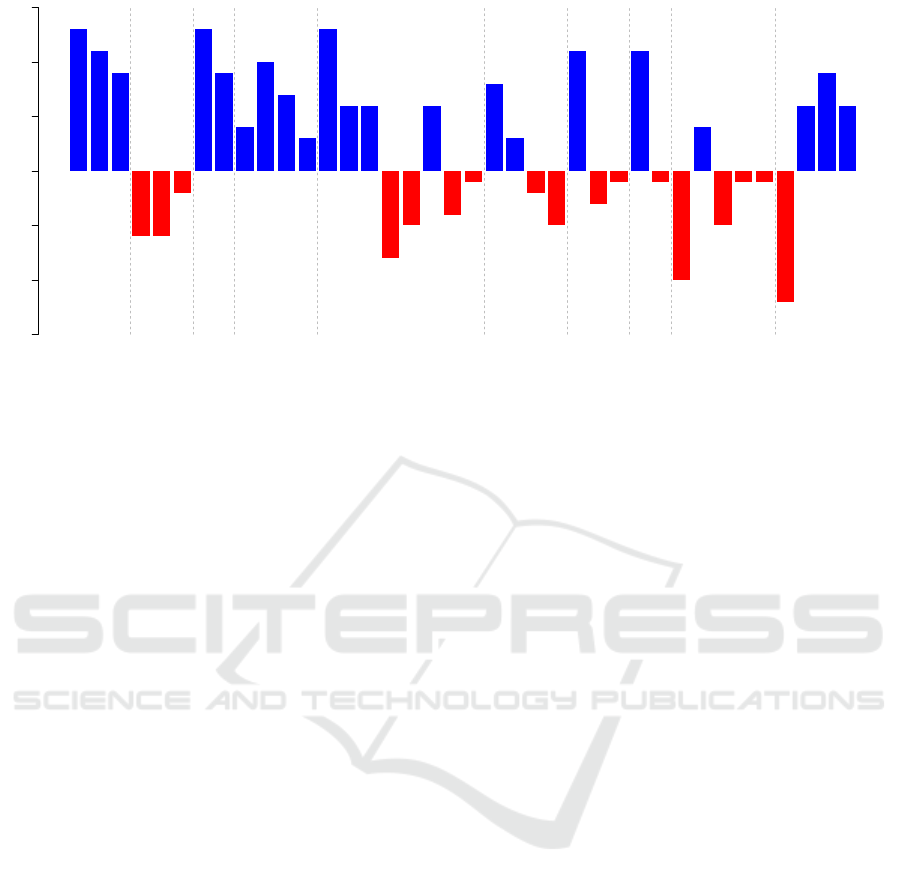
In Figure 1 we show how the aggregated performance
of the 13 subjects per question. The questions within
the categories Research objectives (1A - 1C), Iden-
tify population (3A and 3B), and Sampling plan (4A -
4D) were accurately identified by the majority of the
subjects, resulting in positive scores. In addition, five
questions of the remaining categories (5A, 6A, 7A,
8A and 10C) were identified accurately by the major-
ity of the subjects.
Negative scores were given when the subjects an-
swered questions positively while they were not cov-
ered in the reporting of the paper. Three questions
were standing out as they were answered with yes by
more than half of the subjects, namely 5D, 9A and
10A, even though they should not have been selected.
4.3 Reflections (RQ3)
During the presentations the students were supposed
to answer three questions. The answers to these ques-
tions are shortly summarized here:
What are the main weaknesses of the paper from
the method perspective?
• The questions in the survey were not chosen well.
Though, there was no clear argument relating to
the actual choice of questions.
• In the reporting there were too many tables, which
made it more difficult to read the paper.
• The conclusions were not traceable.
• The blocks for answering interval questions are
not equally large and hence not easy to compare.
• Double entries were present in the data.
Which questions in the survey checklist were unclear,
why?
• Some questions comprised of more than two ques-
tions.
• The question 6B (Is the instrument measuring
what is intended? Are the questionnaire items
mapped to the research question(s)?) was not un-
derstood.
• 10A is not easy to tick and rather requires an ex-
planation/free text answer.
Which questions were easy/hard to judge and why?
• Questions with terms such as clearly (e.g. Data
analysis) lie in the eye of beholder and are not
easy to objectively answer.
5 DISCUSSION
We shortly summarize the main findings and discuss
their implications.
• The subjects achieved an average agreement of
74%; however, the agreement level was low when
looking at the Kappa values (0.27).
• The subjects were rather inaccurate in assessing
the paper with the checklist. However, they were
ENASE 2021 - 16th International Conference on Evaluation of Novel Approaches to Software Engineering
442
1A
1B
1C
2A
2B
2C
3A
3B
4A
4B
4C
4D
5A
5B
5C
5D
5E
5F
5G
5H
6A
6B
6C
6D
7A
7B
7C
8A
8B
9A
9B
9C
9D
9E
10A
10B
10C
10E
−15
−10
−5
0
5
10
15
13
11
9
−6 −6
−2
13
9
4
10
7
3
13
6 6
−8
−5
6
−4
−1
8
3
−2
−5
11
−3
−1
11
−1
−10
4
−5
−1 −1
−12
6
9
6
Figure 1: Performance per question (#sub jects correct GS answers − #sub jects incorrect GS answers).
quite accurate when assessing questions in the cat-
egories Research objectives (1) and Identify pop-
ulation (3).
• The qualitative comments indicate that deficien-
cies (items with many zeros) in the assessment
were not mentioned as the deficiencies, indicat-
ing that the subjects did not link deficiencies with
missing items of the checklist. Combined ques-
tions were considered unclear as the subjects were
not sure how to interpret them. Hence, an option
for partial fulfillment will be used in the subse-
quent evaluation step.
The results appear to suggest that utilizing students as
reviewers of empirical studies (e.g. students assessing
the quality of primary studies of systematic reviews)
based on the checklist would not be reliable given the
low consistency and accuracy achieved. In the evalu-
ation with professionals we assessed the accuracy of
the checklist, which now is applied by experienced
researchers.
5.1 Checklist Evaluation
Our investigation produced conflicting results: low
consistency and accuracy scores (i.e. RQ1 and RQ2)
suggests that the students performed poorly in our
evaluation, but the student’s reflections (RQ3) sug-
gests that the checklist helped them with a compre-
hensive and structured review of the targeted study.
Moreover, accuracy values lower than consistency
values mean a larger divergence between novices and
experts than novices among themselves. That implies
that the assessment of studies using the checklist is
still affected by the reviewers’ experience.
The students pointed out weak points that could
guide further improvements of the checklist. These
needs are different from the ones gathered with the
experts’ evaluation (Moll
´
eri et al., 2020), and they are
likely aligned to the context of the checklist applica-
tion. Thus, suggestions based on the students’ reflec-
tions should improve the usage of the checklist in the
learning of critical assessment of survey research.
5.2 Pedagogical Practice
Our results are in accordance to (Rainer et al., 2006)
and (Moll
´
eri et al., 2020), suggesting that use of the
checklist alone may not be enough to help students. In
order to foster critical thinking, the checklist exercise
should follow a discussion with peers. The discussion
should include a reflection of the checklist and how to
tailor it to an specific objective.
By following the checklist, students are provided
a comprehensive and structured review of the targeted
survey study. Despite limited by a solo paper, stu-
dents’ acknowledged the benefit of the concrete expe-
rience to identify weaknesses in the targeted study. As
students turn into practitioners, we expect them to be
able to critically assess evidence from similar studies
for decision making.
We encourage educators interested in using the
survey checklist to consider the guidelines provided
in (Moll
´
eri et al., 2020) to tailor the checklist ac-
cording to specific objectives. Furthermore, we also
strengthen the importance to evaluate the benefits of
such approach and report the results in a comparable
way. Independent evaluations are vital to evolve and
mature the checklist.
Preliminary Evaluation of a Survey Checklist in the Context of Evidence-based Software Engineering Education
443

6 CONCLUSIONS
We conducted a one-group posttest-only quasi-
experiment with students to evaluate a checklist for
survey studies in SE. Our results show that students’
assessment using the checklist was slightly consis-
tent and poorly accurate than the expert’s assessment.
The students performed better than average regarding
checklist items about participant recruitment and re-
sponse management.
The results suggest that the checklist is not suit-
able as means of assessing studies by a student, but it
still has instructional value. Although using a check-
list alone does not provide a rich pedagogical experi-
ence, a follow-up discussion allowed the students to
reflect on their assessment with peers.
Finally, we encourage the use of checklists tai-
lored to the specific objectives of the evaluation. In
this case, the students’ feedback points out needs for
improvement of the survey checklist aiming at better
use by non-experts.
REFERENCES
Basili, V. R. (1992). Software modeling and measurement:
the goal/question/metric paradigm. Technical report.
Dyb
˚
a, T., Kitchenham, B. A., and Jorgensen, M. (2005).
Evidence-based software engineering for practition-
ers. Software, IEEE, 22(1):58–65.
Fleiss, J. L. (1971). Measuring nominal scale agree-
ment among many raters. Psychological bulletin,
76(5):378.
Jorgensen, M., Dyb
˚
a, T., and Kitchenham, B. (2005).
Teaching evidence-based software engineering to uni-
versity students. In 11th IEEE International Soft-
ware Metrics Symposium (METRICS’05), pages 8–pp.
IEEE.
Kitchenham, B. A., Dyba, T., and Jorgensen, M. (2004).
Evidence-based software engineering. In Proceedings
of the 26th international conference on software engi-
neering, pages 273–281. IEEE Computer Society.
McHugh, M. L. (2012). Interrater reliability: the kappa
statistic. Biochemia medica, 22(3):276–282.
Moll
´
eri, J. S., bin Ali, N., Petersen, K., Minhas, N. M., and
Chatzipetrou, P. (2018). Teaching students critical ap-
praisal of scientific literature using checklists. In Pro-
ceedings of the 3rd European Conference of Software
Engineering Education, pages 8–17. ACM.
Moll
´
eri, J. S., Petersen, K., and Mendes, E. (2020). An
empirically evaluated checklist for surveys in software
engineering. Information and Software Technology,
119:106240.
Rainer, A., Hall, T., and Baddoo, N. (2006). A preliminary
empirical investigation of the use of evidence based
software engineering by under-graduate students. In
Proceedings of the 10th International Conference on
Evaluation and Assessment in Software Engineering,
EASE’06, pages 91–100.
Rodr
´
ıguez, P., Markkula, J., Oivo, M., and Turula, K.
(2012). Survey on agile and lean usage in finnish soft-
ware industry. In 2012 ACM-IEEE International Sym-
posium on Empirical Software Engineering and Mea-
surement, ESEM ’12, Lund, Sweden - September 19 -
20, 2012, pages 139–148.
Sadler, P. M. and Good, E. (2006). The impact of self-and
peer-grading on student learning. Educational assess-
ment, 11(1):1–31.
Salkind, N. J. (2010). Encyclopedia of research design, vol-
ume 1. Sage.
Stavru, S. (2014). A critical examination of recent industrial
surveys on agile method usage. Journal of Systems
and Software, 94:87–97.
ENASE 2021 - 16th International Conference on Evaluation of Novel Approaches to Software Engineering
444
