
Investigating Undergraduate Brazilians Students’ Performance in
STEM Courses
Laci Mary Barbosa Manhães
1a
, Jorge Zavaleta
2b
, Renato Cerceau
3,4 c
,
Raimundo José Macário Costa
5d
and Sergio Manuel Serra da Cruz
5e
1
Departamento de Ciências Exatas, Biológicas e da Terra (PEB), Fluminense Federal University, Estr. João Jasbick s/n,
Santo Antônio de Pádua, Brazil
2
Mathematics Institute (CCMN/NCE), Federal University of Rio de Janeiro, Rio de Janeiro, Brazil
3
Departament of Education & Research, Instituto Nacional de Cardiologia (INC), Rio de Janeiro, Brazil
4
Telehealth Center, Rio de Janeiro State University (UERJ), Rio de Janeiro, Brazil
5
Department of Computer Science, Federal Rural University of Rio de Janeiro, Seropédica, Brazil
Keywords: Data Science, Data Analysis, Educational Data Mining, ENADE, STEM, Tertiary Education.
Abstract: This article presents the characteristics of final year students enrolled in science, technology, engineering, and
mathematics (STEM) degrees in tertiary education in Brazil. Public datasets maintained by National Institute
for Educational Studies and Research Anísio Teixeira (INEP) were essential to promote access to knowledge
we extracted. This paper presents an innovative methodology of analyses about the National Assessment of
Student Achievement (ENADE) datasets; we investigated all the STEM degree courses. The dataset contains
527,058 data about all final year students who performed the exams in 2005, 2008, 2011, 2014, and 2017.
Although the datasets present many attributes, we examined them to compare male and female academic
students’ performances against the mean age and the grades obtained thought the years. We have used the
software R to perform the analysis and discuss the differences between the groups.
1 INTRODUCTION
The U.S. system of graduate education in science,
technology, engineering, and mathematics (STEM)
has argued that STEM teaching and learning
opportunities continuously improve significant
contributions to the growth of the U.S. economy, its
national security, and the health and well-being of its
people (National Academies of Sciences,
Engineering, and Medicine, 2018).
Like the USA, Brazil also must increase
investments and concentrate efforts to increase the
number of students and decrease the dropout rates of
STEM tertiary degrees. Besides that, the country must
support STEM teachers, encourage students to
engage in STEM fields, and increase students from
underrepresented groups in STEM degrees.
a
https://orcid.org/0000-0002-0605-3117
b
https://orcid.org/0000-0002-4747-8613
c
https://orcid.org/0000-0003-3953-4715
d
https://orcid.org/0000-0002-1115-633X
e
https://orcid.org/0000-0002-0792-8157
In this research, we analysed official datasets
produced by the Brazilian Education System, which
is somewhat complex and dependent upon various
policy and administrative levels but generates large
amounts of semi-structured data every year.
The National Institute for Educational Studies and
Research Anísio Teixeira (INEP) is a Brazilian
Federal research agency coordinated by the Ministry
of Education (MEC) that gathers and maintains data
and detailed information about all public and private
educational institutions, ranging from primary
education to higher education (INEP, 2020). Briefly,
the INEP site and its datasets constitute a snapshot of
the Brazilian educational scenario (INEP, 2021).
INEP is in charge of organizing and applying the
Brazilian National Assessment of Student
Achievement (ENADE), which is the annual exam
122
Manhães, L., Zavaleta, J., Cerceau, R., Costa, R. and Serra da Cruz, S.
Investigating Undergraduate Brazilians Students’ Performance in STEM Courses.
DOI: 10.5220/0010495201220130
In Proceedings of the 13th International Conference on Computer Supported Education (CSEDU 2021) - Volume 2, pages 122-130
ISBN: 978-989-758-502-9
Copyright
c
2021 by SCITEPRESS – Science and Technology Publications, Lda. All rights reserved

that is part of the National Higher Education
Assessment System (SINAES).
Historically, ENADE was created to evaluate the
quality of the tertiary education system. They are
divided into universities, university centers, and
nonuniversity institutions (private and public)
throughout Brazil (OECD, 2013). It aims to measure
and evaluate either in class or distance learning
students’ performance related to program content,
skills, and competencies acquired during their
courses. The exam comprises questions about three
core components: institutional evaluation, degree
course evaluation, and student achievement
assessment (INEP, 2020).
We must highlight that significant differences
exist between the private and public tertiary sectors
regarding the quality of professors and attendance.
Public universities are usually better equipped and
organized than those in the private sector, and such
characteristics have a clear on ENADE´s results.
Each year, students of a set of disciplinary fields
are compulsorily registered by their institutions to do
the ENADE exam. The disciplinary fields are
classified into three broad groups: (1) Health,
agriculture, natural resources, and related fields; (2)
STEM, architecture, pedagogical, literature, and
related fields; and (3) Social science, humanities,
culture, and design fields. The institutions and the
students of each field are evaluated in a three-year
cycle (INEP, 2021).
Yearly, INEP publishes the results of the exams
of each cycle. A final grade (ranging from 1 to 5) is
attributed to each institution’s tertiary degree. The
higher the grade achieved by the students, the better
the degree. Finally, the ENADE datasets are publicly
available at INEP site following open data principles
(INEP, 2021).
Like Brito (2008) and Zoghbi, Rocha, and Mattos
(2013), we advocate that data analysis at ENADE
datasets can be used to estimate higher educational
institutions’ efficiency in Brazil and support teachers’
work. Besides, we believe that academic managers
who need to execute institutional or course
evaluations or compare incoming students and
graduating ones can take advantage of our work.
The professional ENADE datasets analysis can
bring information and insight about new Brazilian
professionals’ competencies. However, few
institutions can afford sophisticated analyses or learn
about the data despite the vast amounts of available
educational data. Due to the time restrictions and
production goals, many academic managers act as a
simple collector of data to fill in administrative forms.
This paper advocate using Educational Data Science
(EDS) to explore ENADE’s datasets to aid the
academic staff.
Romero and Ventura (2017) described EDS as a
specific application of Data Science in the Education
field. Cao (2017) also mentioned relevant concepts
related to Data Science, and he highlighted novel
opportunities to explore new data domains like
economy and education.
This paper aims to investigate the characteristics
of final year students enrolled in the STEM tertiary
degrees in Brazil who performed the ENADE exams
in 2005, 2008, 2011, 2014, and 2017.
This work is organized as follows: the next section
presents the Material and Methods; it describes the
procedures used to access the database of INEP; the
details about the datasets’ structure; the selection of
the attributes and analysis performed. In the Results
and Discussion section, the statistical analyses and
graphs are discussed. Finally, the conclusions and
future works are presented in the last section.
2 MATERIAL AND METHODS
The ENADE exam started to be performed by INEP
in 2004 in Brazil. The INEP offers its results as public
files and microdata, and each file corresponds to a
specific year exam (INEP, 2021). As mentioned in the
introduction section, the set of information about all
ENADE exams is available, allowing us to perform
various cross-analyses.
The datasets are in CSV format. The records
contain the data for each student who performed the
exam. Its columns hold the data attributes collected or
generated during the registration or execution of the
exam. The student's identification is anonymized.
Briefly, each record of the dataset is composed of
two parts. The first part indicates the evaluations
regarded to the general knowledge (10 questions).
The second part indicates the domain knowledge (30
multiple choice questions and the grades of three
additional essay-type questions).
The final grade (FG) of the exam is calculated
according to both parts. It comprises 25% of the
general knowledge (GK) and 75% of the domain
knowledge (DK).
In general, the records contain multiples students’
attributes, such as sex, age, grades, social and
financial information, the tertiary degree which the
student is enrolled, the university information, and
other attributes (INEP, 2021). The data dictionary,
which accompanies each microdata, is presented in
Portuguese language, and describes all attributes.
Investigating Undergraduate Brazilians Students’ Performance in STEM Courses
123

Previous researches explored minor parts of the
datasets. For instance, Crepalde and Silveira (2016)
used the ENADE 2014 datasets to investigate
students’ performance (originated from public and
private institutions) considering sex, race, and
financial income. Later, Silva et al. (2017) analyzed
Math and Science students’ performance based on
ENADE 2014 datasets; the variables were analyzed
using multiple linear regression techniques and the
Stepwise method.
Vista, Figueiró and Mozzaquatro (2017) analyzed
the dataset of the ENADE 2014; the authors did a
statistical analysis to verify the performance of
undergraduate students in the Computer Science
degree of the state of Rio Grande do Sul, Brazil.
Santos and Noro (2017) compared the students’
performance at ENADE 2010 that participated in a
specific multidisciplinary project called PET-Saúde.
Moimaz, Amaral, and Garbin (2017) focused on
the undergraduate course of dentistry (oral medicine),
the authors analysed the ENADE exams of the several
years (2004, 2007, 2010, and 2013) using simple
statistical methods.
Neto et al. (2018) investigated the factor that
affects student performance in the Brazilian
undergraduate medical programs, and they
considered seven variables associated with results
obtained at ENADE 2010. The authors applied a
multivariate analysis model of binary logistics
regression.
This article proposes a broader approach,
different from previous works. We analysed the
whole dataset of all Brazilian STEM degree courses
and considered all types of Brazilian academic
organizations (universities, university centers, and
non-university institutions), and we analysed the data
of 527,058 final year students, the ones who
performed the ENADE exam in 2005, 2008, 2011,
2014, and 2017. We stress that our investigation also
students in class and distance learning in STEM
degrees.
Besides, our experiments were planned as the
following steps:
(i) Access the INEP site and selected the
microdata to download;
(ii) Select the attributes to perform the analysis;
(iii) Select the STEM final year students according
to degree code attribute;
(iv) Perform data cleansing and data checks to
identify invalid data and missing values;
(v) Remove null data and outliers;
(vi) Perform data analysis, including statistics;
(vii) Generate the data visualization as graphics.
Specifically, in the computational experiments,
the following attributes were considered across the
datasets: degree code (co_grupo), sex (tp_sexo), age
of the student (nu_idade), grades in General
Knowledge (GK) (nt_fg), grades in the Domain
Knowledge (DK) (nt_ce) and final grades (FG)
(nt_ger).
We must highlight that many students have
boycotted the first three-cycles of the ENADE exam
due to a political movement, some of them give no
answers to the questions. Perhaps, this can justify null
values, especially in the 2005 and 2008 exams.
Besides, we stress that due to the COVID-19
pandemic, the ENADE was not applied in 2020.
The experiments were executed as R statistical
software that followed these computational steps:
(i) Obtain the ENADE public datasets (microdata)
for the years 2005, 2008, 2011, 2014, and 2017;
(ii) Select the attributes (columns);
(iii) Verify and clean the data;
(iv) Do data analysis, including statistics;
(v) Do data visualization.
Statistical analyses were performed using the
programming language R (R Core Team, 2020), the
Integrated Development Environment (IDE) RStudio
(RStudio Team, 2020), and Microsoft Excel (2018)
were used to perform the steps (ii) to (v).
Before the statistical analysis, the selection step
was carried out, whose objective was to filter all
students enrolled in the STEM tertiary degrees
present in the microdata.
3 RESULTS AND DISCUSSION
In this section, three core features were analysed
about the final year students enrolled in STEM
tertiary degrees:
(1) Distribution by sex;
(2) Distribution by age;
(3) Analysis of grades, specifying the GK, DK and,
consequently, the exam’s final grade FG.
The first set of analyses is intended to compare
males’ and females’ percent of students finishing the
tertiary education in STEM fields (Table 1).
CSEDU 2021 - 13th International Conference on Computer Supported Education
124
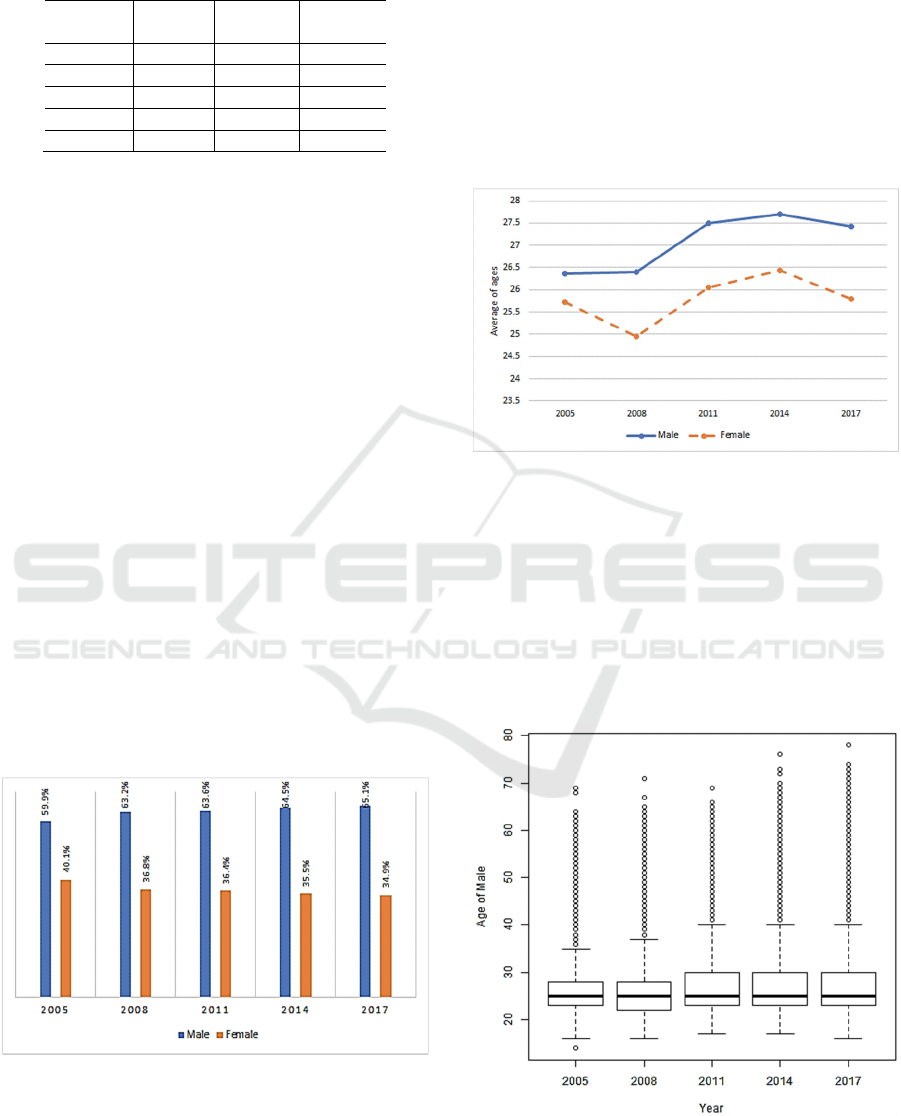
Table 1: The number of male and female final year students
in STEM degrees by ENADE exams.
ENADE
exams
Male
STEM
Female
STEM
Total of
students
2005 24,612 16,468 41,080
2008 29,469 17,178 46,647
2011 48,351 27,725 76,076
2014 102,098 56,080 158,178
2017 133,532 71,545 205,077
Figure 1 shows a histogram comparing the
percentage of male and female final year students
enrolled in STEM degrees during the years. The
percentage of the female is reducing year by year in
the STEM field. Such observation means that the
workforce of the STEM field is composed
predominately of males.
Christie et al. (2017) discussed the female’s
participation in STEM field are decreasing in the past
years. Papadakis, Tousia, and Polychronaki (2018)
also related a continuous under-representation of
woman in the field of computer science in Greece,
they analysed the data of the Computer Science
Department of Crete, from 1985 to 2017. Loyalka et
al. (2019) showed a similar result when comparing
degree programs in China, India, Russia, and the
United States.
The 2020 edition of Education at a Glance report
provides an explanation of the under-representation
of women in some fields could be that they fear they
will not have equal career opportunities in those
fields, after completing their education (OECD,
2020).
We stress that our research results emphasize that
women are being underrepresented in technology in
Brazil.
Figure 1: Percentage of male and female final year students
in STEM degrees.
The second analysis is dedicated to identifying the
ages of the final year students. The goal is to
determine the students’ average age in STEM degrees
by sex.
Figure 2 shows that females are younger than
males in all years. OECD (2020) presents indicators
about the age of students in many countries.
The mean ages of males are increasing. For
instance, in 2005, 2008, 2011, and 2017 were 26.4,
26.4, 27.5, 27.7, and 27.4 years old, respectively. The
means age of the female students is lower than males
in the same period.
Figure 2: Average age of final year students enrolled in
STEM degrees by sex.
The boxplot is a graphical depiction of numerical
data through their quantiles. It is a simple way to
visualize outliers. Figure 3 shows the third quartile of
the years (2011, 2014, and 2017) that many male
students over 30 years old are finishing STEM
degrees. We observed that the median age is
increasing year by year. The outliers show many
males finishing over 40 year.
Figure 3: Boxplot of the age of male final year students in
STEM degrees.
Investigating Undergraduate Brazilians Students’ Performance in STEM Courses
125
In 2005, 2008, 2011, and 2017 females’ mean age
was 25.7, 24.9, 26.0, 26.4, and 25.8 years old.
The boxplot in Figure 4 shows additional
information. The third quartiles of the years (2005
until 2017) are more regularity ranging from 26 to 28,
then 25% of student female are finishing the STEM
degree over 26 years old.
Figure 4: Boxplot of the age of female final year students in
STEM degrees.
The third analysis identifies the trends of students'
grades to foresee the future labour force performance
in the STEM field. In other words, estimate the level
of knowledge acquired during the undergraduate
course in STEM fields by using the grades in general
knowledge (GK), domain knowledge (DK), and final
grades (FG) where the range of the grades is [0,100].
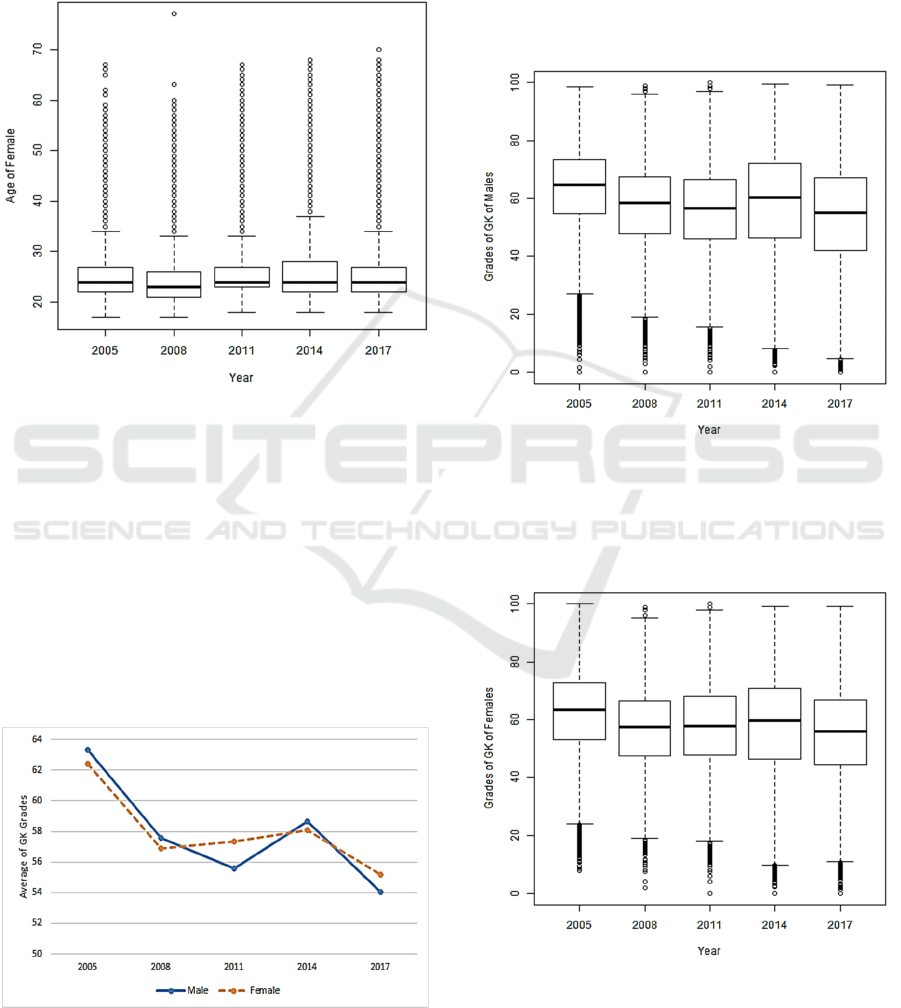
The GK grades related to the level of knowledge
about broad themes related to student’s competencies
and skills. It is part of the overall level of professional
excellence and indicates the education quality.
Figure 5: Average grade in GK of final year students in
STEM degrees by sex.
Figure 5 shows GK grades for the years 2005,
2008, 2011, 2014, and 2017, representing the
difference between males and females. Notably, the
average of grades in general knowledge is decreasing
year by year in both cases.
Figure 6 presents the boxplots about the male
performance in GK. Those results demonstrate that
the average is around 60%. One reason for significant
number of outliers is the number of students that
boycotted the first ENADE exams.
Figure 6: Boxplot of male final year students in STEM
degrees by GK grades.
Figure 7 shows the boxplots about GK’s female
performance; the same results compared with male
performance in the GK, it is around 60%.
Figure 7: Boxplot of female final year students in STEM
degrees by GK grades.
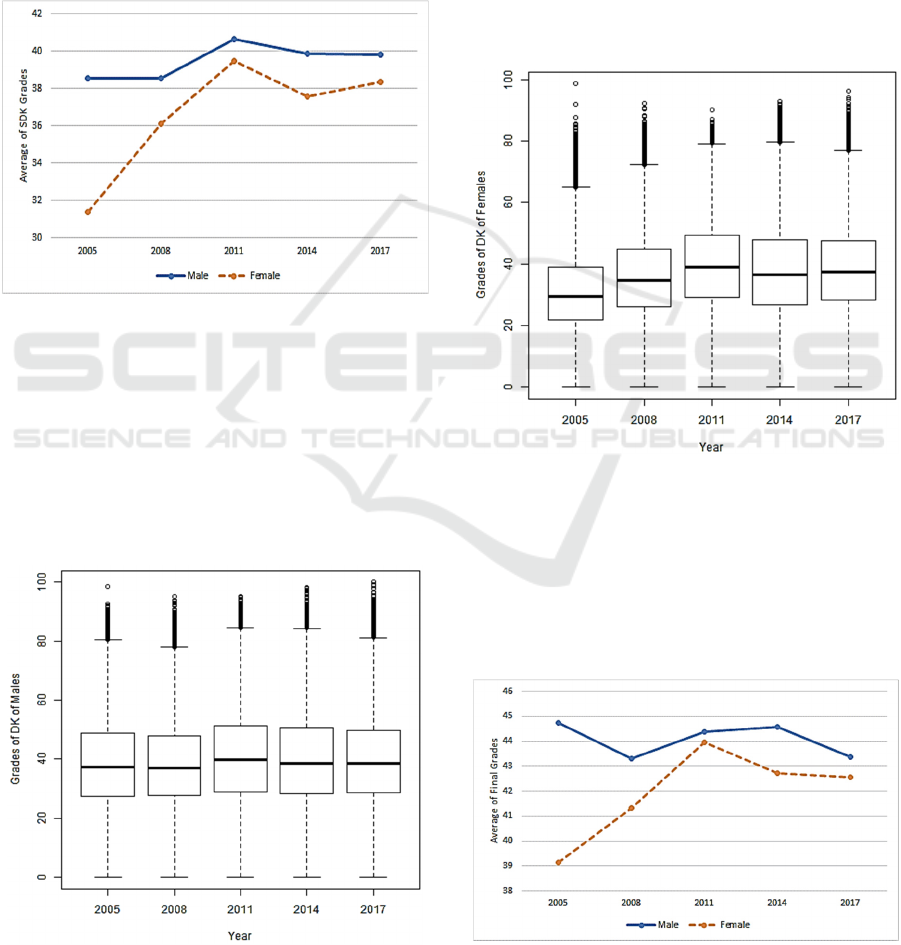
The DK grades related to the level of knowledge
of students in the STEM disciplines; they indicate the
CSEDU 2021 - 13th International Conference on Computer Supported Education
126
Competency-Based STEM Curriculum learned by the
student. This can indicate the professional
competencies and education qualities in the STEM
field.
Figure 8 shows DK’s grades for the years 2005,
2008, 2011, 2014, and 2017, representing the
difference between male and female students’
performance. Notably, the average of grades in DK is
increasing, but the average is meager. It is under 42,
and the female students are even lower than males
students in every exam.
Figure 8: Average grades in DK of final year students in
STEM degrees by sex.
Figure 9 shows the boxplots about the male
performance in DK, and the outliers indicate the
number of students who obtained a grade over 80 in
DK, which is an excellent grade and demonstrates a
high level of the future STEM professional is
increasing in the labour force. However, around 50%
of the students are under 40 that demonstrates an
insufficient level of knowledge.
Figure 9: Boxplot of male final year students in STEM
degrees by DK grades.
This study examined a wide array of data about
students’ exams, more specialized analyses to review
the scholarly research on educational practices at the
graduate level are necessary to improve Brazilian
educations system.
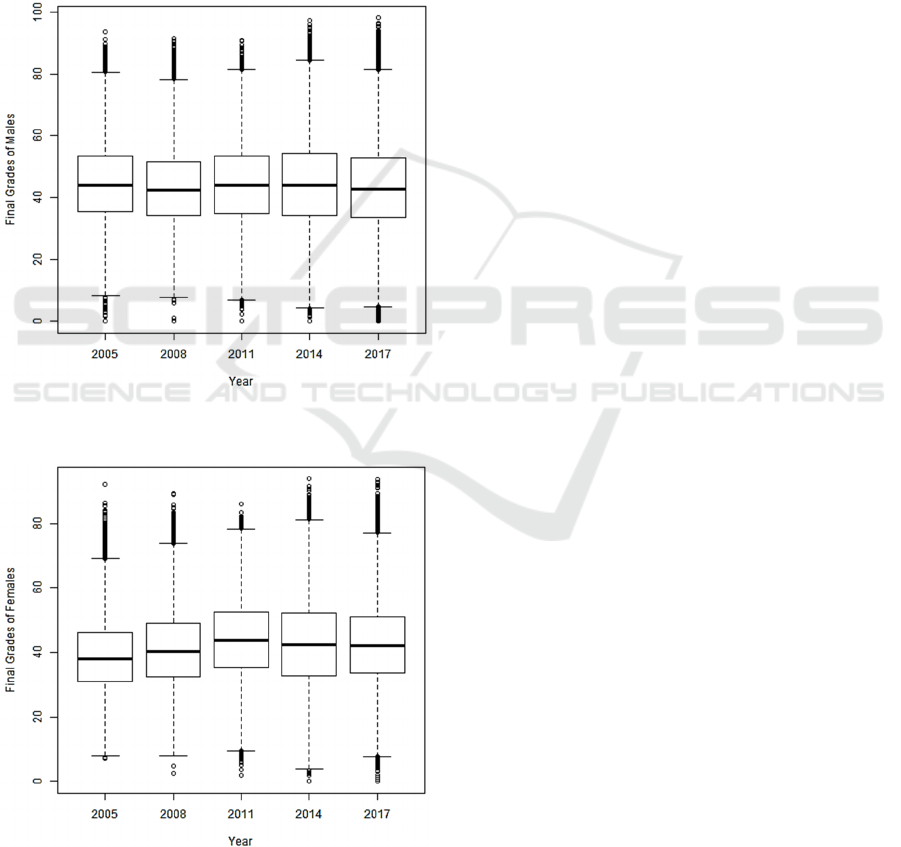
Comparing the performance between male
(Figure 9) and female (Figure 10) students, the
boxplots show that female performance in the domain
knowledge is lower than male’s performance.
In this article’s scope, it is impossible to
determine the reason for those results, but this
information reveals the need to understand more
about female performance and the consequences for
the labour force in STEM fields.
Figure 10: Boxplot of female final year students in STEM
degrees by DK grades.
The final grade (FG) is a composition of results
(25% of the GK and 75% of the DK). It represents the
overall result of the ENADE exam.
Figure 11 shows the final grades of the years
2005, 2008, 2011, 2014, and 2017. It represents the
differences between male and female students’
Figure 11: Final grade average of final year students in
STEM degrees by sex.
Investigating Undergraduate Brazilians Students’ Performance in STEM Courses
127
performance. Notably, the average of grades for both
sexes is under 45, and the difference between males
and females average is evident.
Figure 12 shows the boxplots about the male
performance in final grades. These graphics present
interesting information. The upper quartiles outliers
indicate the number of students obtained over 80 in
final grades.
The value represents an outstanding grade and
demonstrates high-level knowledge. On the other
hand, most students have unsatisfactory grades. The
comprehensive insight about the performance of the
students in the average is low.
Figure 12: Boxplot of male final year students in STEM
degrees by FG grades in the ENADE exams.
Figure 13: Boxplot of female final year students in STEM
degrees by FG grades in the ENADE exams.
4 CONCLUSIONS
Governments and academics are increasingly looking
to international comparisons of education system.
Due to the importance of education in helping people
acquire skills to participate in society and labour
market. Particularly the study of STEM fields has
become a priority in many countries, problem
solving, and quantitative analysis are considered
essential in economy and are in high demand in the
labour market (OECD, 2020).
Some studies reviewed the inclusion of adult
women into the labour market, focusing on unequal
occupation, leadership roles, and underrepresentation
in certain professions, and how these facts were
related to the historical and cultural expectations
(Christie et al., 2017; Papadakis, Tousia, and
Polychronaki, 2018; Loyalka et al., 2019; OECD,
2020).
These studies are fair but do not consider the in-
depth Data Science analytical investigations. Our
study shows pieces of evidence that without a STEM
degree, women are less likely to occupy certain
positions in the increasing STEM labour market.
Our study used Brazilian public datasets, they
were essential to extract knowledge and reproductive
research, inspire new studies and opinion, and enables
the exploration of topics not envisioned by the
previous investigators (Pilat and Fukasaku, 2007).
The INEP maintains a vast number of public
datasets providing information about Brazilian
education. Notably, despite the tecnhical difficulties
and limited investiments, the ENADE is the unique
approach used to Brazilian undergraduate students’
academic performance. However, despite that, up to
now, few Brazilian educational institutions use
datasets to extract valuable quantitative knowledge.
Our experiments analysed the characteristics of
final year students in STEM degrees. We investigated
the ENADE exams from 2005, 2008, 2011, 2014, and
2017 to select the records of students of the tertiary
education level in STEM fields who took the exams
in those years.
The analyses were focused on: (1) distribution by
sex; (2) distribution by age; and (3) the analysis of
grades, specifying the GK, DK and FG grades
revealed sex and preformance differences.
Our results showed the number of female students
is reducing year by year in STEM degrees compared
to males’ percentages. The second analysis results
showed the mean ages of males are increasing each
year, and the means age of the female students is
under males in all years. The third analysis identifies
the trends of students’ grades.
CSEDU 2021 - 13th International Conference on Computer Supported Education
128

Notably, the average of GK grades is decreasing
year by year in both males and females. The DK
average grades is increasing for both, but the average
is meager. Futhermore, the DK average grades for
female students are even lower comparing than that
of males students in every exam. We consider that
such observations are being reflected in the Brazilian
STEM labour market, mostly regarded as inequalities
to women.
The final grade (FG) is a composition of results
(25% of the GK and 75% of the DK). It represents the
overall result of the ENADE exam. The average of
grades for females is increasing but is lower than for
males. For both sexes the average is under 45,
representing most undergraduates have an
unsatisfactory grade.
The methods used for this study incorporated in
the various R language libraries (R Core Team,
2020). Make this a powerful tool libraries for
performing the statistical analyses presented in this
research.
As future work, we intend to develop new
investigations and consider the new datasets to
understand how sex differences originated in the high
school have historically developed into inequalities at
the tertiary level.
REFERENCES
Brito, M. R. F. de., 2008. O SINAES e o ENADE: da
concepção à implantação. Avaliação: Revista da
Avaliação da Educação Superior (Campinas), 13(3),
841-850. https://dx.doi.org/10.1590/S1414-
40772008000300014
Crepalde, N. J. B. F., Silveira, L. S., 2016. Desempenho
Universitário No Brasil: Estudo Sobre desigualdade
educacional com dados do Enade 2014. Revista
Brasileira de Sociologia - Rbs, [s.l.], v. 4, n. 7, p.211-
238, jul.
Christie, M., O’Neill, M., Rutter, K., Young, G., Medland,
A., 2017. Understanding why women are under-
represented in science, technology, engineering and
mathematics (STEM) within higher education: A
regional case study. Production, 27(SPE).
Cao, L., 2017. Data science: a comprehensive overview.
ACM Computing Surveys (CSUR), 50(3), 1-42.
ENADE, 2020. Exame Nacional de Desempenho de
Estudantes. INEP - Instituto Nacional de Estudos e
Pesquisas Educacionais Anísio Teixeira. Ministério da
Educação. http://portal.inep.gov.br/enade. (acessed
December 21, 2020)
INEP, 2020. Higher Education Assessments.
http://portal.inep.gov.br/higher-education-assessments.
(acessed December 21, 2020)
INEP, 2021. Microdados. INEP - Instituto Nacional de
Estudos e Pesquisas Educacionais Anísio Teixeira.
Ministério da Educação. http://inep.gov.br/web/guest/
microdados. (acessed January 10, 2021)
Loyalka, P., Liu, O. L., Li, G., Chirikov, I., Kardanova, E.,
Gu, L., Tognatta, N., 2019. Computer science skills
across China, India, Russia, and the United States.
Proceedings of the National Academy of Sciences,
116(14), 6732-6736.
Microsoft Corporation, 2018. Microsoft Excel, Available
at: https://office.microsoft.com/excel.
Moimaz, S. A. S., Amaral, M. A., Garbin, C. A. S., 2017.
Enade: uma análise quanti-qualitativa dos exames
nacionais de Odontologia. ABENO, [s.l.], v. 17, p. 97-
108, 2017.
National Academies of Sciences, Engineering, and
Medicine, 2018. Graduate STEM education for the 21st
century. National Academies Press.
Neto, T. A., Pereira, P. D. S. F., Nogueira, M. L., de Gody,
J. M. P., Moscardini, A. C., 2018. Factors that Affect
the National Student Performance Examination Grades
of Brazilian Undergraduate Medical Programs. GMS
Journal for Medical Education, 35(1).
OECD, 2013. Assessing higher education learning
outcomes in Brazil. Higher Education Management and
Policy, Vol. 24/2. http://dx.doi.org/10.1787/hemp-24-
5k3w5pdwk6br
OECD, 2018. Rethinking Quality Assurance for Higher
Education in Brazil, Reviews of National Policies for
Education, OECD Publishing, Paris.
https://doi.org/10.1787/9789264309050-en
OECD, 2020. Education at a Glance 2020: OECD
Indicators, OECD Publishing, Paris,
https://doi.org/10.1787/69096873-en.
Papadakis, S., Tousia, C., Polychronaki, K., 2018. Women
in computer science. The case study of the Computer
Science Department of the University of Crete, Greece.
International Journal of Teaching and Case Studies,
9(2), 142-151.
Pilat, D., Fukasaku, Y., 2007. OECD principles and
guidelines for access to research data from public
funding. Data Science Journal, 6, OD4-OD11.
R Core Team, 2020. R: A language and environment for
statistical computing. R Foundation for Statistical
Computing, Vienna, Austria. URL https://www.R-
project.org/.
RStudio Team, 2020. RStudio: Integrated Development for
R. RStudio, PBC, Boston, MA URL
http://www.rstudio.com/.
Romero, C., Ventura, S., 2017. Educational data science in
massive open online courses. Wiley Interdisciplinary
Reviews: Data Mining and Knowledge Discovery, 7(1),
p.e1187.
Santos, B. C. S., Noro, L. R. A., 2017. PET-Saúde como
indutor da formação profissional para o Sistema Único
de Saúde. Ciência & Saúde Coletiva, [s.l] v. 22, n. 3, p.
997–1004.
Silva, L. F., da Rocha, M. E. P. S., de Araujo Fagundes, R.
A., 2017. ENADE: Math and Science Students'
Investigating Undergraduate Brazilians Students’ Performance in STEM Courses
129

Performance Analysis. IEEE Latin America
Transactions, 15(9), 1742-1746.
Vista, N. P. B., Figueiró, M. F., Mozzaquatro, P. M., 2017.
Técnicas de mineração de dados aplicadas aos
microdados do ENADE para avaliar o desempenho dos
acadêmicos do curso de Ciência da Computação no Rio
Grande do Sul utilizando o software R. I Seminário de
Pesquisa Científica e Tecnológica, s. l., v. 1, p. 1-11.
Zoghbi, A.C., Rocha, F., Mattos, E., 2013. Education
production efficiency: Evidence from Brazilian
universities. Economic Modelling, 31, pp.94-103. ISSN
0264-9993, https://doi.org/10.1016/j.econmod.2012.
11.018.
CSEDU 2021 - 13th International Conference on Computer Supported Education
130
