
Technology Adoption for Statistics Teaching:
An Approach to Enhance Learning
Lessons Learned from Building an Investigative Environment
Leandro Mendonça do Nascimento
a
, Carla Delgado
b
, Mônica Ferreira da Silva
c
,
Victor Prado
d
and Lorena Pires Griõn
e
Graduate Program in Informatics, PPGI/Universidade Federal do Rio de Janeiro, Rio de Janeiro, Brazil
lorenagrion@gmail.com
Keywords: Technology Adoption, Geogebra, Smartphones, Google Forms, Statistics Learning.
Abstract: Active learning is one of Brazil’s goals for education, and it encourages and develops students new skills and
competencies for a more complete and meaningful education. The didactic sequence that we carried out
promoted the articulation of statistical knowledge with the use of techniques of data collection and systematic
analysis through a technological device. According to the itinerary proposed by this study, the students built
the research in groups, collected the data with Google Forms among their peers, using their smartphones, and
then analyzed the data obtained using an Applet developed in Geogebra. Thus, in this paper, when we present
the activity, its elaboration process, its execution, and its results, we aim to collaborate with teachers and
future teachers who want to adopt technology in their classrooms, especially if they want to build empirical
research.
1 INTRODUCTION
The publication Brasil (2018) of the Brazilian
Common National Curriculum Base (BNCC) placed
Statistics as the guiding axis within Mathematics
Teaching, listing, for all years, subjects of Statistics
to be taught by teachers of Mathematics.
The general objective of this work is to evaluate
the impact of the adoption of technology, as a way to
encourage the protagonism of students to work with
Statistics. This type of approach provides teachers in
activity or training with an example on the use of
technological resources for the development of
didactic proposals based on active learning for the
classroom.
This work aims to present math teachers with
possible means to create an investigative environment
for their students, through technology, in order to
a
https://orcid.org/0000-0002-6917-4274
b
https://orcid.org/0000-0003-3570-4465
c
https://orcid.org/0000-0003-0951-6612
d
https://orcid.org/0000-0003-3960-7195
e
https://orcid.org/0000-0003-2810-2415
develop specific skills present in the BNCC. In
particular, statistical concepts present in the BNCC
provide the opportunity for systematic work with
data, which is crucial in our days.
The specific objectives are: (1) To execute the
work in classroom in conformity with the BNCC
proposal. (2) to demystify the use of these resources
as practical teaching toolsaids for everyday school
life; (3) to present and discuss the construction of
proposals for meaningful teaching of statistics; (4) to
present and discuss proposals for the use of
technology for active learning; (5) to discuss bullying
inside school.
Reflecting the influences and transformations
through which the processes of acquisition and
representation of knowledge pass in the face of the
growing volume of stored data and the evolution of
technological tools to give access to this amount of
332
Mendonça do Nascimento, L., Delgado, C., Ferreira da Silva, M., Prado, V. and Pires Griõn, L.
Technology Adoption for Statistics Teaching: An Approach to Enhance Learning Lessons Learned from Building an Investigative Environment.
DOI: 10.5220/0010493503320337
In Proceedings of the 13th International Conference on Computer Supported Education (CSEDU 2021) - Volume 2, pages 332-337
ISBN: 978-989-758-502-9
Copyright
c
2021 by SCITEPRESS – Science and Technology Publications, Lda. All rights reserved

information, the elementary instrumentation of
students so that they can participate in this world, is
not only instigating, but essential. This proposal aims
to demystify, for teachers already working and for
those in training, not only the teaching of statistics in
the final years of elementary school but also the
technological support that is available to students to
effectively appropriate this knowledge.
We believe that teaching and learning processes
should be presented to students in a collaborative and
investigative way and, for this, the teacher needs to
break with prerogatives acquired throughout their
development process, as stated by Moraes (1996, p.
59):
“the great majority of teachers still privilege the
old way they were taught, reinforcing the old
teaching, moving the learner away from the
process of knowledge construction”.
In this sense, we point out that by using
technology for teaching, especially through dynamic
software, we create a channel of communication with
our student, whose use increases the student's
engagement and interest, as Romero assures:
“Technology, specifically educational software,
provides opportunities for motivation and
appropriation of the content studied in the
classroom, since in many public and private
schools, teachers use didactic resources such as
blackboard and chalk to teach their classes, this is
one of the many problems that cause the growth
of unsatisfactory quality of teaching, especially in
the state network” (Romero, 2006, Apud
Cavalcante, 2010, p. 3).
Corroborating the study above, the document
Reflections on the contents of probability and
statistics at school in Brazil, published on the website
of the Brazilian Statistics Association (ABE, 2016, p.
1) suggests that the student should be involved with
the entire process, from the choice of research topic,
data collection, to interpretation and discussion of
results, providing an investigative environment.
Among the skills present in the BNCC, we
address the concept of probability, which we can see
in Brazil (2018, p. 315):
“Calculate the probability of events, based on the
construction of the sample space, using the
multiplicative principle, and recognize that the
sum of the probabilities of all elements of the
sample space is equal to 1”.
Still in this perspective, we worked on basic
concepts of Statistics present in the BNCC in Brazil
(2018, p. 315):
“To obtain the values of central tendency
measures of a statistical survey (average, mode
and median) with the understanding of its
meanings and relate them to the dispersion of data
indicated by the amplitude”.
In this way, we chose to work these concepts
using technology and built our applet. It is possible to
build very interesting didactic sequences using the
Geogebra materials, available in the software
platform that are made available for free by teachers
from all over the world for teachers who wish to use
technology in their classroom.
2 METHODOLOGY
To answer the research question we proposed a set of
activities to be done with the students. The proposed
activities were structured in 4 stages:
1. Question preparation
2. Peer Interviews
3. Data Analysis
4. Results discussion
This experiment was developed in an eighth grade
class at the Dulce Trindade Braga school, of the
network of the municipality of Duque de Caxias
within the state of Rio de Janeiro and aimed to
provide students with an environment for
investigating the concepts of statistics in which the
data collection was also idealized and performed by
the students.
At school, the experiment allows students to
engage with the content being addressed by the
teacher, formulate their hypotheses, research
solutions, analyze results, as well as actively
participate with their peers in the teaching-learning
process (Almeida & Malheiro, 2019).
According to Dias & Silva (2010, p. 49) we have
that: “in the experiment, the researcher elaborates the
research scenario, defines the variables and the
subjects to be analyzed, which are divided into
experimental and control”.
This experiment was carried out without the
control group for ethical reasons so that we did not
include any students in this process.
Technology Adoption for Statistics Teaching: An Approach to Enhance Learning Lessons Learned from Building an Investigative
Environment
333
3 BUILDING AN
INVESTIGATIVE
ENVIRONMENT IN
CLASSROOM
The goal is to prepare students to use technological
tools to produce their own surveys, and also, to
practice the statistical concepts listed in BNCC
3.1 Stage 1: Question Preparation
The statistics concepts selected for this research were
the measures of central tendency and dispersion; the
investigated variables were classified as quantitative
variables.
The students who volunteered used the teacher's
computer to build the form and used their
smartphones in two stages, namely: data collection
and analysis.
We divided the 35 students from class 801 into 7
groups with 5 students. They had the task of
elaborating a question to compose the research that
we would carry out to the students of the same shift
with the theme: School bullying. The theme was
chosen to compose a series of projects of the school
because of a meeting held by the institution's college.
It was up to the teacher to welcome the questions
proposed by the groups, to make an initial filter so
that no question would cause embarrassment to the
respondents. After this treatment, we forwarded them
to the pedagogical coordination for a second filter
with the same objective and the questions returned
without any change.
Each group had the opportunity to expose their
question and we listed volunteers for the elaboration
of the form in Google Docs so that, in the next stage,
the students could interview their peers. The teacher
took advantage of the opportunity and consulted the
school management on questions they would like to
include (questions 4, 5 and 6 were intended for the
management to understand how the school unit
works).
The selected questions were: 1) What is your
class? 2) What is your age (in years)? 3) How many
siblings do you have? 4) What is your level of
satisfaction with the teachers? 5) What is your level
of satisfaction with the snack? 6) What is your level
of satisfaction with school cleanliness? 7) Have you
ever suffered any type of bullying? 8) Have you ever
suffered any type of physical or verbal aggression? 9)
Have you or anyone in your family ever suffered
racism? 10) Do you know anyone who has suffered
sexual abuse? 11) Do you have a good relationship
with your family?
This form containing the questions elaborated by
the students and the direction is available at the
address: https://forms.gle/ZDm9n5tND6EJKmNv6
3.2 Stage 2: Peer Interviews
Before this step, the school management and teachers
of other classes were informed of the activity that
would be developed.
A commission formed by one student from each
group used smartphones to interview the other
students and, in order for this activity to be developed,
the teacher made his/her internet available and shared
the form link with the group that carried out the
research.
The teacher was responsible for importing the
data into the Geogebra software and building the
Applet for data analysis (activities present in
Minicurso).
3.2 Stage 3: Data Analysis
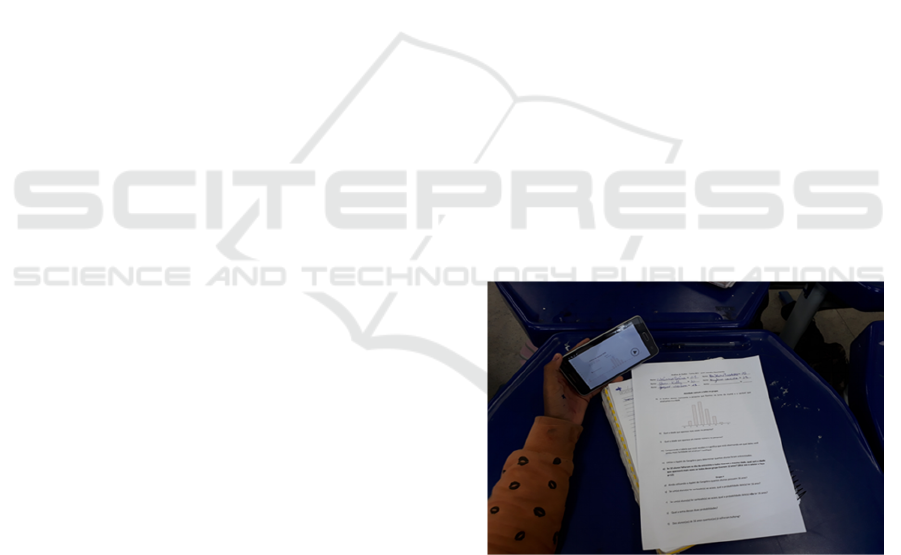
We made available to the class the Applet
(https://ggbm.at/WXadJuGs) and distributed an
investigative activity (Figure 1) that needed to be
manipulated in Geogebra to be able to answer the
questions (appendix I) in the time made available for
two lesson times, that is, 100 minutes.
Figure 1: Investigative activity.
In the Geogebra Applet (Figure 02), by clicking
on the Data Analysis button, the student could
manipulate logical operators to obtain the quantities
of students with specific ages. In the situation
presented below, we clicked on the symbol of greater
or equal (≥), we typed the value 11, we clicked on the
enter button and we got the answer that 137 people
answered the form.
CSEDU 2021 - 13th International Conference on Computer Supported Education
334
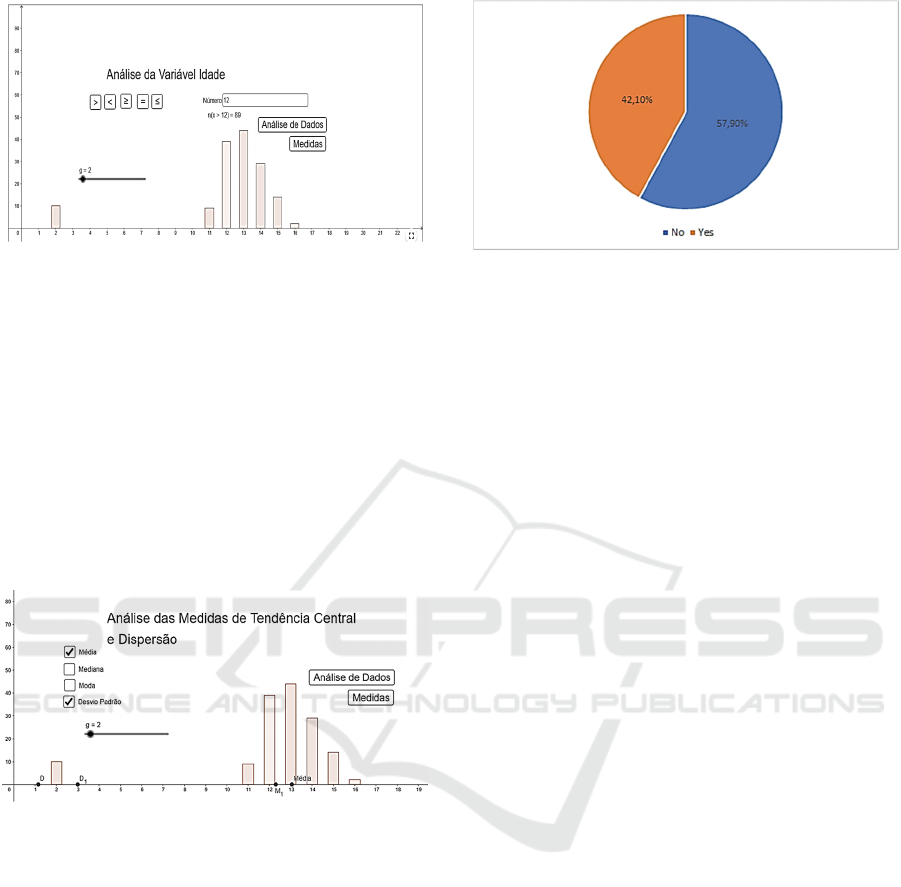
Figure 2: Initial screen of Applet in Geogebra.
By clicking on the measures button, we had the
possibility to explore several scenarios in which the
concepts of mean, median, mode and standard
deviation could be verified with the inclusion of a
supposed group of absent students, controlled by a
slider control (g).
By clicking on the measurements button (Figure
3), we had the possibility to explore several scenarios
in which the concepts of mean, median, mode and
standard deviation could be verified with the
inclusion of a supposed group of absent students
controlled by a slider (g).
Figure 3: Applet in Geogebra within Measurements.
3.3 Stage 4: Results Discussion
At this stage, we selected the graphs generated by the
qualitative variables (Graph 1) in order to discuss
them in a great debate, giving everyone the
opportunity to talk about the presence of bullying and
its practice in the school environment.
On the occasion, we made use of the numbers of
the research that they elaborated to raise awareness
and debate, above all to point out how harmful are the
jokes that point out defects and characteristics of
colleagues. We suggested a collective effort to
diminish this index of 42,1% observed on graphic 1.
Figure 4: Graph 1: Percentage of students who have already
been bullied.
4 FINAL CONSIDERATIONS
The proposed questions aimed to promote the Applet
use by the group of students in order to generate
effective learning of basic statistical concepts. We
realized that the students remained engaged in the
activities throughout the process, because in all
activities they were in contact with technology and
saw how it could help them to enhance their studies.
Our choice for Google Docs and Geogebra was in
the direction of providing an investigative
environment that could accelerate the process of data
collection and interpretation, which was evidenced by
Piccolli, who says:
“the choice of software must be based on the
school's pedagogical proposal of mathematics, the
teacher must choose a suitable type of software to
enable the student to build his/her knowledge,
without leaving aside the deep domain that he/she
needs to have both of the content covered and the
program that he/she will use” (Cláudio & Cunha
2001, apud Piccoli, 2006, 45 - 46).
At the end of the activity, we consulted the
students about the work done, especially about the
technology adoption. From a total of 35 students, 23
responded to this consultation. The survey was
conducted via Google Forms and sent to the
WhatsApp group of the class.
In the first question, we wanted to know if the
students liked to carry out the project using
technology (Graph 2) and 100% of the students said
they liked it.
Technology Adoption for Statistics Teaching: An Approach to Enhance Learning Lessons Learned from Building an Investigative
Environment
335
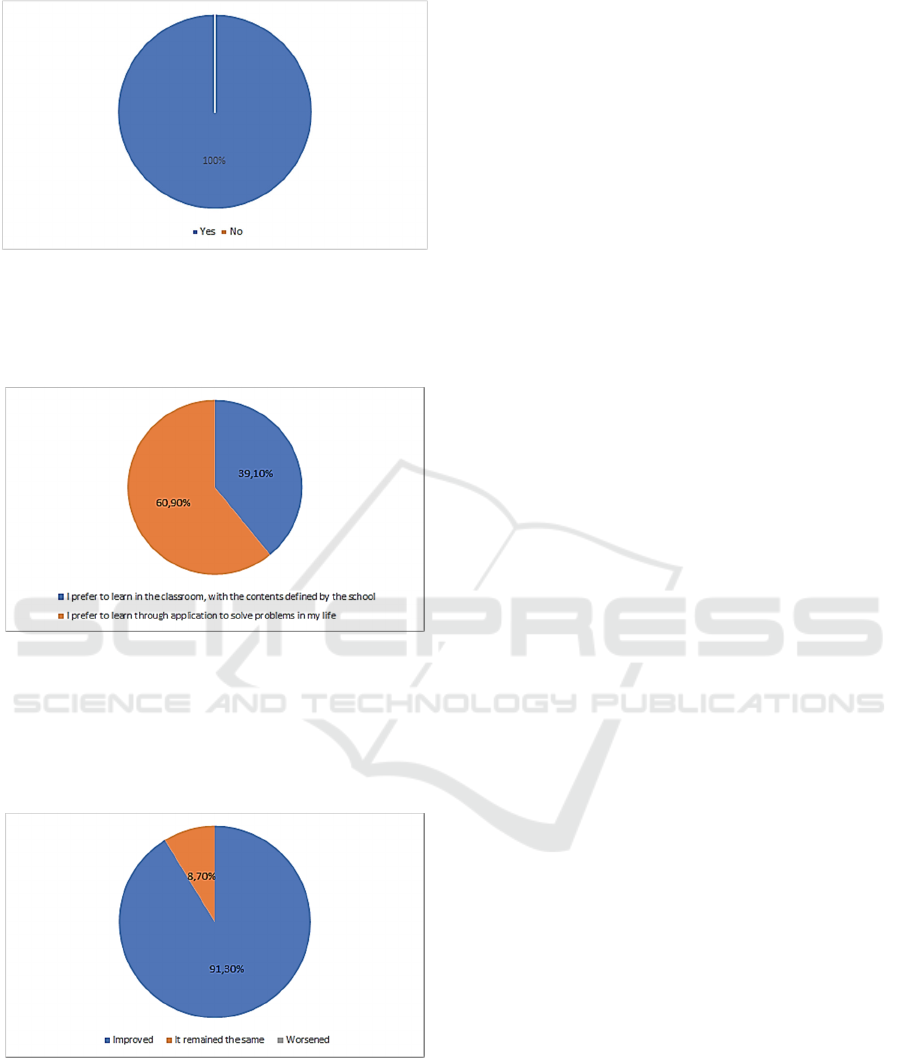
Figure 5: Graph 2: Students' opinion on the project.
Students were asked how they prefer to study
mathematics (Graph 3) and 60.9% chose the option
that pointed to solving problems in real contexts.
Figure 6: Graph 3: How students prefer to study
mathematics.
We asked the students to make a self-assessment
about the learning of statistical concepts and 91.3%
responded that the project improved the way of
learning.
Figure 7: Graph 4: Self-assessment.
Lastly, with the data from the self-assessment and
with the assessment prepared, we found that the
experience seems to have improved school
performance, since when we evaluated the students in
the first activity (Appendix I), they had 72.67% of
performance; and in the second activity (Appendix I),
they had 74.67% of performance. New research with
larger samples may validate the effectiveness of the
learning approach used.
As a suggestion for further work, we will continue
the approach in social contexts and the use of
mathematical concepts to interpret the phenomena
involved. In addition, we believe that research can
break through school walls and reach the community
more effectively, acting in forming future citizens.
REFERENCES
ABE, Reflexões dos conteúdos de probabilidade e
estatística na escola no Brasil. Available in
http://www.redeabe.org.br/site/page_manager/pages/vi
ew/wilton-bussab. Accessed in June 2019.
Almeida, W. N. C.; Malheiro, J. M. S. A experimentação
investigativa como possibilidade didática no ensino de
matemática: o problema das formas em um clube de
ciências. experiências em ensino de ciências (ufrgs), v.
14, p. 391-405, 2019.
Brasil. Ministério da Educação. Base Nacional Comum
Curricular. Brasília: MEC, 2018. Available in
http://basenacionalcomum.mec.gov.br/images/BNCC_
EI_EF_110518_versaofinal_site.pdf. Accessed on
April 17, 2019.
Cavalcante, N. I. S. O Ensino de Matemática e o software
GeoGebra: Discutindo potencialidades dessa relação
como recurso para o ensino de funções. VI EPBEM–
Monteiro, PB. Encontro Paraibano de Educação
Matemática. Novembro de 2010. Available in
http://www.pucrs.br/famat/viali/tic_literatura/artigos/p
acotes/RE-12419073.pdf. Accessed on March 7, 2019.
DIAS, Donaldo S.; SILVA, Mônica F.. Como Escrever uma
Monografia: Manual de elaboração com exemplos e
exercícios. São Paulo: Atlas, 2010.
Louzada, F.; Cordani, L.; Bazan, J.; Barbosa, T.; Reflexões
dos conteúdos de probabilidade e estatística na escola
no Brasil. Available in https://www.researchgate.net/
publication/294085499_reflexoes_a_respeito_dos_con
teudos_de_probabilidade_e_estatistica_na_escola_no_
brasil_-_uma_proposta. Accessed on April 2, 2019.
Moraes, M. C. O paradigma educacional emergente:
implicações na formação do professor e nas práticas
pedagógicas. Em Aberto, Brasília, v. 01, p. 57-69,
1996. Available in http://twingo.ucb.br:8080/
jspui/handle/10869/530. Accessed on March 8, 2019.
Piccoli, L. A. P. A construção de conceitos em Matemática:
Uma proposta usando Tecnologia de Informação.
Dissertação (mestrado) – Pós-Graduação em Educação
em Ciências e Matemática, Pontifícia Universidade
Católica do Rio Grande do Sul, Porto Alegre: [s.n.],
2006. 108f. Available in http://tede.pucrs.br/tde_busca/
arquivo.php?codArquivo=81. Accessed on March 8,
2019.
CSEDU 2021 - 13th International Conference on Computer Supported Education
336
APPENDIX
Data Analysis - Class 801 - prof. Leandro Nascimento
Group components:
___________________________________________________________________
Activity I
a) Assemble the table with all the interviewed students.
Ages Absolute frequency Xi fi Fic
11
12
13
14
15
16
b) What is the age mode?
c) What is the median age? (melhorar o formato do apêndice)
d) What is the mean age?
e) What is the probability of randomly choosing a student and they are older than the mean age of those surveyed?
f) What is the probability of randomly choosing a student and they have the mode of the age of those researched?
g) What is the probability of randomly choosing a student and they are younger than the median age of those
surveyed?
Activity II - Click on the measurements button of the application.
h) Activate the mean option and toggle the selector (represents 10 more students of an age that depends on the
value of g). Has the mean changed? Justify your answer.
i) Activate the median option and toggle the selector (represents 10 more students of an age that depends on the
value of g). Has the mean changed? Justify your answer.
j) Activate the mode option and toggle the selector (represents 10 more students of an age that depends on the
value of g). Has the mean changed? Justify your answer.
k) Activate the standard deviation and mean options and toggle the selector (represents 10 more students of an
age that depends on the value of g). What happens to the standard deviation when the value of g is far from the
mean?Justify your answer.
Technology Adoption for Statistics Teaching: An Approach to Enhance Learning Lessons Learned from Building an Investigative
Environment
337
