
Application of Pretopological Hierarchical Clustering for Buildings
Portfolio
Loup-No
´
e L
´
evy
1,2
, J
´
er
´
emie Bosom
2,3
, Guillaume Guerard
4
, Soufian Ben Amor
1
, Marc Bui
3
and Hai Tran
2
1
LI-PARAD Laboratory EA 7432, Versailles University, 55 Avenue de Paris, 78035 Versailles, France
2
Energisme, 88 Avenue du G
´
en
´
eral Leclerc, 92100 Boulogne-Billancourt, France
3
EPHE, PSL Research University, 4-14 Rue Ferrus, 75014 Paris, France
4
De Vinci Research Center, Pole Universitaire L
´
eonard de Vinci, 12 Avenue L
´
eonard de Vinci, 92400 Courbevoie, France
{f author.s author}@devinci.fr
Keywords:
Artificial Intelligence, Data Analysis, Clustering Algorithms, Pretopology.
Abstract:
Our paper deals with the problem of the comparison of heterogeneous energy consumption profiles for energy
optimization. Doing case-by-case in depth auditing of thousands of buildings would require a massive amount
of time and money as well as a significant number of qualified people. Thus, an automated method must be
developed in order to establish a relevant and effective recommendations system. Comparing sites to extract
similar profiles refers to a machine learning set of methods called clustering. To answer this problematic, pre-
topology is used to model the sites’ consumption profiles and a multi-criteria hierarchical clustering algorithm,
using the properties of pretopological space, has been developed using a Python library. The pretopological
hierarchical clustering algorithm is able to identify the clusters and provide a hierarchy between complex
items. Tested on benchmarks of generated time series (from literature and from french energy company), the
algorithm is able to identify the clusters using Pearson’s correlation with an Adjusted Rand Index of 1 and
returns relevant results on real energy systems’ consumption data.
1 INTRODUCTION
In 2015 was signed the Paris agreement in which gov-
ernment from all over the world undertook to keep
global warming behind a 2
◦
C increase compared to
the temperatures of 1990. The year of the Cop21, the
worldwide buildings sector was responsible for 30%
of global final energy consumption and nearly 28%
of total direct and indirect CO
2
emissions. Yet the en-
ergy demand from buildings and building’s construc-
tion continues to rise, driven by improved access to
energy in developing countries, greater ownership and
use of energy-consuming devices and rapid growth in
global buildings floor area, at nearly 3% per year
1
.
There are various ways to decrease buildings’ en-
ergy consumption (Guerard et al., 2017): social pro-
grams, incentive programs, new energies, energy effi-
ciency, dynamic pricing, demand-response programs.
Most of the time, buildings having the same profile of
consumption are sensitive to similar programs.
1
http://www.eia.gov/
However, the systems we study are not always
buildings. They can be a building floor or simply a
place inside a building. In consequence, it’s more ac-
curate to talk about sites.
Sites present an important heterogeneity both in
intrinsic properties and geographic situation (Miller,
2016). In addition, the scales of analysis are various
both in time (consumption time series are analysed on
a 24h profile as well as on a yearly profile) and space
(the studied system can go from one room to a group
of buildings across a country). Because of that, there
is no universal performance scale on which to com-
pare a site to another.
Unfortunately, doing case-by-case in depth audit-
ing of thousands of buildings would require a massive
amount of time and money as well as a significant
number of qualified people.
A comparison between similar sites might be
meaningful to understand the performance of a new
site. Comparing different sites to categorize them by
proximity is called clustering. By investigating the
works that were effective on a certain site, one can
228
Lévy, L., Bosom, J., Guerard, G., Ben Amor, S., Bui, M. and Tran, H.
Application of Pretopological Hierarchical Clustering for Buildings Portfolio.
DOI: 10.5220/0010485802280235
In Proceedings of the 10th International Conference on Smart Cities and Green ICT Systems (SMARTGREENS 2021), pages 228-235
ISBN: 978-989-758-512-8
Copyright
c
2021 by SCITEPRESS – Science and Technology Publications, Lda. All rights reserved

deduce what programs will probably be efficient for
sites of similar nature. Hence, clustering sites based
on their characteristics and consumption will enhance
their evaluation and the recommendations system.
Therefore the topic of our paper is as following:
How to cluster a large number of heterogeneous sites
based on their energy consumption profiles to recom-
mend the most relevant energy optimisation solution
possible?
In this article, we will consider that the energy
consumption profile encompasses all the physical
characteristics of a site as well as the external fac-
tors and the consumption data (time series, categori-
cal data and numerical data). The latter is considered
as a time series.
Our goal is to study a group of sites to optimize
their consumption thanks to recommendations done
on similar sites. This can be assimilated to portfo-
lio analysis. Portfolio analysis represents a domain in
which a large group of buildings, often located in the
same geographical area or owned or managed by the
same entity, are analyzed for the purpose of managing
or optimizing the group as a whole (Miller, 2016).
The key contribution of this paper is to provide a
clustering method adapted to portfolio analysis based
on a pretopological framework.
The paper is structured as follows: the section 2
introduces clustering methods and some relevant ex-
amples on energy systems. The section 3 presents the
pretopology theory and its application as a clustering
method. The section 4 shows a pedagogical example
of the presented method. We conclude in the section
5.
2 LITERATURE REVIEW
Formally, clustering refers to a set of unsupervised
machine learning methods which group unlabeled
items in clusters. In this section, we present cluster-
ing methods and their application on energy systems.
The journal paper of Iglesia et al. in Energies (Igle-
sias and Kastner, 2013) presents a deeper analysis of
clustering in energy system. To consult an exhaustive
list of clustering algorithms, we invite you to read Xu
et Al. survey (Xu and Tian, 2015).
There are four classes of clustering algorithms
with their pros and cons: centroid-based cluster-
ing, density-based clustering, hierarchical clustering,
distribution-based clustering. Let us present each
class and their application to portfolio analysis in en-
ergy system.
Centroid-based Clustering: In such methods, a
cluster is a set of items such that an item in a cluster
is nearest to the center of a cluster than to the center
of any other cluster. The center of a cluster is called
a centroid, the average of all the points in the clus-
ter, or a medoid, the most representative point of a
cluster. The most known centroid-based algorithm is
the K-means algorithm and its extensions. K-means
is a powerful tool for clustering but it requires to de-
termine in advance how many clusters the algorithm
should find.
Therefore, centroid-based algorithms are sensitive
to initial conditions. Clusters vary in size and den-
sity and include outliers (isolated item) to the nearest
cluster. Lastly, centroid-based algorithms don’t scale
with the number of items and dimensions. In those
cases, centroid-based algorithms are combined with
principal component analysis or spectral analysis to
be more effective.
About the portfolio analysis in energy systems,
Gao et al. (Gao and Malkawi, 2014) benchmark mul-
tidimensional energy use dataset using a k-means al-
gorithm. Freischhacker et al. (Fleischhacker et al.,
2019) design a spatial aggregation method, combined
with k-means, based on city blocks’ characteristics to
reduce reductions due to energy use.
Density-based Clustering: In density-based clus-
tering, a cluster is a set of items spread in the
data space over a contiguous region of high den-
sity of items. Items located in low-density regions
are typically considered noise or outliers (Kriegel
et al., 2011). The most known methods in this class
are Density-Based Spatial Clustering of Applications
with Noise (DBSCAN) and its extensions.
The formation of clusters is sensitive to two pa-
rameters: the density and the reachability. Hence, the
clusters are distinct depending on those parameters.
The main advantages are this density-based cluster-
ing algorithm does not require a-priori specification
and it is able to identify noisy data while clustering.
It fails in case of neck type datasets and it does not
work well in case of high dimensionality data.
About the portfolio analysis in energy systems,
Li et al. (Li et al., 2020) present a density-based
method with a particle swarm optimization of param-
eters of buildings portfolio. Their method forecasts
next-day electricity usage thanks to the clustering.
Marquant et al. (Marquant et al., 2018) use a den-
sity and loads based algorithm to facilitate large-scale
modelling and optimisation of urban energy systems.
Hierarchical Clustering: Hierarchical clustering is
usually a procedure to transform a proximity matrix
Application of Pretopological Hierarchical Clustering for Buildings Portfolio
229

into a sequence of hierarchically structured partitions.
There are two methods of hierarchical clustering:
ascending (or agglomerating) or descending (or divid-
ing). The ascending methods begin with disjointed
classes and place each of the items in an individ-
ual class. Based on the proximity matrix, the proce-
dure searches at each step for the two closest classes,
merges them, and then snaps into a second partition.
The process is repeated to construct a sequence of
nested partitions in which the number of classes de-
creases as the sequence progresses until a unique class
contains all the items. The descending methods do the
inverse process.
The primary problem with those algorithms is to
define the criterion of grouping or aggregation crite-
rion of two classes, i.e. a distance measure. Sites are
defined as complex systems (Ahat et al., 2013; Bosom
et al., 2018; Gu
´
erard et al., 2015). They are defined
with numerical and categorical data as well as time se-
ries, calculating a distance between two items is chal-
lenging and doesn’t allow to use each characteristic
of the site in a relevant way. Another drawback is the
difficulty to identify an accurate number of clusters,
especially in a large dataset.
About the portfolio analysis in energy systems,
Wang et al. (Wang et al., 2020) analyse the spatial
disparity of final energy consumption in China thanks
to hierarchical clustering and spatial autocorrelation.
Li et al. (Li et al., 2019) implement an agglomera-
tive hierarchical clustering-based strategy to identify
typical daily electricity usage profiles.
Distribution-based Clustering: The application to
large spatial databases raises the following require-
ments for clustering algorithms: no input parameters
or the strict minimum, clusters with arbitrary shape.
Distribution-based clustering produces clusters which
assume concisely defined mathematical models un-
derlying the items, a relatively plausible assumption
for some items distributions.
Most of the time, mathematical models are based
on Gaussian distribution, multinomial or multivari-
ate normal distribution. The clusters are considered
fuzzy, which means an item may be in various clus-
ters at a defined percent. The most known algo-
rithm is Expectation-Maximization (EM) clustering
with Gaussian mixture models (GMM). That way, the
GMM algorithm provides two parameters to describe
the shape of the clusters: the mean and the standard
deviation. The chief drawback of those algorithms is
that it cannot work on categorical dimensions.
About the portfolio analysis in energy systems, Lu
et al. (Lu et al., 2019) use a GMM clustering for heat-
ing load patterns identification. Habib et al. (Habib
et al., 2015) provide a EM clustering to detect outliers
in energy buildings portfolio.
Conclusion about Clustering Methods: None of
the methods described above can answer the speci-
ficities of the studied system, either because they re-
quire the definition of a distance between the items,
or because they cannot return the hierarchical cluster-
ing necessary to apprehend the different scales of a
complex system.
Relevance of Pretopology-based Clustering: A
pretopological space is defined by a relation between
any set of items and a bigger set of items. It is there-
fore adapted to the creation of a hierarchical structure.
It is based on the concept of abstract space. In such a
space the nature of the item is not relevant, it is rather
the relations and property linking the items to another
that matters. This allows us to manipulate heteroge-
neous and complex items such as our sites. Because
of that, pretopology can be considered as a mathemat-
ical tool for modeling the concept of proximity for
complex systems (Auray et al., 2009). Pretopology
is, therefore, the approach chosen to build our hierar-
chical clustering.
3 PRETOPOLOGY
In this section we explain the key concepts and defini-
tions of pretopology, such as pretopological space and
pseudo-closure. Then, we provide the main algorithm
for the pretopological hierarchical clustering.
3.1 Pretopological Space
Let us start with some definitions.
Definition 1. A pseudoclosure function a : ℘(U) →
℘(U) on a set of items U, is a function such that:
• a(
/
0) =
/
0
• ∀A | A ⊆ U : A ⊆ a(A)
where ℘(U) is the power set of U
Definition 2. A tuple (U, a(.)), where U is a set of
items and a(.) is a pseudoclosure function on U, con-
stitutes a pretopological space.
Definition 3. In a pretopological space, we can find
the closure by repeatedly applying the pseudoclosure
operator to the set and its subsequent images until it
stops expanding.
Definition 4. In a pretopological space the closure
of a part A of U is the smallest closure containing A.
Denoted F(A) (see Figure 2).
SMARTGREENS 2021 - 10th International Conference on Smart Cities and Green ICT Systems
230
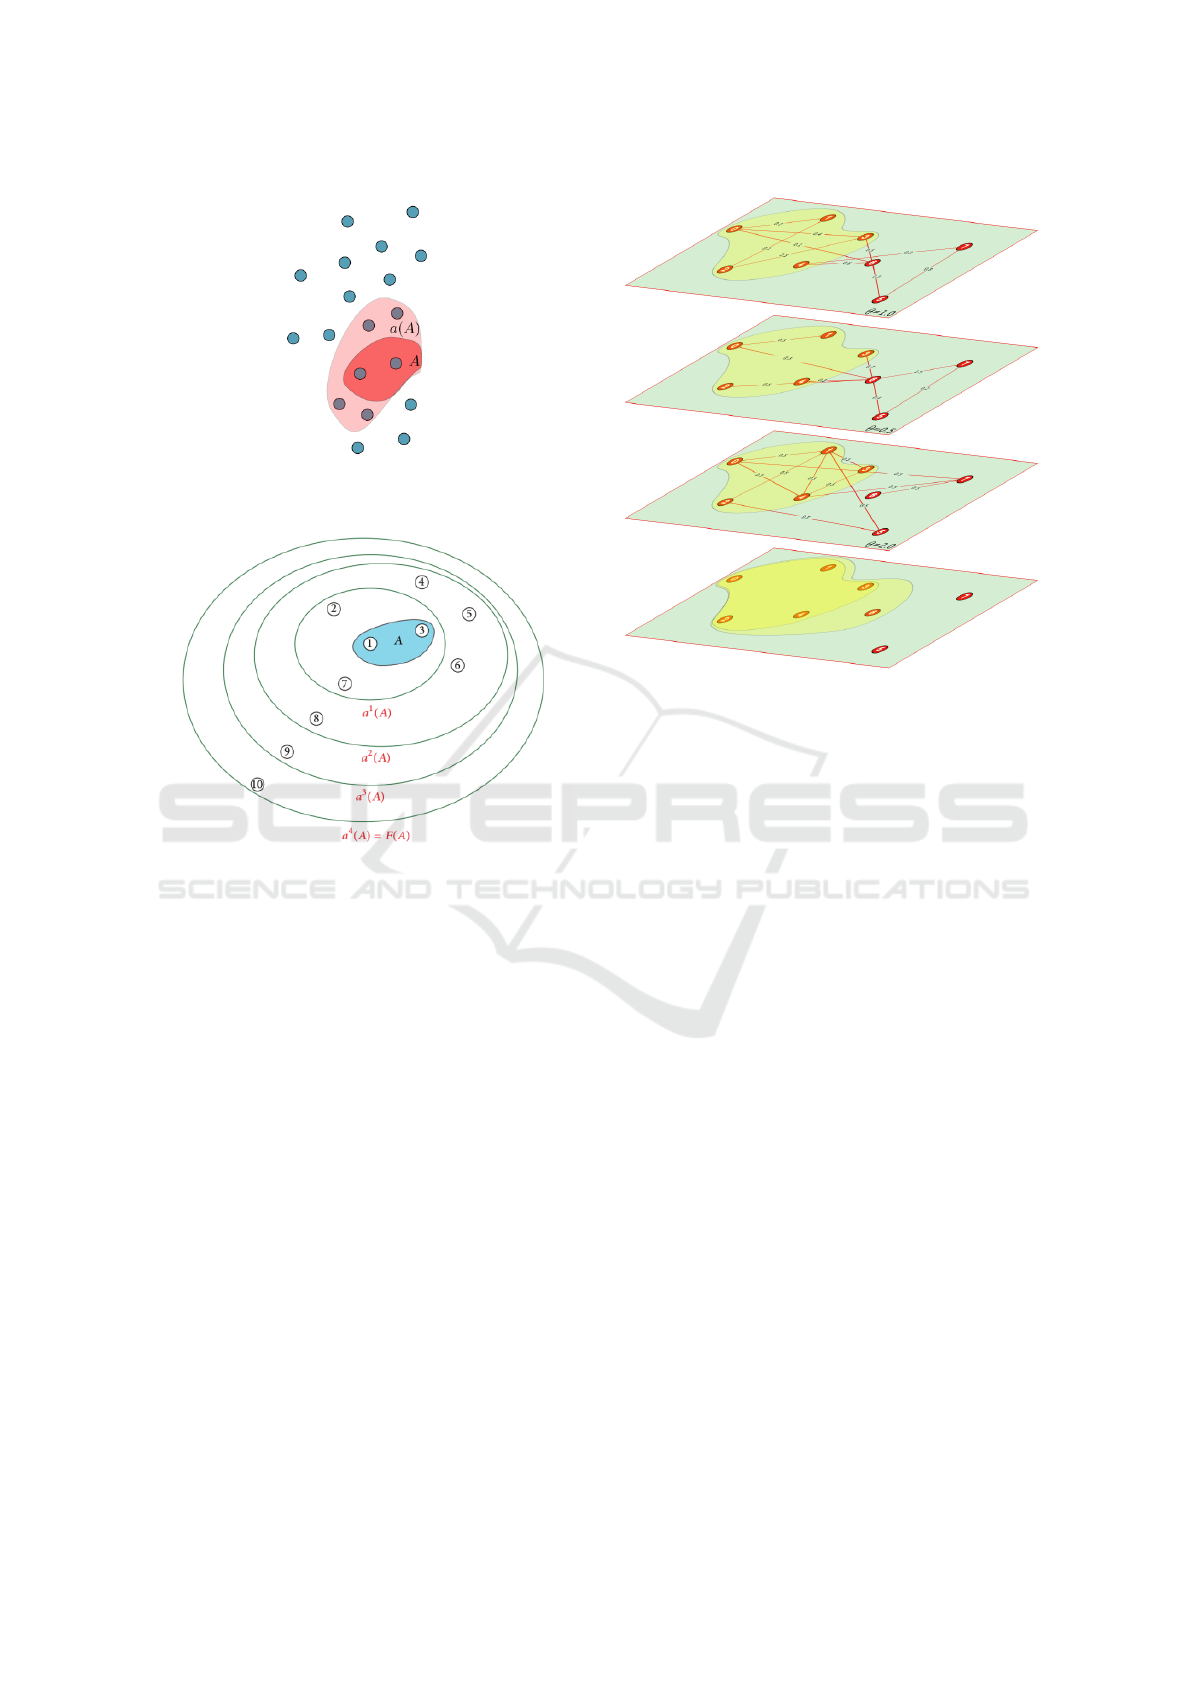
Figure 1: Example of a pseudoclosure function (Laborde,
2019).
Figure 2: Closure of set A (Laborde, 2019).
A pretopological space is defined by establishing
a relation between any set of items and a bigger set.
Each step of a pseudoclosure is interesting in the con-
struction of a hierarchy. An example of pseudoclosure
function is shown in Figure 1.
Now let us present our framework formalizing
a pretopological space adapted from Julio Laborde
works (Laborde, 2019). In this framework each
pretopological space is characterized by a tuple
(G, Θ, DNF(.)), where:
• G = {G
1
(V
1
, E
1
), G
2
(V
2
, E
2
), ..., G
n
(V
n
, E
n
)} is a
set of n weighted directed graphs.
• Θ = {θ
1
, θ
2
, ..., θ
n
} is a set of n thresholds, each
associated to one graph.
• DNF(.) : (℘(U), U ) → {True, False}, where
℘(U) is the power set of U, which is a boolean
function expressed as a positive disjunctive nor-
mal form in terms of the n boolean functions
V
1
(A, x), ..., V
n
(A, x), each associated to a graph,
and whose truth value depends on the set A and
the item x.
We determine if an item x ∈ U belongs to the pseu-
doclosure of a set A in the following way:
Figure 3: Example of a pseudoclosure under the framework
(Laborde, 2019).
• ∀V
i
(A, x), V
i
(A, x) = True ⇐⇒
∑
e
xy
∈G
i
,y∈A
w(e
xy
) ≥ θ
i
, where e
xy
is the edge
going from x to y, and w(e) is the weight of the
edge e.
• The item x ∈ U will belong to the pseudoclosure
of A ⇐⇒ the DNF(.) evaluates to True
Simply put, this checks in every graph if the sum
of the weights of the edges going from the item x to
the items inside A is bigger than the threshold asso-
ciated to the graph. When this happens, the boolean
variable associated to that graph acquires a value of
True, otherwise it gets a value of False. If DNF(.)
evaluates to True with those values for the boolean
functions V
i
(A, x), then the items belongs to the pseu-
doclosure. An example of this is illustrated in figure
3.
3.2 Algorithms
This section describes the algorithms used for the
construction of a closure and to build a hierarchical
clustering of sites.
The clustering procedure is structured in three
phases:
1. Calculation of a family of elementary sets called
seeds.
2. Construction of the subsets by applying pseudo-
closure iteratively.
Application of Pretopological Hierarchical Clustering for Buildings Portfolio
231

3. Establishing a structural relation among all the
subsets using quasihierarchy.
Calculation of a Family of Seeds: The purpose of
this procedure is to generate a small set from which
the elementary closure subset will be calculated. Cal-
culating those seeds from each item cause a lot of cal-
culation. This can be avoided by starting with sets of
2, 3 or 4 items.
A seed of multiple items is calculated by prox-
imity. The distance measure depends on the at-
tributes (numeric attributes, binary attributes, nominal
attributes, ordinal attributes, mixed-type attributes).
Construction of the Subset: This algorithm ap-
plies the pseudo-closure on the seeds. That will pro-
duce bigger sets. The pseudo-closure is applied iter-
atively until providing closure. Since we have started
applying the pseudoclosure on seeds, the closure we
have determined are called closure subsets. By keep-
ing the structure of all the pseudo-closure between
the seed and the closure subset, the algorithm keeps
a range of sets defining a hierarchy.
Construction of the Hierarchy from Subsets: Our
objective is now to determine a hierarchy between the
subsets, called quasihierarchy. The algorithm is build
following these rules:
• Two subsets are connected only if their intersec-
tion is not empty.
• The more of a set A is contained in a set B, the
stronger the relation from A to B.
• The bigger the set B is compared to A, the lesser
the part of A that should be contained in B to
have a strong relation going from A to B. In other
words, a very big set will attract smaller ones even
if their intersection is not very large.
• Two sets that have a mutualy strong relation are
considered equivalent, unless one is contained in
the other, in which case the bigger of the two is a
parent of the other in the quasihierarchy.
The algorithm takes as input a set of subsets and a
threshold, and returns a quasihierarchy by (see Fig.
4):
• Quantifying the relation between each pair of sets
determined with non-empty intersection.
• Creating a link in the quasihierarchy when the
value of the relation is above the threshold.
• Sets having links going in both direction are con-
sidered equivalent and one is selected randomly.
• The resulting closures with the respective links
determine the quasihierarchy.
Figure 4: Construction of the quasihierarchy (Laborde,
2019).
3.3 Model Validation and Visualization
of Results
Validation Tool: To evaluate the pretopological hi-
erarchical clustering, we also provide a set of tools to
validate the model and to show the results.
This program is developed to create a dataset of
points with the following parameters:
- the number of groups of dense items;
- the number of items of each group;
- the spatial dispersion of each group;
- the position of each group.
To evaluate multi-criteria clustering, the size of an
item is added as a second parameter. Groups with
different item size can be produced with the following
parameters:
- the number of groups;
- the number of items of each group;
- the range of sizes of each group.
This program helps to evaluate our method in differ-
ent kinds of situations and make corrections or adjust-
ments easily.
Visualization Tool: To observe the results of the
classification, the program colors each of the biggest
sets determined by our algorithm in a unique color.
The validation tool is tested with two groups of items
with both big and small size and a 2-dimensional po-
sition. Items are shown on figure 5. In this example,
four clusters have been determined: blue, green, or-
ange and red. The black dot at the leftest side of the
figure 5 is an item identified by the algorithms as an
outlier. For example red and orange items are close
to one another yet separated into two clusters because
of their different sizes and orange and green points
are similar in size yet divided into two sets because of
their different positions.
The program also displays the hierarchical classi-
fication composed of the seeds, the intermediate sets
and the final clusters. The hierarchical classification
is displayed as a tree in which each set is identified by
a number and is represented as a node.
SMARTGREENS 2021 - 10th International Conference on Smart Cities and Green ICT Systems
232
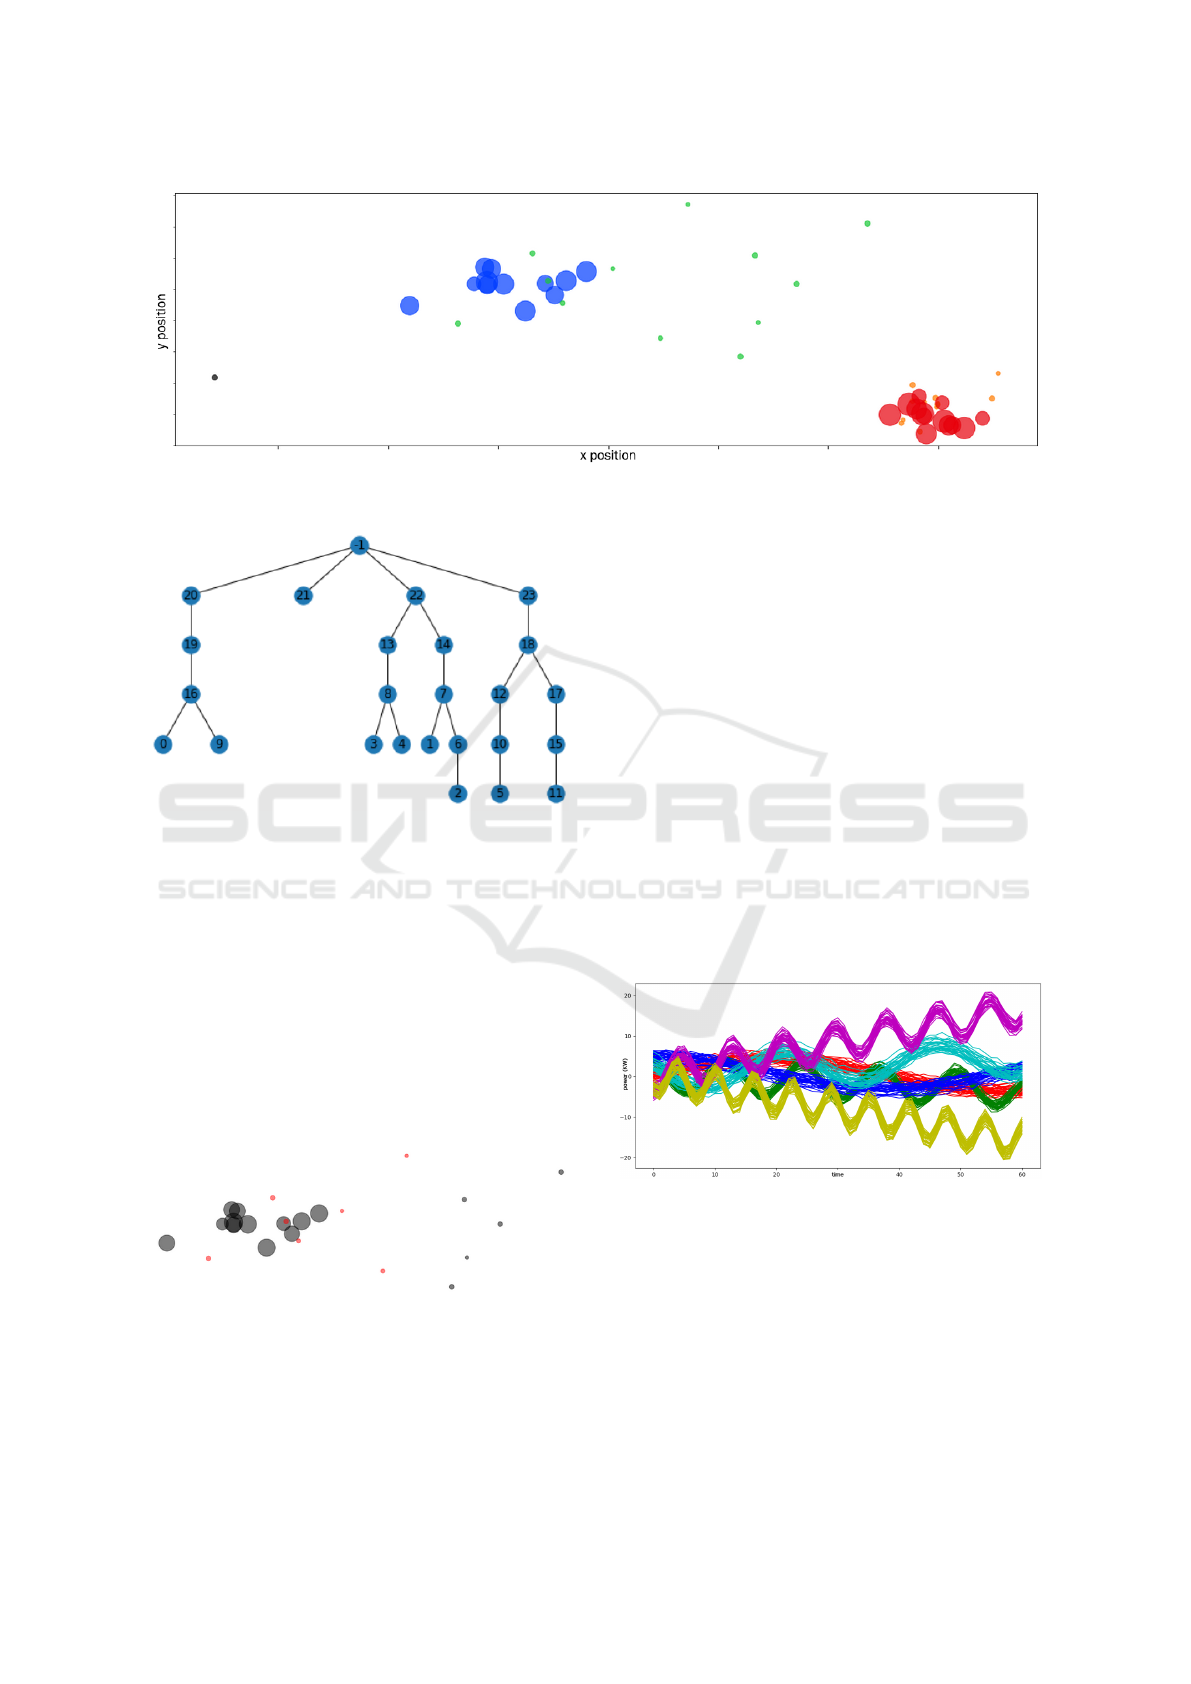
Figure 5: The four clusters determined by our algorithm using both size and position as parameters, on a 2D disks dataset.
Figure 6: A tree representing the pseudohierarchy relation
between each intermediate set from the seed to the cluster.
For instance, the hierarchy presented in figure 6
shows the relations between the sets determined by
our algorithm applied to the dataset displayed on fig-
ure 5. This tree presents only the sets of more than
two items. We can recognize the four clusters that
were colored on figure 5, they are entitled 20, 21, 22
and 23. The figure 7 displays the set 14 which is a
child of the set 21 (colored in green) in the hierarchi-
cal clustering. This hierarchy determines large groups
of relatively similar items and provides more details
about smaller groups of very similar items.
Figure 7: The subset 14 in red representing a subgroup of
the green clusters (subset 22) in figure 5.
4 EXPERIMENTS AND RESULTS
4.1 Benchmark Dataset
Because the main data we have on sites are power
consumption time series, the clustering of a set of
time series had to be tested, visualized and evaluated.
This section presents this test set and the results of
our algorithm. The created test set, composed of six
clusters is presented on figure 8. Each clusters is com-
posed of 30 time series of 60 points.
The similarity measure used to establish the value
between two items is Pearson’s coefficient. The Pear-
son correlation coefficient measures the linear rela-
tionship between each pair of items, which in this case
are time series.
Our program colored the time series according to
the clusters it had determined (see figure 8).
Figure 8: The clusters identified by our algorithm.
4.2 Results Analysis on Benchmark
Dataset
The program identified the exact same clusters as the
ground truth given by the benchmark. To evaluate the
validity of the clusters determined by the algorithm,
our metric is the Adjusted Rand Score also called Ad-
justed Rand Index (ARI). Since we perfectly identi-
fied the clusters the ARI of our clustering is 1. The
Application of Pretopological Hierarchical Clustering for Buildings Portfolio
233
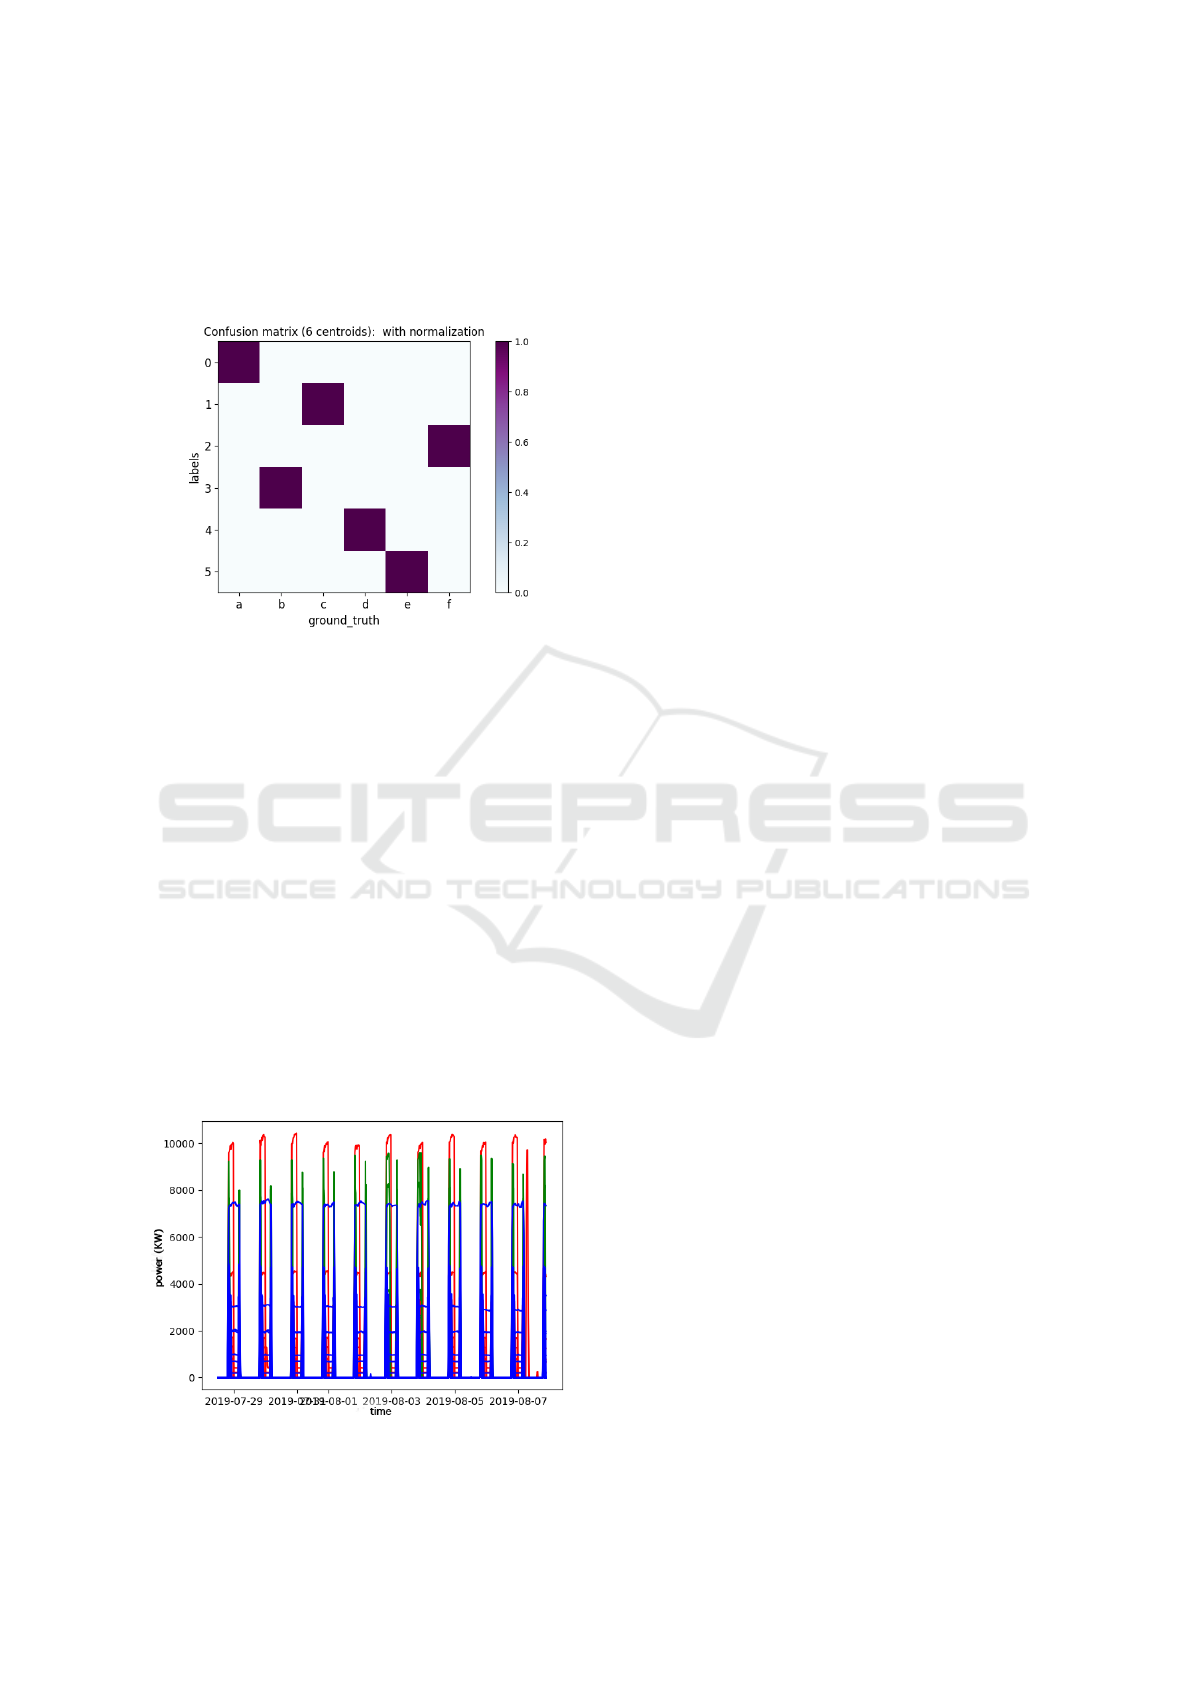
figure 9 shows the confusion matrix between the clus-
ter found by our method and the ground truth given by
the benchmark.
Further experiments will be conducted in a future
contribution.
Figure 9: Confusion matrix of the clusterization.
4.3 Real Dataset
This dataset is build from Enedis (Power Grid Oper-
ator in France) consumption times series of 400 sites
over a year. It is resampled with a time step of half
an hour, a day, a week and a month. The proxim-
ity between the Enedis delivery points is evaluated
on each resampled time series, each resampled time
series corresponding to one characteristic of a site.
Once the Enedis data set is build, the algorithm de-
scribed in section 3 is applied on the time series.
4.4 Result Analysis on Real Dataset
Figure 10, displays the clustering of 50 Enedis time
series representing the whole clusters. Three clusters
were identified, in the red clusters there is a single
peak per day that lasts for half the day, in the green
Figure 10: Clustering of the Enedis time series.
cluster there are two peaks a day, one in the morning,
one in the evening, and in the blue cluster the con-
sumption is constant during the day.
The algorithm has identified relevant clusters in
the sense that each items shares one trait with the
items of their clusters that they don’t share with items
of a different cluster.
5 CONCLUSION
Important energy savings can be made by acquiring
better insight over building consumption profiles. To
determine what savings can be made on a building, an
important element is to compare its energy consump-
tion with the one of other buildings. However, energy
systems (building and sites) are heterogeneous, com-
plex, and are described by numerical and categorical
data as well as consumption time series and are there-
fore hard to compare to one another. Hence the need
for an adapted clustering method. Studying the state
of the art methods of clustering made us create a new
hierarchical algorithm based on pretopology. Indeed,
pretopology theory provides tools to determine rela-
tion of proximity between heterogeneous sets. These
algorithms were developed in a Python library along-
side tools of visualization and evaluation. Results on
generated test data sets demonstrated the efficiency
and the relevance of this library.
ACKNOWLEDGEMENTS
This paper is the result of research conducted at the
energy data management company Energisme. We
thank Energisme for the resources that have been
made available to us and Julio Laborde for his assis-
tance with the conception of our pretopological hier-
archical algorithm library.
REFERENCES
Ahat, M., Amor, S. B., Bui, M., Bui, A., Gu
´
erard, G.,
and Petermann, C. (2013). Smart Grid and Opti-
mization. American Journal of Operations Research,
03(01):196–206.
Auray, J.-P., Bonnevay, S., Bui, M., Duru, G., and Lamure,
M. (2009). Pr
´
etopologie et applications : un
´
etat
de l’art. Studia Informatica Universalis (Hermann),
7:27–44.
Bosom, J., Scius-Bertrand, A., Tran, H., and Bui, M.
(2018). Multi-agent architecture of a mibes for smart
energy management. Innovations for Community Ser-
vices. I4CS 2018, 863.
SMARTGREENS 2021 - 10th International Conference on Smart Cities and Green ICT Systems
234

Fleischhacker, A., Lettner, G., Schwabeneder, D., and Auer,
H. (2019). Portfolio optimization of energy communi-
ties to meet reductions in costs and emissions. Energy,
173:1092 – 1105.
Gao, X. and Malkawi, A. (2014). A new methodology for
building energy performance benchmarking: An ap-
proach based on intelligent clustering algorithm. En-
ergy and Buildings, 84:607 – 616.
Guerard, G., Pichon, B., and Nehai, Z. (2017). Demand-
response: Let the devices take our decisions. In
SMARTGREENS, pages 119–126.
Gu
´
erard, G., Ben Amor, S., and Bui, A. (2015). A context-
free smart grid model using pretopologic structure. In
2015 International Conference on Smart Cities and
Green ICT Systems (SMARTGREENS), pages 1–7.
Habib, U., Zucker, G., Blochle, M., Judex, F., and Haase, J.
(2015). Outliers detection method using clustering in
buildings data. In IECON 2015-41st Annual Confer-
ence of the IEEE Industrial Electronics Society, pages
000694–000700. IEEE.
Iglesias, F. and Kastner, W. (2013). Analysis of similarity
measures in times series clustering for the discovery
of building energy patterns. Energies, 6(2):579–597.
Kriegel, H.-P., Kr
¨
oger, P., Sander, J., and Zimek, A.
(2011). Density-based clustering. Wiley Interdisci-
plinary Reviews: Data Mining and Knowledge Dis-
covery, 1(3):231–240.
Laborde, J. (2019). Pretopology, a mathematical tool for
structuring complex systems: methods, algorithms
and applications. PhD thesis, EPHE.
Li, K., Ma, Z., Robinson, D., Lin, W., and Li, Z. (2020).
A data-driven strategy to forecast next-day electricity
usage and peak electricity demand of a building port-
folio using cluster analysis, cubist regression models
and particle swarm optimization. Journal of Cleaner
Production, 273:123115.
Li, K., Yang, R. J., Robinson, D., Ma, J., and Ma, Z. (2019).
An agglomerative hierarchical clustering-based strat-
egy using shared nearest neighbours and multiple dis-
similarity measures to identify typical daily electricity
usage profiles of university library buildings. Energy,
174:735 – 748.
Lu, Y., Tian, Z., Peng, P., Niu, J., Li, W., and Zhang,
H. (2019). Gmm clustering for heating load patterns
in-depth identification and prediction model accuracy
improvement of district heating system. Energy and
Buildings, 190:49 – 60.
Marquant, J. F., Bollinger, L. A., Evins, R., and Carmeliet,
J. (2018). A new combined clustering method to anal-
yse the potential of district heating networks at large-
scale. Energy, 156:73 – 83.
Miller, C. (2016). Screening Meter Data: Characterization
of Temporal Energy Data from Large Groups of Non-
Residential Buildings. PhD thesis, ETH Zurich.
Wang, S., Liu, H., Pu, H., and Yang, H. (2020). Spatial dis-
parity and hierarchical cluster analysis of final energy
consumption in china. Energy, 197:117195.
Xu, D. and Tian, Y. (2015). A comprehensive survey
of clustering algorithms. Annals of Data Science,
2(2):165–193.
Application of Pretopological Hierarchical Clustering for Buildings Portfolio
235
