
Deep Learning for COVID-19 Prediction based on Blood Test
Ziyue Yu
1
, Lihua He
1
, Wuman Luo
1,2
, Rita Tse
1,2
and Giovanni Pau
3,1,4
1
School of Applied Sciences, Macao Polytechnic Institute, Macao, SAR, China
2
Engineering Research Centre of Applied Technology on Machine Translation and Artificial Intelligence
of Ministry of Education, Macao Polytechnic Institute, Macao, SAR, China
3
Department of Computer Science and Engineering, University of Bologna, Bologna, Italy
4
UCLA Computer Science Department, Los Angeles, U.S.A.
Keywords: Covid-19, Deep Learning, Blood Test, CNN+BI-GRU.
Abstract: The COVID-19 pandemic is highly infectious and has caused many deaths. The COVID-19 infection diagno-
sis based on blood test is facing the problems of long waiting time for results and shortage of medical staff.
Although several machine learning methods have been proposed to address this issue, the research of COVID-
19 prediction based on deep learning is still in its preliminary stage. In this paper, we propose four hybrid
deep learning models, namely CNN+GRU, CNN+Bi-RNN, CNN+Bi-LSTM and CNN+Bi-GRU, and apply
them to the blood test data from Israelta Albert Einstein Hospital. We implement the four proposed models
as well as other existing models CNN, CNN+LSTM, and compare them in terms of accuracy, precision, recall,
F1-score and AUC. The experiment results show that CNN+Bi-GRU achieves the best performance in terms
of all the five metrics (accuracy of 0.9415, F1-score of 0.9417, precision of 0.9417, recall of 0.9417, and AUC
of 0.91).
1 INTRODUCTION
The Coronavirus Disease (COVID-19) is a global
pandemic with high infectiousness and fatality rate.
According to Johns Hopkins University (Johns Hop-
kins University, 2021), as of January 9, 2021, the
worldwide COVID-19 death toll has passed 1.9 mil-
lion, and the number of confirmed cases has exceeded
88.9 million. To make matters worse, the newly
emerged COVID-19 variants are 70% more infec-
tious than the original virus (World Health Organiza-
tion, 2020). Facts have proved that “early detection,
reporting, isolation and treatment” is the most effec-
tive way to prevent the rapid spread of the virus and
minimize the infected number (World Health Organ-
ization, 2020). Therefore, frequent routine test plays
a critical role in the battle against COVID-19.
Typically, there are two important ways of
COVID-19 routine tests, i.e., the blood test and the
nucleic acid test. The nucleic acid is currently widely
used because of its simplicity. However, its false-neg-
ative rate can be as high as 20%. The blood test out-
performs the nucleic acid test in that its false positives
and false negatives are much smaller than those of the
nucleic acid test (Ferrari et al, 2020). The blood test
can not only effectively avoid missing true positive
cases but detect seasonal coronaviruses patients with
false-positive results, thereby avoiding unnecessary
isolation (Peeling et al, 2020). However, pure medical
approach for the blood test is confronted with two ma-
jor problems. First, the blood test is time-consuming
and usually takes several days to get the test result
(World Health Organization, 2020). Second, the
shortage of medical staff for COVID-19 blood test is
very common (Wynants et al, 2020), especially in de-
veloping countries. As a result, patients usually have
to wait a long time (sometimes as long as several
weeks) after the blood is drawn to get the results
(Amanda et al, 2020).
To address these issues, we adopt deep learning
approaches for COVID-19 prediction based on the
blood test. The objective is to relieve the medical staff
from the heavy testing work and speed up the testing
process. So far, artificial intelligence is becoming in-
creasingly important in the area of medical diagnosis
(He et al, 2019). However, the research of COVID-19
prediction based on deep learning is still in its prelim-
inary stage. In 2020, Alakus et al. applied six deep
learning models to the blood test data from Hospital
Israelita Albert, among which the hybrid model of
Yu, Z., He, L., Luo, W., Tse, R. and Pau, G.
Deep Learning for COVID-19 Prediction based on Blood Test.
DOI: 10.5220/0010484601030111
In Proceedings of the 6th International Conference on Internet of Things, Big Data and Security (IoTBDS 2021), pages 103-111
ISBN: 978-989-758-504-3
Copyright
c
2021 by SCITEPRESS – Science and Technology Publications, Lda. All rights reserved
103

convolutional neural network (CNN) and Long Short-
Term Memory (LSTM) achieved the best prediction
accuracy of 92.3% (Alakus et al, 2020). Other pro-
posed machine learning methods for COVID-19 pre-
diction based on blood test include decision trees
(DT), random forests (RF), support vector machines
(SVM), logistic regression (LR). However, the pre-
diction accuracies of these machine learning models
are suboptimal (around 80-85%) compared with the
deep learning methods (Jiang et al, 2020) (Batista et
al, 2020) (Cabitza et al, 2020).
In this paper, we explore deep learning methods
for COVID-19 prediction and propose a prediction
system which contains four hybrid deep learning
models including CNN+Gated Recurrent Unit
(GRU), CNN+Bidirectional RNN (Bi-RNN),
CNN+Bidirectional Long Short-Term Memory
(CNN+Bi-LSTM), CNN+Bidirectional GRU
(CNN+Bi-GRU). The blood test data are from Hospi-
tal Israelita Albert Einstein and have been used in the
work of Alakus et al (Alakus et al, 2020). We evaluate
the performance of the proposed system in terms of
accuracy, precision, F1-Score, recall and AUC. And
the experiment results show that the proposed hybrid
model CNN+Bi-GRU outperforms the best model
(CNN+LSTM) proposed by Alakus et al (Alakus et al,
2020) in terms of the five evaluation metrics. In sum-
mary, the main contributions of this paper are as fol-
lows:
• We design and implement four hybrid deep
learning models including CNN+GRU,
CNN+Bi-RNN, CNN+Bi-LSTM and
CNN+Bi-GRU for COVID-19 prediction. And
we use 18 attributes of blood test data from
Hospital Israelita Albert Einstein for model
training.
• We also implement two models proposed by
Alakus et al (Alakus et al, 2020), i.e., CNN and
CNN+LSTM, and conduct extensive compari-
sons among these six models in terms of accu-
racy, precision, F1-Score, recall and AUC. The
blood test data used in this work are from Hos-
pital Israelita Albert Einstein provided by Ala-
kus et al (Alakus et al, 2020).
• The experiment results show that the values of
accuracy, precision, F1-Score, recall and AUC
of the proposed hybrid model CNN+Bi-GRU
are 0.9415, 0.9417, 0.9417, 0.9417 and 0.91,
respectively, which are better than those of the
best model (CNN+LSTM) proposed by Alakus
et al (Alakus et al, 2020).
The rest of this paper is organized as follows. Re-
lated work of our research will be given in Section 2.
Section 3 describes the blood test data and the pro-
posed deep learning models. We provide a thorough
experiment study and performance comparison in
Section 4. In Section 5, we give a conclusion of the
paper.
2 RELATED WORK
Nowadays, AI plays an important role in assisting
medical diagnosis. For example, CNN could be used
for the early detection of cancer (Dlamini et al, 2020).
Recurrent neural network (RNN) used for the diagno-
sis of Alzheimer’s disease (Cui et al, 2020). For
COVID-19 prediction, existing AI approaches can be
classified into two categories, namely general ma-
chine learning methods and deep learning methods.
Both machine learning and deep learning can be used
to solve classification problems.
2.1 Machine Learning
In 2020, Jiang et al. proposed five machine learning
models including LR, DT, RF, K-Nearest-Neighbor
(KNN) and SVM for COVID-19 prediction. They ap-
plied the models to the data from Wenzhou Central
Hospital and Cangnan People’s Hospital. The data
contain 53 blood samples from 53 hospitalized pa-
tients, each of which has 10 blood indicators (model
features) (Jiang et al, 2020). The core idea of LR is to
use existing data to establish a regression equation for
the classification. DT is a model used to observe and
realize the internal laws of data and to classify and
predict results for new data. RF inherits the idea of
DT. Differently, it uses the method of ensemble learn-
ing in which RF votes for the classification results of
several weak classifiers to form strong classifiers.
The idea of KNN is to calculate and compare the dis-
tances between the target point and the points of dif-
ferent categories in a given interval. And the category
of the target point will be determined by its k nearest
neighbors. SVM is a popular classification approach.
In 0-1 classification, SVM calculates the maximum
margin between two types of labeled data, based on
which establishes a hyperplane for classification. The
experiment results show that the best accuracy was
80% when using SVM. Besides the work of Jiang et
al., Batista et al. applied SVM, RF, LR and gradient
boosted trees for COVID-19 prediction based on the
data from Hospital Israelita Albert Einstein at Sao
Paulo Brazil (Batista et al, 2020). The number of pa-
tient samples is 235, and the number of blood indica-
tors (model features) for each sample is 13. Specifi-
IoTBDS 2021 - 6th International Conference on Internet of Things, Big Data and Security
104

cally, gradient boosted trees use DT as the basis func-
tion, and the model is built in the direction of the gra-
dient drop of the loss function for each time. The best
accuracy of their proposed models was 84.7% when
using RF. Another research team from Italy used the
data from San Raffaele Hospital with 1,925 patients
from February 2020 to May 2020. They selected 20
blood indicators as the model features in their study
(Cabitza et al, 2020). Their proposed models were LR,
Naïve Bayes, KNN, RF, and SVM, and the best ac-
curacy rate achieved 88% when using RF model.
2.2 Deep Learning
To the best of our knowledge, the research for deep
learning-based COVID-19 prediction is still in its pre-
liminary stage. One typical work is the prediction sys-
tem proposed by Alakus et al (Alakus et al, 2020).
This system contains six deep learning models includ-
ing artificial neural networks (ANN), CNN, RNN,
LSTM, CNN+RNN and CNN+LSTM. ANN refers to
the input layer, the hidden layer and the output layer
are in the form of full connection. CNN is widely used
in various scenarios such as image processing, text
processing and speech recognition. It contains the
convolutional layer, the pooling layer and the fully
connected layer. The convolutional layer is used for
extracting features, and the pooling layer can speed
up calculation and prevent overfitting. In addition,
shared weights and biases refer to the sharing of
weight parameters in the process of convolution and
pooling, which makes the model easier to optimize.
In summary, the main idea of CNN is to learn the spa-
tial hierarchies of features through backpropagation
by using multiple building blocks. RNN is suitable for
processing time series data, this model adds a hidden
state for recording historical information, and the ac-
tivation function uses Tanh to prevent the value from
changing too severely. LSTM includes forget gate, in-
put gate, output gate and the memory cell. The forget
gate refers to the information that needs to be forgot-
ten, the input gate refers to the information that needs
to flow into the memory cell, and the output gate re-
fers to the information that needs to flow into the hid-
den state. Memory cells are used to remember histor-
ical information. And the reason why the combination
of CNN and other deep learning models can usually
achieve better accuracy is that CNN has performed
feature extraction on the data in advance. Alakus et al.
used the blood test dataset including 600 patients
from Hospital Israelita Albert Einstein at Sao Paulo
Brazil, and selected 18 features for model training and
testing. The best accuracy achieved 92.3% when us-
ing CNN+LSTM, which is higher than existing ma-
chine learning models.
3 COVID-19 PREDICTION USING
DEEP LEARNING MODELS
Based on the work of Alakus et al., we propose and
implement four hybrid models for COVID-19 predic-
tion using blood test data. In this section, we intro-
duce the four proposed models, which share the same
general structure. This structure contains three convo-
lution layers, two MaxPool layers, one recurrent neu-
ral layer and one fully connected layer. The major dif-
ference between the four models is that they have
adopted four different variation of the recurrent neu-
ral layer, respectively, i.e., GRU, Bi-RNN, Bi-LSTM,
Bi-GRU. We set the same parameters for the four
models for the sake of fairness.
3.1 CNN+GRU
The first proposed hybrid model is CNN+GRU. GRU
is a variation of RNN. The hybrid model of CNN and
RNN was proposed in the work of Alakus et al. CNN
and RNN are complementary to each other in model-
ing capabilities (Sainath et al, 2020). Specifically,
CNN can extract features of different levels, while
RNN can provide short-term memory. Therefore,
combining them can improve the efficiency of diag-
nosis for COVID-19. However, one major problem of
RNN is gradient disappearance or explosion caused
by its iteration (Chung et al, 2014). To address this
issue, we propose GRU to replace RNN in the hybrid
model. The GRU network uses the cell to store infor-
mation, and the gated mechanism controls whether
the information needs to be retained in the cell. The
internal structure of GRU is shown in Figure 1. GRU
network has two gate control units, namely reset gate
𝑟
and update gate 𝑧. The reset gate controls whether
the information of historical state needs to be forgot-
ten. When the value of reset gate close to 0, the infor-
mation of historical state is forgotten, and the candi-
date state is only related to the current input. This
mechanism can discard some useless information to
reduce computational complexity. The update gate
controls whether the information of historical state
needs to be sent to the current state. When the value
of update gate value close to 0, the current state is
only related to the current input; when its value close
to 1, the current state is equal to the previous state.
Deep Learning for COVID-19 Prediction based on Blood Test
105
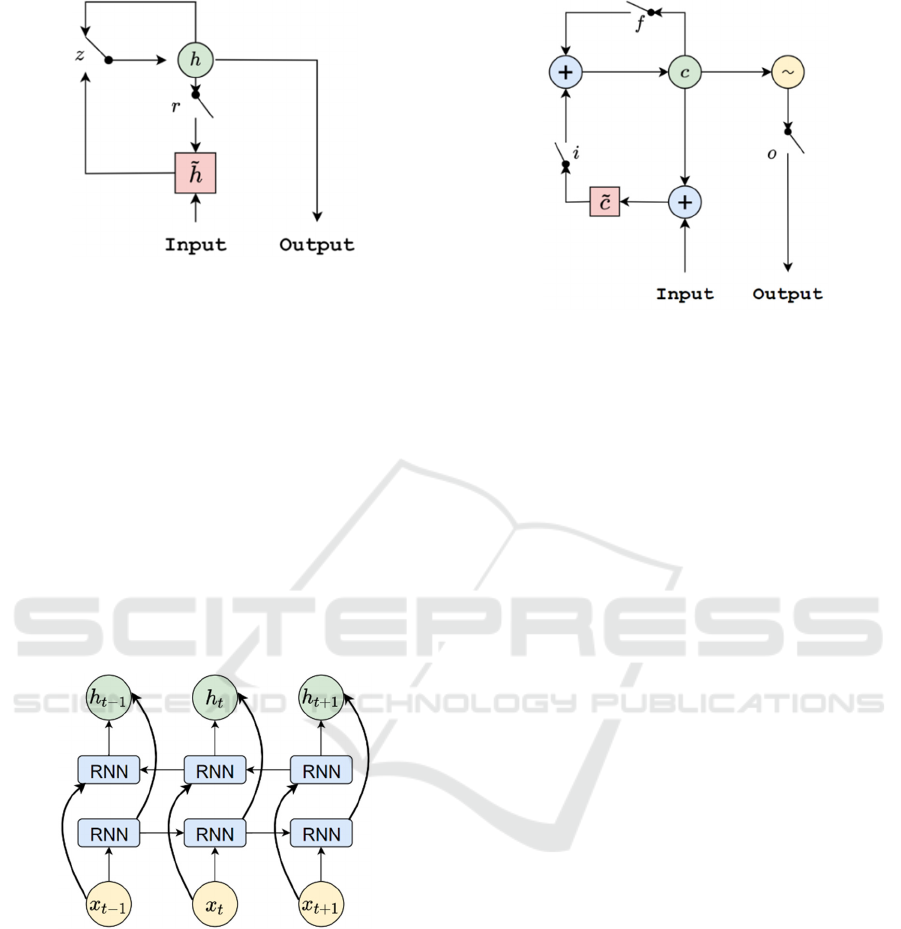
Figure 1: The Internal Structure of GRU.
3.2 CNN+Bi-RNN
The second proposed hybrid model is CNN+Bi-RNN.
The basic idea is to adopt the Bi-RNN to extract the
correlation between each different attributes of data.
Bi-RNN can increase contents in the memory of fu-
ture information (Schuster et al, 1997). This structure
allows the model to better understand the correlation
between current data and other data. The internal
structure of Bi-RNN is shown in Figure 2. It shows
that each training sequence has a forward network
and a backward network, both of which are RNN. The
two networks are connected with the output layer.
This structure provides the output layer with complete
data information about the past and future data.
Figure 2: The Internal Structure of Bi-RNN.
3.3 CNN+Bi-LSTM
The third proposed hybrid model is CNN+Bi-LSTM.
The basic observation is that, in order to simulate the
memory characteristics of biological networks, neu-
rons can use the current output information as the in-
put of the next neuron to form a ring network struc-
ture, which is a neural network with short-term
memory. LSTM is a good candidate to store short-
term memory, and this memory can be retained for a
long time.
Figure 3: The Internal Structure of LSTM.
Specifically, LSTM uses the memory cell to store
the information, and the gating mechanism helps the
model determine how much information passes in the
cell between a large time step (Sak et al, 2014). LSTM
includes the forget gate, input gate, output gate and
the memory cell, which are marked 𝑓, 𝑖, 𝑜, and 𝐶 in
the Figure 3. Forget gate controls whether infor-
mation from the long-time memory unit needs to be
forgotten at the last moment; input gate controls
whether input information is required to enter a long-
time memory unit; output gate controls whether infor-
mation from the long-time memory unit can be out-
putted; Cell is a storage unit for short-term memory.
The Bi-LSTM model is to add a forward network and
a backward network to a hidden layer of the tradi-
tional LSTM so that the correlation between the data
can be extracted.
3.4 CNN+Bi-GRU
The fourth proposed hybrid model is CNN+Bi-GRU,
which combines CNN and Bi-GRU networks. The
CNN+Bi-GRU uses CNN to extract features at differ-
ent layers from the data, and the Bi-GRU is used to
construct the correlation between each attributes of
blood test data. Figure 4 is the structure diagram of
the CNN+Bi-GRU network. Specifically, the input to
the network are the blood test data of each patient.
First, CNN network extracts the characteristics of the
blood attributes. Then, Bi-GRU extracts the correla-
tion between the attributes. Finally, SoftMax function
is adopted to predict whether COVID-19 is positive
or not. As shown in Table 1, the network has eight
layers: 1) three convolutional layers. The kernel size
of the convolutional layer is 256, 128 and 64 respec-
tively, after the first two convolutional layers, a drop-
out layer with 15% rate is used to prevent overfitting;
2) two pooling layers. The kernel size of the pooling
IoTBDS 2021 - 6th International Conference on Internet of Things, Big Data and Security
106
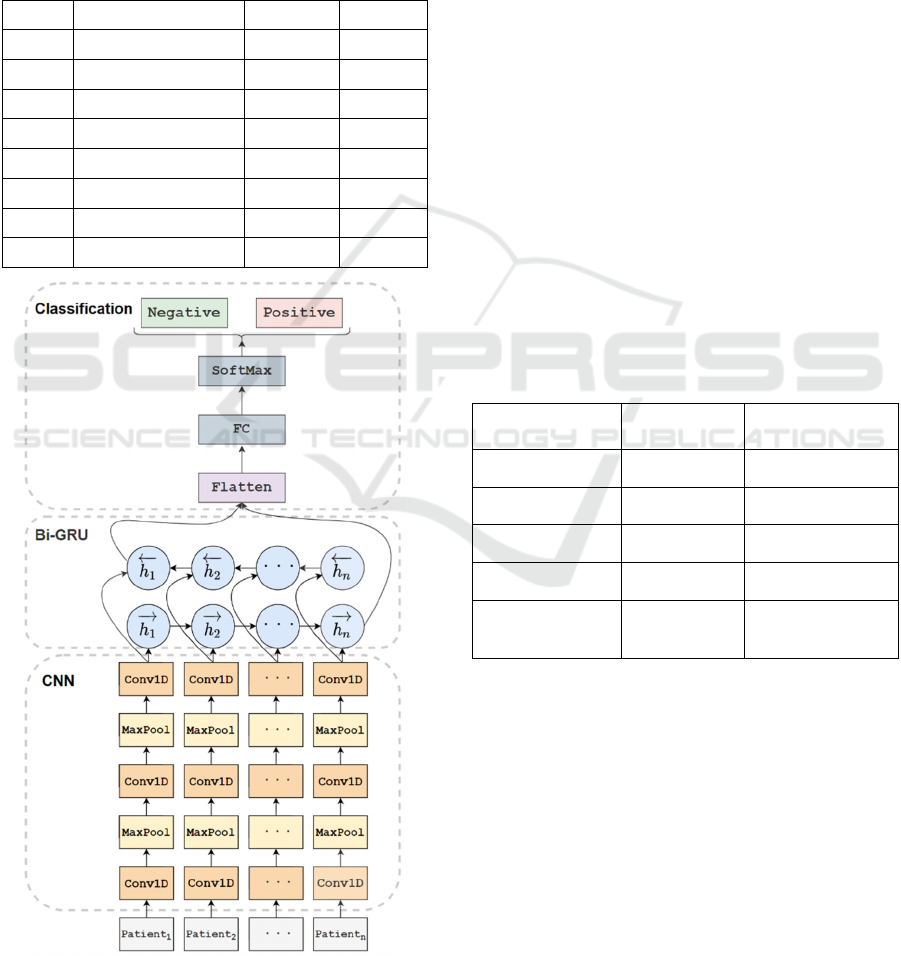
layer is 3; 3) one Bi-GRU layer. The hidden state di-
mension is set to 256, and Batch Normalization is
added to reduce the internal covariate offset. The ob-
jective is to speed up the deep network training; 4)
one fully connected layer. A dropout layer with rate
of 15% is used for reducing the risk of overfitting, and
5) one output layer with SoftMax function. The out-
put value indicates whether the COVID-19 infection
is negative or positive.
Table 1: The Summary of CNN+Bi-GRU.
Layer Type Kernel Stride
1 Convolution1D 256 3
2 MaxPool 3 3
3 Convolution1D 128 3
4 MaxPool 3 3
5 Convolution1D 64 3
6 Bi-GRU 256 -
7 Fully Connected 256 -
8 SoftMax 2 -
Figure 4: The Structure of CNN+Bi-GRU.
4 EXPERIMENT EVALUATION
In this section, we conduct experiments based on real
data, which are produced by Hospital Israelita Albert
Einstein in Sao Paulo Brazil. We first describe the da-
taset, the experiment environment and the evaluation
metrics. Then we use five metrics to evaluate the per-
formance of the six deep learning models. Finally, we
compare the results with previous studies.
4.1 Data
We use the real data from Hospital Israelita Albert
Einstein in Sao Paulo Brazil. The original data are
provided by the research team from Schwab (Schwab
et al, 2020), and include 111 laboratory results of
5644 different patients. These data were collected in
2020 from patients’ blood samples for COVID-19 in-
fection testing. The prevalence rate of the selected
data was 13.3%. To protect the patients’ privacy, all
the personal information is abandoned. Each row of
data represents the blood test information of an indi-
vidual. According to previous research (Alakus et al,
2020), we select 18 attributes as the features of the
proposed deep learning models. The attributes of the
blood test are listed in Table 2:
Table 2: Attributes of Selected Attributes.
Hematocrit Hemoglobin Monocytes
Serum Glucose Neutrophils Platelets
Red blood Cells Lymphocytes Leukocytes
Basophils Eosinophils Urea
Sodium Creatinine Potassium
Proteina C
reativa mg/dL
Alanine
transaminase
Aspartate trans-
aminase
4.2 Experiment Environment
We design the deep learning models using Python and
Keras package. The experiments are conducted using
a desktop with an 8GB memory Intel Core i7-2.9GHz
processor and a 4GB NVIDIA GeForce 940MX
graphical processor. We set 80% of the data as the
training set and 20% as the test set. The learning rate
is 0.001, the batch size is 30 and the epoch is 200.
Deep Learning for COVID-19 Prediction based on Blood Test
107
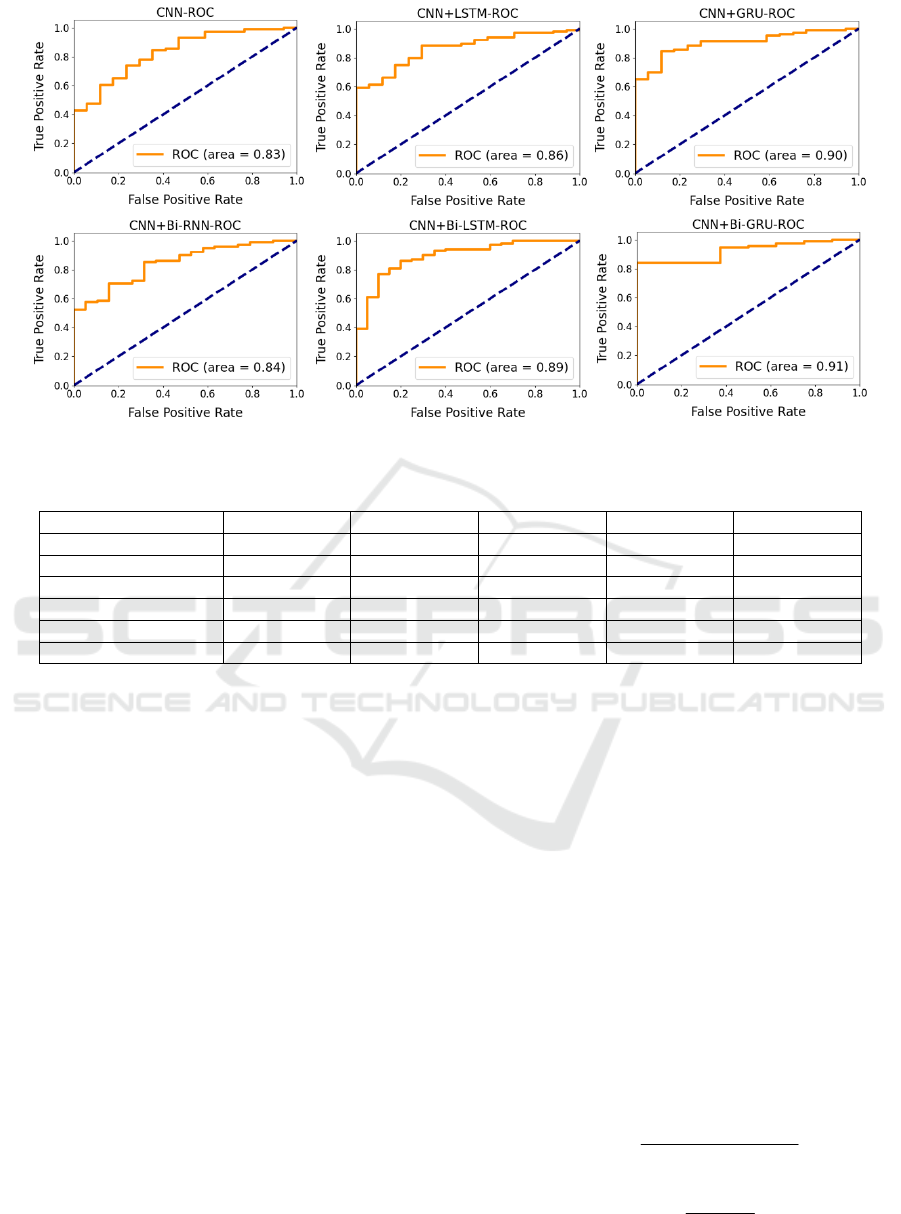
Figure 5: Deep Learning Models ROC Curves.
Table 3: Performance of Different Deep Learning Models.
Model Accuracy F1-Score Precision Recall AUC
CNN 0.8843 0.8843 0.8843 0.8843 0.83
CNN+LSTM 0.8545 0.8545 0.8545 0.8545 0.86
CNN+GRU 0.9210 0.9209 0.9210 0.9210 0.90
CNN+Bi-RNN 0.8786 0.8786 0.8786 0.8786 0.84
CNN+Bi-LSTM 0.8885 0.8885 0.8885 0.8885 0.89
CNN+Bi-GRU 0.9415 0.9417 0.9417 0.9417 0.91
4.3 Evaluation Metrics
In this work, for the sake of fairness, we adopt the
same five metrics as Alakus et al (
Alakus et al, 2020)
for performance evaluation, i.e., accuracy, F1-score,
precision, recall and area under the receiver operating
characteristic (AUC).
To calculate the metrics, the classification results
of the models are summarized in the form of a confu-
sion matrix. The matrix contains four different kinds
of values: 1) True Positive (TP) which means positive
classes are predicted to be positive; 2) True Negative
(TN) which means negative classes are predicted to
be negative; 3) False Positive (FP) which means neg-
ative classes are predicted to be positive, and 4) False
Negative (FN) which means positive classes are pre-
dicted to be negative. These four values can be used
to calculate accuracy, precision and recall. F1-score
is calculated based on precision and recall (Hossin et
al, 2015).
Specifically, accuracy refers to the proportion of
the samples (TP+TN) which have been correctly clas-
sified among the total number of samples
(TP+TN+FP+FN). It is the most common evaluation
metric for the classification tasks. Precision is the ra-
tio of the TP that belong to the predicted positives
(TP+FP). It indicates whether the model has a good
ability to discriminate between positive and negative
samples. Recall refers to the TP among the sum of the
TP and FN. It indicates the ability of the model to
classify the relevant results correctly. F1-score refers
to the harmonic average of the precision and recall. It
is a comprehensive metric to judge the ability of the
classification model. AUC is a method to evaluate the
performance of classifier. If the AUC value exceeds
0.8, the classifier can be regarded as excellent classi-
fier. If the AUC value is above 0.9, the classifier can
be regarded as outstanding (Mandrekar et al, 2010).
The calculation formulas of accuracy, precision, re-
call and F1-score are shown below.
TP+TN
Accuracy =
TN + FP + FN +TP
(1)
TP
Precision =
TP+ FP
(2)
IoTBDS 2021 - 6th International Conference on Internet of Things, Big Data and Security
108
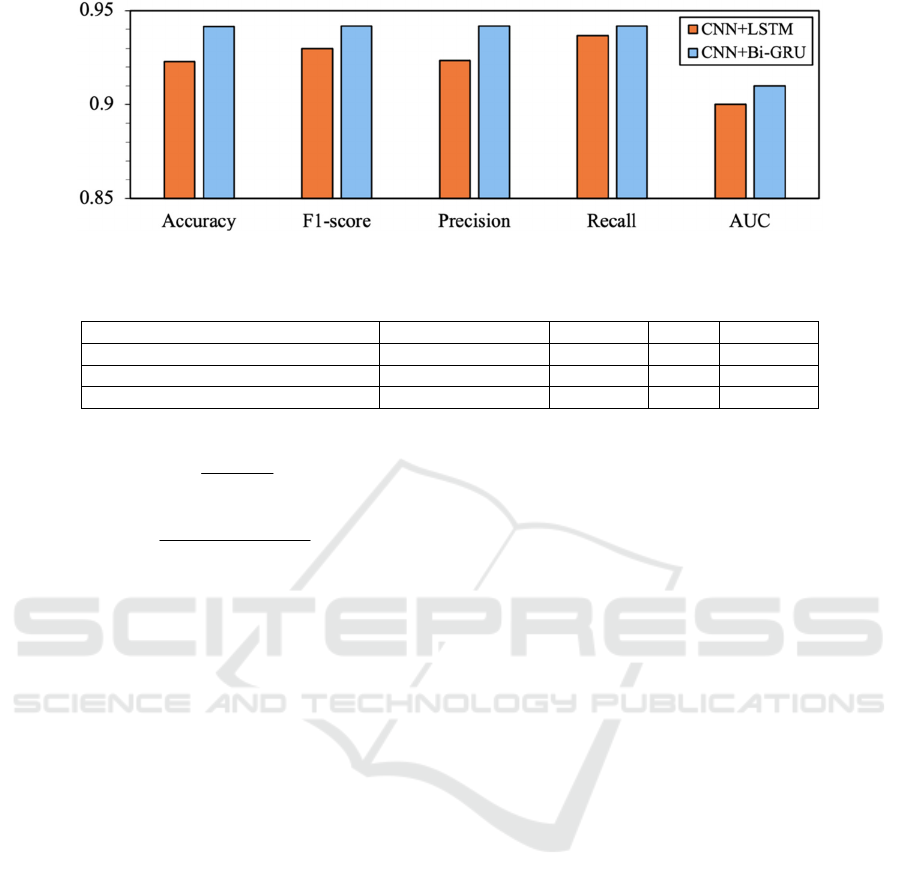
Figure 6: Comparison with CNN+Bi-GRU and CNN+LSTM.
Table 4: Comparison with Previous Studies.
Dataset Location Model Accuracy AUC F1-Score
Hospital Israelita Albert Einstein SVM, RF - 0.87 0.7200
Hospital Israelita Albert Einstein CNN+LSTM 0.9230 0.90 0.9300
Hospital Israelita Albert Einstein CNN+Bi-GRU 0.9415 0.91 0.9417
TP
Recall =
TP+ FN
(3)
Precision Recall
F1= 2
Precision Recall
×
×
+
(4)
4.4 Result Analysis
To make comprehensive comparisons, we implement
the four proposed model as well as the two models
(CNN and CNN+LSTM) proposed in the work of
Alakus et al. (Alakus et al, 2020). Besides, we use five
metrics to evaluate the six deep learning models, re-
spectively.
The Receiver operating characteristic (ROC)
curves of the six models are shown in Figure 5. Typ-
ically, the x-value of the ROC curve is the false posi-
tive rate (FPR), and the y-value of the ROC curve is
the true positive rate (TPR). For the ROC curve, the
area enclosed by the curve and the coordinate axis
represents the classification performance of the
model. The closer the area is equal to 1, the stronger
the classification ability of the model is, and vice
versa. In addition, we use the AUC value to describe
the area under the ROC curve and the coordinate axis.
AUC means that, if the sample is randomly selected,
the probability of the model can classify it into correct
category. Figure 5 shows that CNN+Bi-GRU model
gets the best results among all the six models, whose
AUC value achieves 0.91. It means that the model can
effectively classify positive cases.
Table 3 presents the performances of different
models in terms of different metrics. Specifically, it
shows that the AUC values of all hybrid models are
higher than the model CNN in the diagnosis of
COVID-19. And the three proposed hybrid models
CNN+GRU, CNN+Bi-LSTM, CNN+Bi-GRU out-
perform the model CNN in terms of the five metrics.
For CNN+LSTM and CNN+GRU model, the experi-
ment results show that the CNN+GRU model signif-
icantly improved the accuracy, F1-score, precision,
recall and AUC over CNN+LSTM. The basic idea of
GRU and LSTM is to reduce the problem of gradient
disappearance while retaining long-term sequence in-
formation. But GRU has a simpler network structure
than LSTM, which can accelerate the training and
convergence of the network. So, the CNN+GRU
model has achieved better results in our experiments.
Comparing the experimental results of CNN+GRU
and CNN+Bi-GRU models, we find that the values of
the five metrics of Bi-GRU are all better than those of
GRU. This is because the training data contain 18 at-
tributes from blood test. The correlation between the
data attributes is therefore a very important feature.
The bidirectional structure of Bi-GRU can better
model the correlations between each blood attribute.
Therefore, CNN+Bi-GRU has better evaluation per-
formances than CNN+GRU.
Figure 6 shows the detailed comparisons between
CNN+Bi-GRU and CNN+LSTM. For the sake of
fairness, we adopt the experiment results of
CNN+LSTM from the paper of Alakus et al (Alakus
et al, 2020), which are much higher than those of our
CNN+LSTM experiment results. The comparison re-
sults show that our proposed model CNN+Bi-GRU
outperforms CNN+LSTM in terms of all the five met-
rics.
Table 4 shows the comparison between CNN+Bi-
GRU and the work of Batista et al and Alakus et al.
Deep Learning for COVID-19 Prediction based on Blood Test
109

Batista et al used SVM and RF, and the best results
are 0.87 of AUC and 0.72 of F1-score. According to
Alakus et al, the best accuracy, AUC and F1-score of
CNN+LSTM are 0.9230, 0.90 and 0.93, respectively.
Our proposed CNN+Bi-GRU model provides the best
performance whose accuracy, AUC and F1-score are
0.9415, 0.91 and 0.9417, both higher than SVM, RF
and CNN+LSTM. Overall, the performance of
CNN+Bi-GRU is better than the other existing mod-
els.
5 CONCLUSIONS
In this paper, four hybrid deep learning models are
proposed to predict COVID-19 infection based on
blood test, i.e., CNN+GRU, CNN+Bi-RNN,
CNN+Bi-LSTM and CNN+BiGRU. Besides, 18 in-
dicators from the blood test data are selected as fea-
tures, and five metrics are adopted to evaluate the
model performance, namely accuracy, F1-score, pre-
cision, recall and AUC. Experiment results show that
CNN+Bi-GRU model outperforms the proposes
models of Alakus et al in terms of all the evaluation
metrics. We believe that CNN+Bi-GRU model will
be an effective supplementary method for COVID-19
diagnosis based on blood test. In the future, we will
continue explore deep learning models for COVID-
19 prediction and design novel prediction models.
ACKNOWLEDGMENT
This work was supported in part by the Macao Poly-
technic Institute – Big Data-Driven Intelligent Com-
puting (RP/ESCA-05/2020).
REFERENCES
Johns Hopkins University (2021). COVID-19 infection
Dashboard from Johns Hopkins University System Sci-
ence and Engineering Centre. Retrieved from
https://www.arcgis.com/apps/opsdashboard/in-
dex.html#/bda7594740fd40299423467b48e9ecf6
World Health Organization (2020). Disease Outbreak News
of 2020 December: Important Notices of SARS-CoV2
Variant - Unite Kingdom. Retrieved from
https://www.thenewsmarket.com/news/disease-out-
break-news--sars-cov-2-variant---united-king-
dom/s/c25fc68f-3676-4741-abd1-928b7aec0eb9
World Health Organization (2021). Coronavirus disease
(COVID-19) advice for the public. Retrieved from
https://www.who.int/emergencies/diseases/novel-coro-
navirus-2019/advice-for-public
Ferrari, D., Sabetta, E., Ceriotti, D., Motta, A., Strollo, M.,
Banfi, G., & Locatelli, M. (2020). Routine blood anal-
ysis greatly reduces the false-negative rate of RT-PCR
testing for COVID-19. Acta Bio Medica: Atenei
Parmensis, 91(3), e2020003.
Peeling, R. W., Wedderburn, C. J., Garcia, P. J., Boeras, D.,
Fongwen, N., Nkengasong, J., & Heymann, D. L.
(2020). Serology testing in the COVID-19 pandemic re-
sponse. The Lancet Infectious Diseases.
World Health Organization (2020). Coronavirus disease
(COVID-19), health topics. Retrieved from
https://www.who.int/emergencies/diseases/novel-coro-
navirus-2019/question-and-answers-hub/q-a-de-
tail/coronavirus-disease-covid-19
Wynants, L., Van Calster, B., Collins, G. S., Riley, R. D.,
Heinze, G., Schuit, E., & van Smeden, M. (2020). Pre-
diction models for diagnosis and prognosis of covid-19:
systematic review and critical appraisal. bmj, 369.
Amanda, B., Meredith, G. (2020). How long does it take to
get COVID-19 test results? Retrieved from
https://www.medicalnewstoday.com/articles/corona-
virus-covid-19-test-results-how-long
He, J., Baxter, S. L., Xu, J., Xu, J., Zhou, X., & Zhang, K.
(2019). The practical implementation of artificial intel-
ligence technologies in medicine. Nature medicine,
25(1), 30-36.
Jiang, X., Coffee, M., Bari, A., Wang, J., Jiang, X., Huang,
J., & Huang, Y. (2020). Towards an artificial intelli-
gence framework for data-driven prediction of corona-
virus clinical severity. CMC: Computers, Materials &
Continua, 63, 537-51.
De Moraes Batista, A. F., Miraglia, J. L., Donato, T. H. R.,
& Chiavegatto Filho, A. D. P. (2020). COVID-19 diag-
nosis prediction in emergency care patients: a machine
learning approach. medRxiv.
Cabitza, F., Campagner, A., Ferrari, D., Di Resta, C.,
Ceriotti, D., Sabetta, E., ... & Carobene, A. (2020). De-
velopment, evaluation, and validation of machine learn-
ing models for COVID-19 detection based on routine
blood tests. Clinical Chemistry and Laboratory Medi-
cine (CCLM), 1(ahead-of-print).
Alakus, T. B., & Turkoglu, I. (2020). Comparison of deep
learning approaches to predict COVID-19 infection.
Chaos, Solitons & Fractals, 140, 110120.
Dlamini, Z., Francies, F. Z., Hull, R., & Marima, R. (2020).
Artificial intelligence (AI) and big data in cancer and
precision oncology. Computational and Structural Bio-
technology Journal.
Cui, R., Liu, M., & Alzheimer's Disease Neuroimaging In-
itiative. (2019). RNN-based longitudinal analysis for
diagnosis of Alzheimer’s disease. Computerized Medi-
cal Imaging and Graphics, 73, 1-10.
Sainath, T. N., Vinyals, O., Senior, A., & Sak, H. (2015,
April). Convolutional, long short-term memory fully
connected deep neural networks. In 2015 IEEE Interna-
tional Conference on Acoustics, Speech and Signal Pro-
cessing (ICASSP) (pp. 4580-4584). IEEE.
IoTBDS 2021 - 6th International Conference on Internet of Things, Big Data and Security
110

Chung, J., Gulcehre, C., Cho, K., & Bengio, Y. (2014). Em-
pirical evaluation of gated recurrent neural networks on
sequence modeling. arXiv preprint arXiv:1412.3555.
Schuster, M., & Paliwal, K. K. (1997). Bidirectional recur-
rent neural networks. IEEE transactions on Signal Pro-
cessing, 45(11), 2673-2681.
Sak, H., Senior, A. W., & Beaufays, F. (2014). Long short-
term memory recurrent neural network architectures for
large scale acoustic modeling.
Schwab, P., Schütte, A. D., Dietz, B., & Bauer, S. (2020).
Clinical Predictive Models for COVID-19: Systematic
Study. Journal of medical Internet research, 22(10),
e21439.
Hossin, M., & Sulaiman, M. N. (2015). A review on evalu-
ation metrics for data classification evaluations. Inter-
national Journal of Data Mining & Knowledge Man-
agement Process, 5(2), 1.
Mandrekar, J. N. (2010). Receiver operating characteristic
curve in diagnostic test assessment. Journal of Thoracic
Oncology, 5(9), 1315-1316.
Deep Learning for COVID-19 Prediction based on Blood Test
111
