
Development of Low-cost IoT System for Monitoring and Enhancing
Renewable Energy Feed-in Tariff at Household in Hong Kong
C. C. Lee
1a
and George Chan
2b
1
School of Science and Technology, The Open University of Hong Kong, Hong Kong, China
2
Research and Development Department, ASM Pacific Technology Ltd., Hong Kong, China
Keywords: IoT, Feed-in Tariff, Smart Renewable Energy.
Abstract: Feed-in tariff schemes become more popular in many countries nowadays. In October 2018, the Hong Kong
Government launched a new policy scheme which was comprised of feed-in tariff scheme and renewable
energy certificates. The work mentioned in this paper aims at improving the efficiency of implementing the
feed-in tariff scheme at household in Hong Kong by using an automatic intelligent and relatively low-cost
IoT system. Besides improving the energy efficiency, the proposed system also includes a website and an
App for monitoring the system performance. The experimental results showed that the energy generated by
using the proposed system is three times more than the system without smart features. The payback period
can be greatly reduced from 11 to 6 years by using the proposed system. It encourages the development of
renewable energy sources in Hong Kong or other similar developed cities.
1 INTRODUCTION
Fossil fuel was used to be the most abundant energy
resource when human discovered how electricity
could be generated. For years, Hong Kong relied on
the combustions of fossil fuels to generate electricity.
The coal dominated the overall fuel mix with more
than 50%. The data is shown that fossil fuels actually
brought more harms than benefits to the environment
(Ajlif, 2020). As planned, it should be reduced to
around 20% in 2022, and it is expected to be
completely eliminated in 2030. It is expected that
Hong Kong's per capita annual carbon emissions of
nearly 6 metric tons will be reduced to about 3.3 to
3.8 metric tons in 2030 (EcoSmart, 2019). Therefore,
effort should be made to use more renewable energy.
It seems that Hong Kong is not a suitable place to
invest renewable energy. But, Hong Kong has a
subtropical climate where the sun shines usually from
the south at noon. There could be a huge potential for
Hong Kong to develop renewable energy sources like
solar energy. According to the research of local
officials, the daily average horizontal solar irradiation
was 3.56 kWhm
-2
day
-1
in 2017. Besides, the average
a
https://orcid.org/0000-0001-9365-9397
b
https://orcid.org/0000-0003-2821-7212
global solar radiation in 2018 was 433.5 MJm
-2
. In
addition, the average wind speed of the particular site
was about 7 ms
-1
and the median wind speed was 6.6
ms
-1
. These are the considerable conditions for Hong
Kong to highly develop renewable energy sources
including solar and wind.
As a result, the development of renewable energy
sources would be inevitable. However, the
contributions of renewable energy such as solar and
wind energy have been less than 1% of the total
energy resources of Hong Kong up to now. There are
only a few people who installed solar or wind power
facilities. The reason is obviously lack of policy
incentives (Sauma, 2015).
Renewable Energy Feed-in tariff (FiT) could be
an opportunity for residents and office owners to take
part in by installing a renewable energy system on the
buildings or houses. The user could charge the
electricity suppliers by selling their electricity via the
successfully connected grids. However, the long
payback period hestiate the people to join the FiT
scheme. In this work, it aimed to develop an IoT
system for monitoring and enhancing renewable
energy FiT at household or small office in Hong Kong
or similar developed cities.
Lee, C. and Chan, G.
Development of Low-cost IoT System for Monitoring and Enhancing Renewable Energy Feed-in Tariff at Household in Hong Kong.
DOI: 10.5220/0010484403150322
In Proceedings of the 6th International Conference on Internet of Things, Big Data and Security (IoTBDS 2021), pages 315-322
ISBN: 978-989-758-504-3
Copyright
c
2021 by SCITEPRESS – Science and Technology Publications, Lda. All rights reserved
315
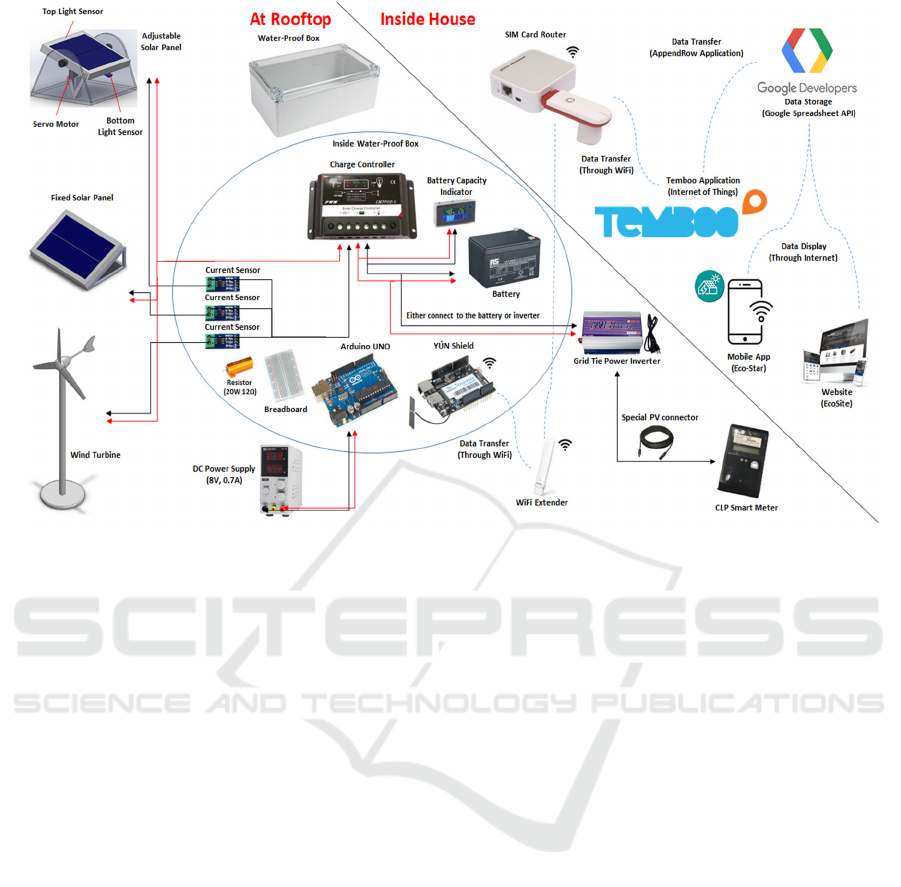
Figure 1: The schematic diagram of the smart IoT system for monitoring and enhancing renewable energy feed-in tariff at
household or small office in Hong Kong or similar developed cities.
2 RELATED WORK & CURRENT
TECHNOLOGY
Automatic intelligence IoT systems become more
feasible and cost-effective in recent years due to the
development of sensors and wireless communication
technology (Mittal, 2019). One of the usage of such
technology is to control and monitor the industrial
production. It is expected that sensors and automation
machine are also applicable in renewable energy
system.
A few IoT-based monitoring systems periodically
tracked the quality of power plants were proposed and
demonstrated to endorse a better energy management
from a single building to a wider context (Domova
and Dagnino, 2017), (Carchiolo, 2019). There were
also systems using modelling to manage and optimize
the energy efficiency in various environment (Clarke,
2016), (Dao, 2017). However, there is a lack of IoT
system which is comprised of both hardware and
software to monitor and enhance the renewable
energy in the household areas.
IoT system with sensors and feedback mechanism
should be fully utilized. In the developed cities, like
Hong Kong, most of the solar energy companies still
using supporting stand for the solar panel. Although
there are some adjustable solar panel. It could only
be adjusted manually but not automatically. Solar
tracking mount technology is also a developing
technology which is similar to the proposed solar
panel. Standalone trackers allow solar panels to
maximize electricity production by following the sun
as it moves across the sky. On the other hand, some
companies have Apps to monitor the system and
power generation (Atasoy, 2015). However, the
technology is not stable yet until 2021 to replace
ground mount solar panel. Most importantly, the cost
of implementing the existing tracking solar panel is
not efficient at household or small office. Also, there
is no other sensors, like humidity sensor and wind
sensors, and no other renewable energy source as a
whole to implement the entire IoT system.
To the best of the authors’ knowledge, the
proposed work is the first low-cost IoT system for
monitoring and enhancing feed-in tariff on various
renewable energy sources at household and small
office in the developed cities.
3 METHODOLOGY
As an IoT work, the implementation of this system
required a large proportion of combination between
hardware and software. In the aspect of hardware
IoTBDS 2021 - 6th International Conference on Internet of Things, Big Data and Security
316
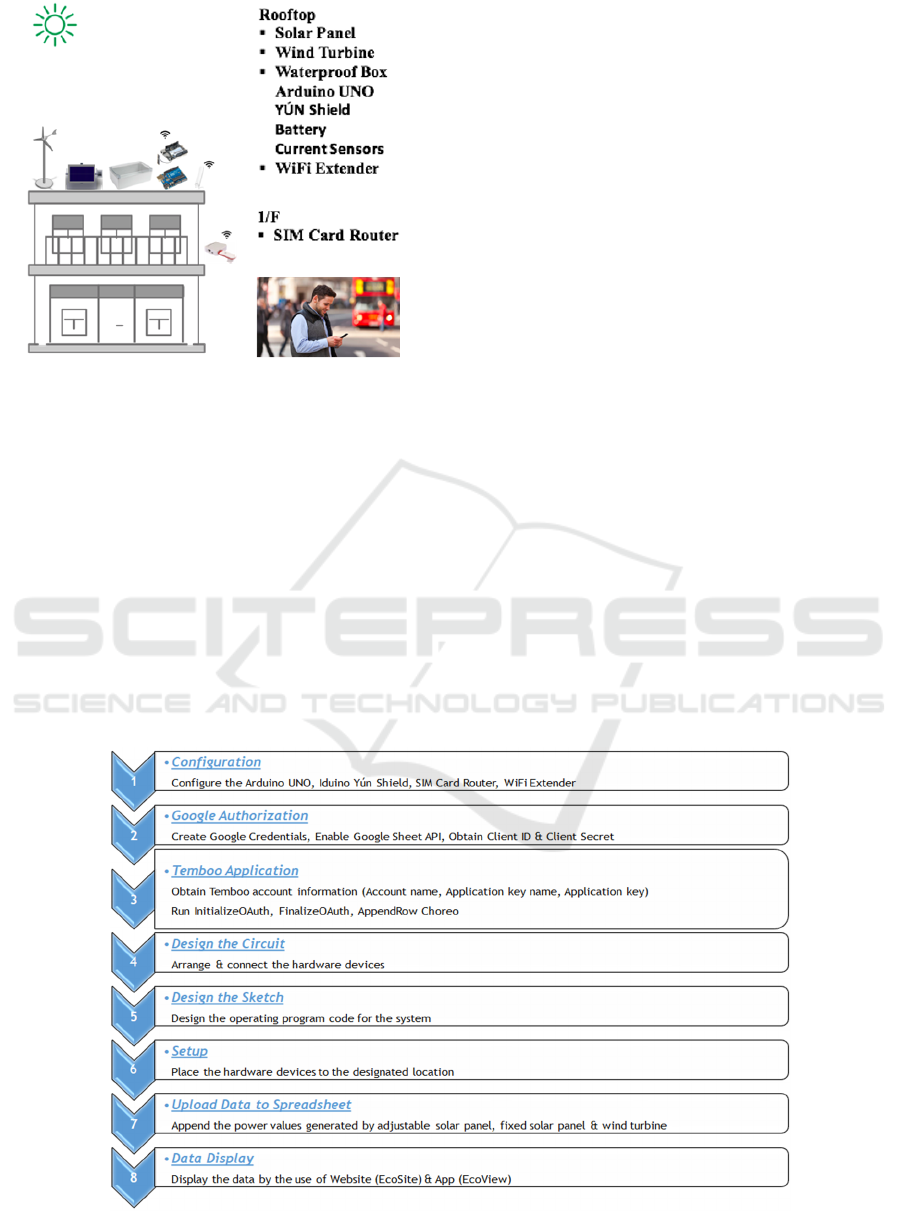
Figure 2: Proposed residential installation of the system.
development, selection of appropriate renewable
energy devices, such as solar panels and wind turbine,
is the most critical. It will directly influence the
power output from the system. Besides, selection of
development board is also crucial because it is the
central processor of the system. Other selected
components should be compatible to the selected
development board. It can enhance the combination
between hardware and software and reduce the time
for troubleshoot in later stages.
In the aspect of software development, the system
will be connected to the Internet through WiFi
technology. By using Application Programming
Interface (API), data will be uploaded automatically
to the Google Cloud and stored in the Google
Spreadsheet. The sketch of the development board
and the procedure of proceeding the Authorization
between Temboo platform and Google Developer are
essential. Finally, the data will be displayed in the
website (called EcoSite) and the Smart App (called
EcoView). The EcoSite is a website for real time
monitoring of the renewable energy system. It shows
the chart in the page of Monitor that user can
understand the amount of power generated, profit and
paid back period of the renewable energy system. For
the EcoView, it was developed to process, calculate
and displace the raw data on the spreadsheet
automatically and upload the results (total, average by
hour, minimum and maximum of the income, energy,
and power of EcoStar with the operative duration) to
the Firebase project EcoStar thunkable 1 daily at
midnight. More importantly, EcoView can display
the charts and the data of the desired date. EcoView
is applicable on both IOS and Android system. In the
system, Google Sheets API is enabled in order to
allow Temboo Application get access to the
designated spreadsheet. Besides, AppendRow API is
used to append rows of data to the spreadsheet. The
Figure 1 shows the schematic diagram of the smart
IoT system for monitoring and enhancing renewable
energy feed-in tariff at household or small office,
while the Figure 2 shows the proposed residential
installation of the system in Hong Kogn or similar
devleoped cities. Figure 3 shows the logical flow
chart of the proposed system.
Figure 3: Logical flow chart of the proposed system.
Development of Low-cost IoT System for Monitoring and Enhancing Renewable Energy Feed-in Tariff at Household in Hong Kong
317
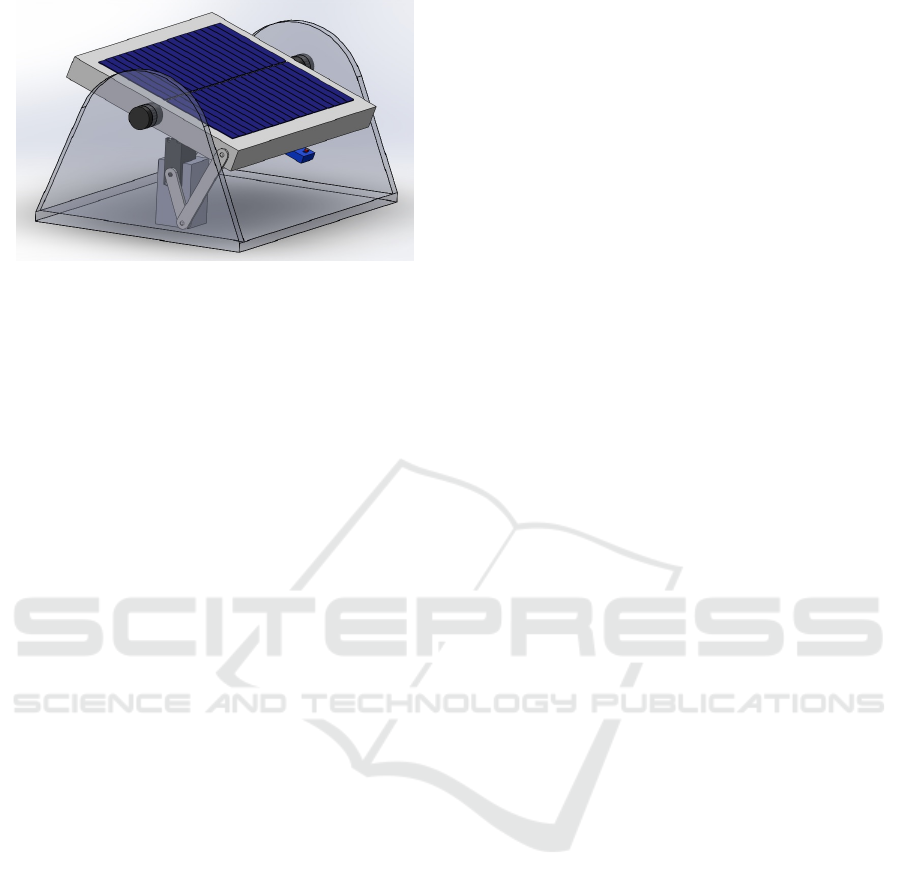
Figure 4: The base of adjustable solar panel.
3.1 Hardware Configuration
For the design of the system, all the renewable energy
devices are connected to batteries through a charge
controller. All the devices and components are DC
(Direct Current). This setting is due to the budget and
scale limitations of the project. However, if the
system is applied to residential or commercial use, all
the renewable energy devices will be connect to a
meter by using special PV connector and Grid Tie
Inverter (GTI). The meter will be provided by the
Electric company. The meter used can only get the
input of AC (Alternative Current) power. Therefore,
it is recommended to use GTI for the conversion from
DC power to AC power.
In the past, people used AC generator to convert
DC power to AC power for providing back-up
electricity. However, using AC generator will cause
a high extent of power loss. During the conversion,
the load current will flow through the armature of the
AC generator. The resistance and inductive reactance
of the armature will cause a voltage drop. Therefore,
the voltage and power generated will be lost. For
providing back-up electricity, the amount of power
loss can be acceptable. However, for energy FiT
schemes, the money earned depends on the amount of
energy generated. It is unacceptable to have a high
extent of power loss.
Using GTI can also convert DC power to AC
power. However, a grid tie inverter can produce sine
wave AC electricity that matches the voltage and
frequency of the grid exactly. After matching the
voltage and phase of the grid sine wave AC
waveform, people can inject electrical power
efficiently and safely into the grid. Therefore, the
problem of power loss can be eliminated. As a result,
if the smart system is applied to residential or
commercial use, the charge terminals of the charge
controller will be connected to a GTI through a
special PV connector.
There would be three options of development
boards for the Smart System, which would be
Arduino UNO Rev 3, Raspberry Pi Model B 3+ and
Micro:bit. Since the development board is the core in
the system, therefore there is a need to be extremely
careful when selecting the development board.
Besides, there are other criteria for the selection of
development board for the Smart System. For
example, in order to monitor and control some
hardware components, such as light sensor and servo
motor, open source for hardware design is one of the
requirements. Because of the connection to the
hardware components, both digital and analogue I/O
are required. Finally, since the connection of the
Smart System is WiFi, therefore on-board WiFi chip
is preferred. Therefore, Arduino UNO was chosen as
the development board for the Smart System.
The phototransistors (light sensors) is placed on
protective cases, which is produced by 3D printing
that stuck on the edge of solar panel at the top and the
bottom, in order to track solar orbit by comparing the
light intensity. The smart system compares the light
intensity and adjust the solar panel perpendicular to
the sun by the movement of servo motor which was
fixed on the 3D-printed stand on the base of
adjustable solar panel as shown in Figure 4.
Therefore, the solar panel is expected to enhance the
efficiency by strengthening the light intensity
collection.
Miroad KY55 5528 is selected as the light sensor
in the system as it contains a MV358I chip that would
make the control easier. In order to keep measuring
the power generated by the solar panel and wind
turbine, ACS712 current sensor as shown in Figure
S12 was used. The ACS712 is a Hall effect based
linear current sensor. The ACS712 Chip, as shown in
Figure S13, works like a magnetic isolator since the
current sensing element is electrically isolated from
the measure device. The magnetic field surrounding
the piece of wire when current flows through the
current sensing metal and the Hall effect sensor
detects that current through a little bit of integral
electronics provides a signal on those pins that is
between 0V and 5V.
After the selection of appropriate hardware
devices and components, a circuit is designed to
connect all these devices and components into a
single system. For the operation of the system,
Arduino UNO Rev 3 is the core development board.
Iduino Yún Shield is a supplementary development
board especially used for providing WiFi support.
Two development boards can be connected by simply
combining them together.
IoTBDS 2021 - 6th International Conference on Internet of Things, Big Data and Security
318

Generally, the positive terminal of all the
renewable energy devices are connected to the
positive input terminal of the charge controller. The
negative input terminal of the charge controller are
connected to IP+ (current in) terminal of all the
current sensors. The IP- (current out) terminal of all
the current sensors are connected back to the negative
terminal of all renewable energy devices. Two
batteries are connected in serial. The positive and
negative terminal of the battery are connected to the
positive and negative charge terminal of the charge
controller respectively. The battery capacity indicator
is connected to the batteries in parallel.
A servo motor and two light sensors are used.
Together with the current sensors, all the sensors and
the servo motor are powered by the 5V output pin of
the Arduino UNO. All the above DC devices are
connected in parallel. The negative terminal of these
DC devices is connected to the ground provided by
Arduino UNO.
For the arrangement of I/O pins, 5 analog pins and
1 digital pin are used. Top and bottom light sensors
are connected to analog pin A1 and A2 respectively.
Current sensors for adjustable solar panel, fixed solar
panel and wind turbine are connected to analog pin
A3, A4 and A5 respectively. Servo motor is
connected to digital pin D9. The system is powered
by the DC power supply, in order to mimic the stable
power supply in residential house. However, if the
system is directly connected to DC power supply, the
current would be large enough to damage the
development boards. Therefore, a resistor is
connected to the development boards in parallel, in
order to prevent large current flowing to the
development boards. By using the Digital Multimeter
(DMM), the resistance of the whole system is
measured to be 11.4286Ω. After calculation, the
suitable range of resistance of the selected resistor is
between 10 and 12Ω. After some experiments, the
suitable power rating of the resistor is 20W.
Therefore, a resistor with 12Ω and 20W is connected
to the system in parallel.
By using parallel resistance formula, the
resistance of the system is reduced from 11.4286Ω to
5.8537Ω. The current flow of the system is increased
from 0.7A to 1.3667A. However, the current flow to
the development boards will be changed to 0.4481A,
which is calculated by using the formula 1.3667A ×
[5.8537Ω / (5.8537Ω + 12Ω)]. The resistor used
shares the rest of the current flow (1.3667A –
0.4481A = 0.9186A). The use of resistor is to reduce
the current flow to the development boards, in order
to protect it from damage.
By using the DC power supply, the optimum
voltage and current for powering up the system is
obtained to be 5V and 0.7A. The exact voltage of the
5V output pin from Arduino UNO is measured to be
4.1V, which is large enough to power up the servo
motor and all the sensors.
3.2 Firmware Design
In the system, the software support takes an important
part. For example, through the design of Arduino
sketch, different hardware devices, such as solar
panels and sensors, are optimum to monitor and
enhance renewable energy FiT. By the use of WiFi
technology, the system can be connected to the
Internet. Data, such as renewable energy generated
and the money earned by the users, will be uploaded
to the Google Cloud automatically. The uploaded
data will be further proceeded for analysis, and finally
the results will be displayed in EcoSite and EcoView.
When particularly focusing to the software
development of the system, it does not only required
to design the sketch for the operation of the hardware
devices such as motor and sensors, but also required
to design the sketch for the connection between
Arduino boards to the Internet. Before connecting to
the Internet, it is critical to get the Google
Authorization, which allows the Temboo application
getting access to a designated Google Spreadsheets.
After the operating sketch of the system has been
designed and accomplished, it will be complied and
uploaded to the Arduino boards. The uploading
method is through WiFi. Therefore, no wired
connection between the system and the personal
computer is required.
For the use of comparing energy efficiency, both
adjustable solar panel and fixed solar panel are
connected to the system during simulation. One of the
solar panels is installed to a fixed solar panel
positioner. Another solar panel is installed to another
solar panel positioner and controlled by a servo motor
and two light sensors.
In the sketch used to control the solar panel by
servo motor and light sensors, the light values are
compared. If the light value from the top sensor is
larger than that from the bottom sensor, the top sensor
will take control of the servo motor. If the light value
from the top sensor is less than or equal to that from
the bottom sensor, the bottom sensor will take
control. By executing the map() function, the servo
motor, jointed with the solar panel, will rotate to the
position that can obtain the highest light level.
For the simulation of generating renewable
energy, the measurement of energy generated by the
Development of Low-cost IoT System for Monitoring and Enhancing Renewable Energy Feed-in Tariff at Household in Hong Kong
319
renewable energy device is required. In order to
obtain the energy values, the power values are
required to be measured. In the system, current
sensors are used. The power generated by the
adjustable solar panel, fixed solar panel and wind
turbine are required to be measured. Therefore, three
current sensors are used for the system. After that, the
power values are obtained by multiplying those
voltage values with the corresponding current values.
Although the current sensors that we used are the
same in module and rating, they can never be
identical. Therefore, the above formula will be
slightly tuned for measuring different devices.
After the sensors got the data, these data will be
automatically uploaded to the Google Spreadsheet.
In order to achieve it, the Google API and Temboo
Platform is used. After creating the Temboo Header
File and setting the profiles, the Arduino sketch was
designed to upload data from Arduino to Google
Spreadsheet by calling Temboo application through
Arduino.
3.3 EcoSite Design
The Google-based application Google Site was
selected for the collaboration and communication
with the other users. It is because Google Site could
help the inexperienced applicants who have no
programming backgrounds to create and edit a
website in an intuitive way. The methodology of the
design and information sharing was simple and easy
by dragging and dropping the functions provided in
the toolbar. Moreover, the other Google-based
applications such as Google Docs and YouTube can
be included, integrated and organized in to one that it
could be compatible with Google Sheets to which the
raw data from EcoStar would be transferred.
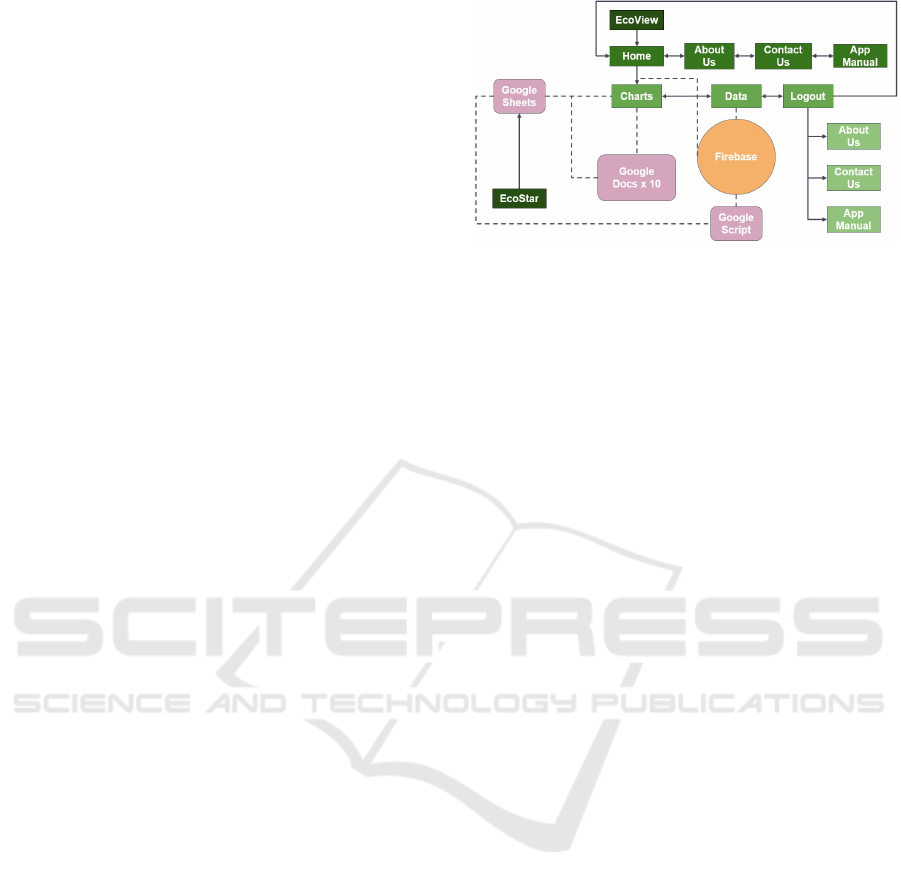
3.4 EcoView Design
In order to allow the data, such as the units of energy
generated, to be automatically updated and uploaded
and the users of EcoStar to check for the data
remotely, the App, called EcoView, was created.
Supported by assistant online services including
Firebase, Google Sheets, Google Script and Google
Docs, the raw data of EcoStar from Google Sheets
could be automatically updated and calculated. Next,
the macro program written in Google Script would
transfer and calculate the new raw data on a newly
created sheet and upload the results to Firebase. Then,
the prepared charts corresponding to the trends of
data in Google Sheets would change along with the
Figure 5: Structural Diagram of EcoView.
new data and be published for users to view by
Google Docs. Simultaneously, as a real-time database
supported by Google, Firebase would store the
uploaded data in terms of links. The user may look for
the data of certain days by tracking through the links.
The process would be repeated daily with the support
of the time-based trigger setting of Google Script.
To develop EcoView, the App developer
Thunkable X was selected. There were three reasons
for the decision. Firstly, Thunkable X was compatible
with both IOS and Android systems so users of
different systems could be supported. Secondly, it
was designed with reference to another two well-
accepted App developers, MIT App Inventor and
Thunkable, which indicated that it was reliable and
mature for App development. Thirdly, Thunkable X
was built associated with the cooperative services
with Firebase and WebViewer that it would be more
convenient to upload data to or draw data from
Firebase and the viewing of the charts would be
allowed. The structural diagram of EcoView is as
shown in Figure 5.
4 EXPERIMENTAL RESULTS
The prototype for the system was built as shown in
Figure 6. All the hardware devices, including the
solar panels, wind turbine and water-proof box, are
set up at the rooftop. The SIM card router is set up in
an in-house area at 10/F of the building in the campus.
The WiFi extender is set up at the ladder between
10/F and 11/F of the same building.
The noncumulative power display on EcoSite
with blue line and red line is as shown in Figure 7 to
represent power (adjusted) and power (fixed)
respectively. Meanwhile, the noncumulative power
display on EcoView with blue line and red line is as
shown in Figure 8 to represent power (adjusted) and
power (fixed) respectively.
IoTBDS 2021 - 6th International Conference on Internet of Things, Big Data and Security
320
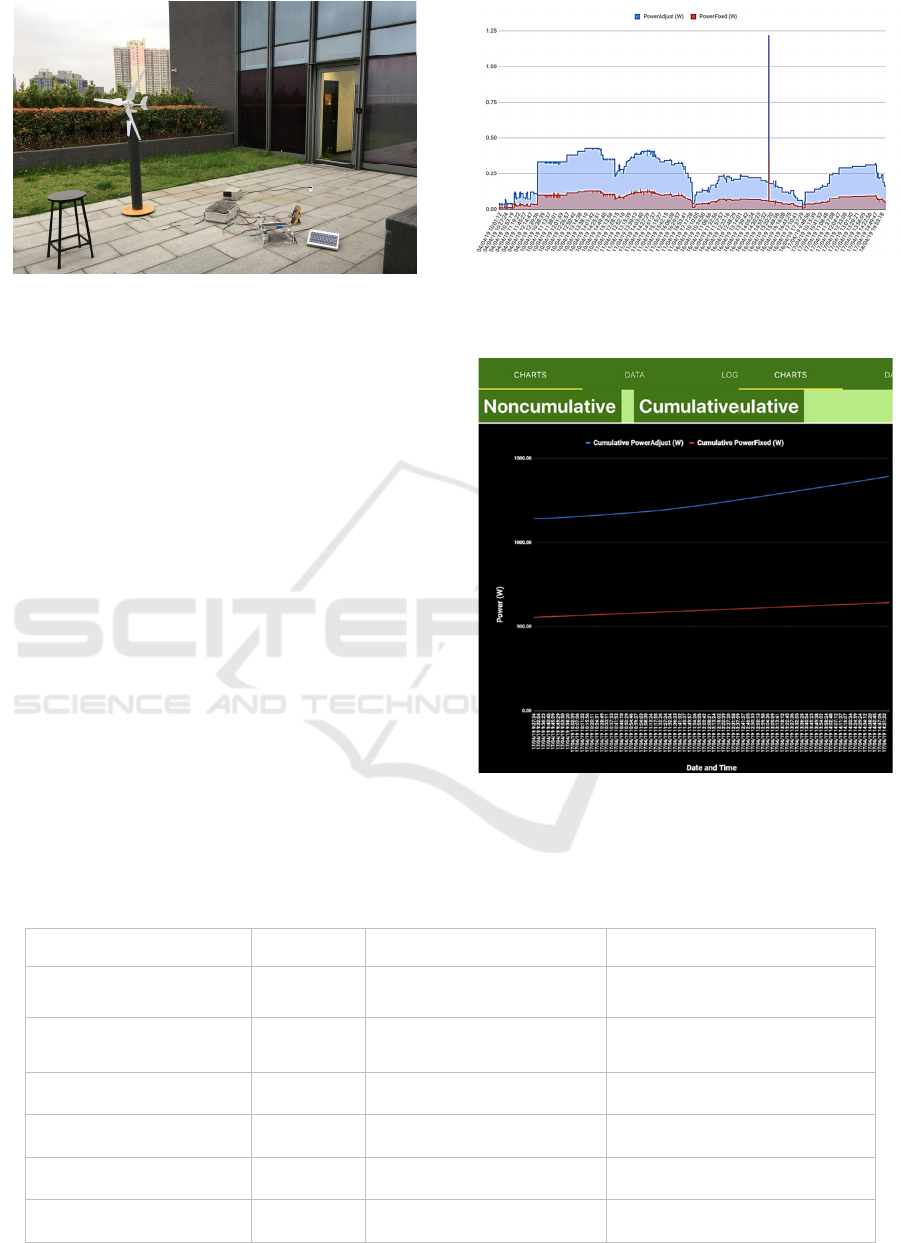
Figure 6: The first prototype of the proposed system.
The data obtained by the system is transmitted to
the Google Sheet via the use of WiFi and Temboo
platform. The data analysis on five different duration,
time and date can be found in Table 1. The
experimental results showed that the energy
generated by using the proposed system is three times
more than the system without smart features. In order
to compare the payback period of system with and
without the proposed system, a control experiment
which do not have smart elements in it was also
conducted. By analysing the cost of system and the
gross profit earned. The payback period of smart
system is 5.84 years while that of control experiment
is 10.56 years.
5 CONCLUSIONS
A smart system, called EcoStar, was developed to
enhance the renewable energy generated, through the
well combination of hardware and software. As
shown in the experimental results, it is proved that the
development of this smart IoT system can increase
Figure 7: Noncumulative power display on EcoSite with
blue line and red line representing power (adjusted) and
power (fixed) respectively.
Figure 8: Noncumulative power display on EcoView with
blue line and red line representing power (adjusted) and
power (fixed) respectively.
Table 1: This caption has one line so it is centered.
Date and Time Duration Power of the Fixed Panel Power of the Adjustable Panel
Day 1
(10:01:12 - 12:45:42)
02:44:30 0.18 W 0.54 W
Day 2
(10:20:54 - 15:32:02)
05:11:08 0.27 W 0.56 W
Day 3
(12:22:49 - 17:25:17)
03:02:28 0.28 W 0.69 W
Day 4
(09:53:24 - 17:42:53)
07:48:29 0.21 W 0.58 W
Day 5
(09:27:34 - 14:55:29)
05:27:55 0.29 W 0.57 W
Day 6
(15:12:00 - 17:40:14)
02:28:14 0.20 W 0.53 W
Development of Low-cost IoT System for Monitoring and Enhancing Renewable Energy Feed-in Tariff at Household in Hong Kong
321

the energy efficiency of generating renewable energy.
An automatic and wireless system has been
developed, to not only increase the energy efficiency,
but also provide a convenient way for users to
monitor the results by the use of website and App.
During the construction of this system, many
opinions and feedback from different fields of
stakeholders are received. Under the system EcoStar,
a website called EcoSite and an App called EcoView
are developed for monitoring the renewable energy
feed-in-tariff. This smart system is a prototype,
however, the application of this system can be well-
projected as a cost-effective and intelligent system.
ACKNOWLEDGEMENTS
The work described in this paper was supported by
The Open University of Hong Kong Research Grants
(No. ROU/E08/19 and R5082).
REFERENCES
Ajlif, A. M., Joseph, S. C., Jayan, P. P., Raghavan, D. P.,
Joseph, A., & Chacko, R. V. (2020). Energy
Efficient LVDC Architecture for House Boat Hotel
Load System. 2020 IEEE International Conference on
Power Electronics, Smart Grid and Renewable Energy
(PESGRE2020). doi:10.1109/pesgre45664.2020.9070
720
Latest News. (n.d.). Retrieved January 25, 2021, from
http://www.ecosmart.com.hk/en_US/%E6%9C%80%
E6%96%B0%E6%B6%88%E6%81%AF/
Sauma E., Perez de Arce M. and Contreras J. (2015).
Multiple Equilibria in Oligopolistic Power Markets
with Feed-in Tariff Incentives for Renewable Energy
Generation. 2015 48th Hawaii International Conference
on System Sciences. doi: 10.1109/HICSS.2015.305.
Mittal, M., Tanwar, S., Agarwal, B., & Goyal, L. M.
(2019). Energy Conservation for IoT Devices
Concepts, Paradigms and Solutions. Singapore:
Springer Singapore.
Domova V. and Dagnino, A., 2017. Towards intelligent
alarm management in the Age of IIoT. In Global
Internet of Things Summit (GIoTS), IEEE press.
Carchiolo V., Longheu A., Malgeri M., Sorbello S. and
Torcetta A. (2019). Integration of Monitoring and
Alarm Management in Power Plants.In Proceedings of
the 21st International Conference on Enterprise
Information Systems - Volume 2: ICEIS, ISBN 978-
989-758-372-8, pages 658-665. doi: 10.5220/0007754
706580665
Clarke, W. C., Manzie, C., and Brear, M. J. (2016). An
Economic MPC Approach to Microgrid Control. In
Control Conference (AuCC), 2016 Australian.
Ferrarini, L.and Mantovani, G. (2013). Modeling and
control of thermal energy of a large commercial
building, IEEE International Workshop on Intelligent
Energy Systems (IWIES).
Dao L., Ferrarini L. and Piroddi L. (2017). MPC-based
Management of Energy Resources in Smart
Microgrids.In Proceedings of the 14th International
Conference on Informatics in Control, Automation and
Robotics - Volume 1: ICINCO, ISBN 978-989-758-
304-9, pages 246-253. doi: 10.5220/000642790246
0253
Atasoy, T., Akinc, H. E., & Ercin, O. (2015). An
analysis on smart grid applications and grid integration
of renewable energy systems in smart cities. 2015
International Conference on Renewable Energy
Research and Applications (ICRERA). doi:10.1109/
icrera.2015.7418473
IoTBDS 2021 - 6th International Conference on Internet of Things, Big Data and Security
322
