
Structural Coupling for Microservices
Sebastiano Panichella
1 a
, Mohammad Imranur Rahman
2 b
and Davide Taibi
2 c
1
Zurich University of Applied Science (ZHAW), Zurich, Switzerland
2
CLoWEE, Cloud and Web Engineering Group, Tampere University, Tampere, 33720, Finland
Keywords:
Cloud-native, Microservice, Coupling.
Abstract:
Cloud-native Applications are “distributed, elastic and horizontal-scalable systems composed of (mi-
cro)services which isolates states in a minimum of stateful components”. Hence, an important property is
to ensure a low coupling and a high cohesion among the (micro)services composing the cloud-native applica-
tion.. Loosely coupled and highly cohesive services allow development teams to work in parallel, reducing the
communication overhead between teams. However, despite both practitioners and researchers agreement on
the importance of this general property, there are no validated metrics to effectively measure or test the actual
coupling level between services. In this work, we propose ways to compute and to visualize the coupling
between microservices, this by extending and adapting the concepts behind the computation of the traditional
structural coupling. We validate these measures with a case study involving 17 open source projects and we
provide an automatic approach to measure them. The results of this study highlight how these metrics pro-
vide to practitioners a quantitative and visual views of services compositions, which can be useful to conceive
advanced systems to monitor the services evolution.
1 INTRODUCTION
Decomposing a monolithic system into independent
services, and especially into microservices (Lewis
and Fowler, 2014), is a very critical and complex task
in modern applications, especially because of the lack
of tools to support the decomposition of monolithic
systems and the lack of clear and usable measures to
evaluate the quality of the decomposed systems. In-
deed, the architecture decomposition in microservices
is usually performed manually and evaluated based
on the human perception of software architects (Taibi
et al., 2017),(Taibi et al., 2021),(Soldani et al., 2018).
A desirable property of microservices is that
they should be as decoupled and as cohesive as
possible (Lewis and Fowler, 2014). Specifically,
while a low coupling is important in monolithic sys-
tems (Yourdon and Constantine, 1979), it is even
more important in microservices, since loosely cou-
pled services (statically and dynamically) allow the
developer to make changes to their service without the
need of modifying other services (Lewis and Fowler,
2014). Therefore, investigating ways to measure the
a
https://orcid.org/0000-0003-4120-626X
b
https://orcid.org/0000-0003-1430-5705
c
https://orcid.org/0000-0002-3210-3990
evolving coupling between services is of fundamen-
tal importance, not only to increase the independence
between teams, but to reduce also the level of depend-
ability among software changes occurring in different
system components. Indeed, as discussed in previous
work, a high coupling can have a negative impact on
reliability of changes, increasing the overall mainte-
nance effort (since the change of one service requires
to change also all the services coupled to the same
service). However, besides the relevance of having
a low coupling and high cohesion in microservices,
there are no validated metrics to effectively measure
or test the actual coupling level between the system
services.
In this paper, we propose the structural coupling
metric. An objective metrics that can be measured
automatically, and that can help practitioners to un-
derstand how decoupled are their services, and even-
tually to reason on decoupling strategies.
We validate the structural coupling with a case
study involving 17 open source projects, available
from the ”Microservice Dataset” (Rahman et al.,
2019). The results of this study highlight how these
metrics provide to practitioners quantitative and vi-
sual views of service compositions, which can be use-
ful to conceive advanced systems to monitor the evo-
lution of services.
280
Panichella, S., Rahman, M. and Taibi, D.
Structural Coupling for Microservices.
DOI: 10.5220/0010481902800287
In Proceedings of the 11th International Conference on Cloud Computing and Services Science (CLOSER 2021), pages 280-287
ISBN: 978-989-758-510-4
Copyright
c
2021 by SCITEPRESS – Science and Technology Publications, Lda. All rights reserved

Paper Structure. The remainder of this paper is
structured as follows. Section 2 describes the back-
ground and related works. Section 3 presents the pro-
posed coupling metrics. Section 4 reports on a case
study where we validate the proposed metrics while
Section 5 draws conclusions of this work.
2 BACKGROUND AND RELATED
WORKS
In this Section we first introduce the background and
the terms adopted in this work, and then we describe
the metrics we proposed to evaluate cloud-native (and
microservices) based applications services composi-
tion.
2.1 What Is a Microservice
A microservice-based system is a decentralized sys-
tem that is composed of several independent small
services, that communicate through different light-
weight mechanisms. Commonly, microservices ap-
ply decentralized mechanisms such as choreogra-
phy instead of choosing central service orchestra-
tions. Microservice adopt domain-driven designs,
that allow each microservice the responsibility for
only one bounded context, providing only a lim-
ited amount of functionality serving specific business
capabilities (Lewis and Fowler, 2014), (Hasselbring
and Steinacker, 2017) and enabling continuous deliv-
ery (Amaral et al., 2015).
In microservices, scalability, losing coupling
and high cohesion, independence, maintainabil-
ity, deployment, health management and modular-
ity are other fundamental properties of microser-
vices (Lewis and Fowler, 2014). The development
of microservices-based system require to consider
several aspects of the system (Taibi et al., 2021).
From the architectural point of view, developers must
carefully consider the patterns adopted (Neri et al.,
2020)(Taibi et al., 2018)(Taibi et al., 2019)(Taibi
et al., 2020)(Taibi and Lenarduzzi, 2018). For
this purpose, different tools might be adopted both
before (Azadi et al., 2019) and after the migra-
tion (Pigazzini et al., 2020). Performance and com-
plexity should be considered as well, since they are
fundamental for efficient communication among mi-
croservices (Pahl and Jamshidi, 2016), (Amaral et al.,
2015) and also fault handling and fault tolerance play
important roles to take under control security issues
(Pahl and Jamshidi, 2016), (Dragoni et al., 2017),
(Martin and Panichella, 2019). Last, but not least,
we need to consider that systems must be also main-
tained once they are deployed and therefore, devel-
opers should avoid to accumulate waste and techni-
cal debt during the development (Lenarduzzi et al.,
2020)(Lenarduzzi and Taibi, 2018)(Soares de Toledo
et al., 2019).
2.2 Cloud-native and Microservices
Metrics
Different metrics have been proposed for monolithic
systems. However, several properties have been high-
lighted for service-based systems, and especially for
microservices.
Bogner et al. (Bogner et al., 2017b) pro-
posed a maintainability model for service-oriented
systems and microservices. Engel et al. (Engel et al.,
2018) proposed a set of six measures to evaluate a
microservice-based system. Taibi and Syst
¨
a (Taibi
and Syst
¨
a, 2019) proposed a decomposition frame-
work based on process mining together with a set
of metrics to evaluate the quality of the decomposi-
tion, identifying two size-related measures and a cou-
pling measure. However, all the proposed metrics are
mainly based on the manual measurement of a set of
properties and they are not empirically validated. In
their secondary study, Bogner et al. (Bogner et al.,
2017a) highlighted that the majority of metrics ex-
plicitly designed for monolithic systems and for Ser-
vice Oriented Architecture (SOA) can be also suitable
to (micro)services. However, they also highlight that
the different aspects of microservices can have a sig-
nificant impact on the complexity of automatic met-
ric collection, suggesting the need for specialized tool
support.
We identified four groups of metrics in the litera-
ture (Table 1):
• Service Size. We considered six measures pro-
posed by Engel et al. (Engel et al., 2018)and two
proposed by Taibi and Syst
¨
a (Taibi and Syst
¨
a,
2019) with the goal of comparing two decompo-
sition options. Moreover, we also report two met-
rics originally defined for SOA, that can be ap-
plied in microservices (Bogner et al., 2017a).
• Service Complexity. No microservice-specific
measures have been proposed, but three metrics
originally proposed for SOA can be applied in mi-
croservices (Bogner et al., 2017a).
• Service Cohesion. The degree to which the el-
ements of a certain class belong together. It is
a measure of how strongly related each piece of
functionality of a software module is (Fenton,
1991). High cohesion makes the reasoning easy
and limits the dependencies (Kramer and Kaindl,
Structural Coupling for Microservices
281

Table 1: The Metrics Proposed in the Literature.
Group Metric
- Number of synchronous cycles (Engel et al., 2018)
- Distribution of synchronous call per microservice (Engel et al., 2018)
- Number of synchronous dependencies of each microservice (Engel et al., 2018)
Service Size - Average size of asynchronous messages (Engel et al., 2018)
- Longest synchronous call trace (Engel et al., 2018)
- Number of classes per microservice (Taibi and Syst
¨
a, 2019)
- Number of classes that need to be duplicated (Taibi and Syst
¨
a, 2019)(Taibi and Syst
¨
a, 2020)
- Weighted Service Interface Count (WSIC (Hirzalla et al., 2009))*: number of exposed inter-
face of a service be weighted on the number of parameters.
- Component Balance (Bouwers et al., 2011)(Bogner et al., 2017b)*: number and size unifor-
mity of components (or services). Very big or very small components could be candidates for
refactoring.
- Number of Operations (Shim et al., 2008)*: number of exposed interface of a service.
Service Complexity - Total Response for Service (Perepletchikov et al., 2007)*: adaptation of Response for Class
(RFC) (Chidamber and Kemerer, 1994) to the service level
- Number of Versions concurrently used in a Service*
- Service Support for Transactions*
Service Cohesion - Service Interface Data Cohesion (SIDC) (Perepletchikov et al., 2007)*, the similarity of the
parameters data-types between two services
- Service Interface Usage Cohesion (SIUC) (Perepletchikov et al., 2007)*:
(used operations per client/(clients · operations in a service))
- Total Service Interface Cohesion (Perepletchikov et al., 2007): average between SIDC and
SIUC
Service Coupling - Coupling Between Microservices (CBM) (Taibi and Syst
¨
a, 2019). Extension of the CBO, ratio
between the number of calls to other services and the number of classes of the microservice
- Absolute Importance of the Service (AIS) (Rud et al., 2006)(Bogner et al., 2017b)* number
of clients that invoke at least one operation to the service.
- Absolute Dependence of the Service (ADS) (Rud et al., 2006)* number of other services that
a service depends on
- Absolute Criticality of the Service (Rud et al., 2006)* defined as: ACS(S) = AIS(S) × ADS(S)
- Services Interdependence in the System (SIY) (Rud et al., 2006)(Bogner et al., 2017b)*:
Number of service pairs bidirectionally dependent on each other. If such dependencies between
microservices exist, services could be merged.
*Metrics Adopted in SOA, that could be suitable for microservices (Bogner et al., 2017a)
2004). No specific measures have been defined
for cloud-native systems or for SOA. Bogner et
al.(Bogner et al., 2017a) propose to use two cohe-
sion metrics in microservices-based systems
• Service Coupling. The degree or indication of
the strength of interdependence and interconnec-
tions of a service with other services. Two metrics
have been proposed for measuring microservice
cohesion (Taibi and Syst
¨
a, 2019)(Bogner et al.,
2017b). Moreover, Bogner et al. (Bogner et al.,
2017a) also proposed to use four object-oriented
and SOA specific metric proposed by (Rud et al.,
2006) in the context of microservices.
Our works extends and complement the proposed
coupling metrics for coupling by proposing clear
measurement procedures, and a tool to automatically
detect them in microservice, an an approach to visu-
alize them.
3 THE PROPOSED COUPLING
METRICS FOR
MICROSERVICES
In this section, we introduce the Structural Coupling,
a metric that can be used to measure the coupling
among microservices. In particular, such metrics are
inspired by previous work (Savic et al., 2017) from
the software engineering research field, which pro-
posed different ways to measure coupling among soft-
ware artifacts, this to study software evolution dy-
namics of complex software systems.
Thus, we first describe the concepts behind the
definition of these traditional coupling metrics, de-
scribing how they complement each other. Then we
provide the formal definition of the metric we defined
for studying the evolution, complexity, and relations
among microservices.
CLOSER 2021 - 11th International Conference on Cloud Computing and Services Science
282
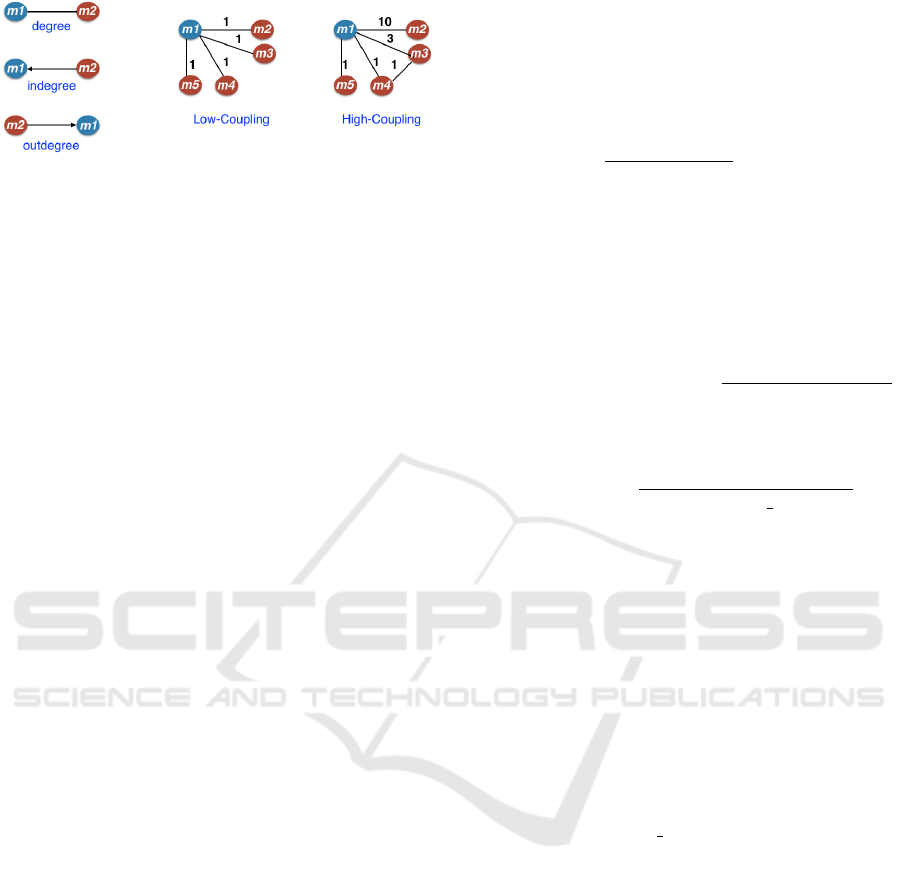
Figure 1: Structural Coupling: graph representation.
3.1 Traditional Definitions of Structural
Coupling
The concept of high cohesion and low coupling is
one of the basic design principles in the software en-
gineering research field (Yourdon and Constantine,
1979). According to such principles, the coupling be-
tween modules of a software system has to be as min-
imal as possible, and, at the same time keeping strong
relations between software artifacts composing the in-
dividual modules.
Structural Coupling. A software module (or arti-
fact) A is structurally coupled with another module
B, if code/structural dependencies exist among them
(Savic et al., 2017). Higher is the number of de-
pendencies among these modules, higher is the level
of coupling. The concept of structural coupling can
be easily represented as a directed or indirect col-
laboration graph (Myers, 2003) (see Figure 1), in
which the nodes correspond to the system modules
and the weighted edges represent the code dependen-
cies among these nodes. A low structural coupling
is important to allow changes in an individual mod-
ule without propagating them in other modules (high
maintainability). A high structural coupling led to
bugs and changes propagating among modules of sys-
tems (low maintainability).
3.2 Microservice Coupling Measures
Referring to the conceptual definition of struc-
tural coupling ((Savic et al., 2017)), a service A
is structurally coupled with another service B, if
code/structural dependencies exist among artifacts
composing them. Thus, higher is the number of de-
pendencies among these services, higher is the level
of coupling. A low structural coupling is important to
allow changes in an individual service without prop-
agating them to other modules/artifacts of other ser-
vices (high maintainability). A high structural cou-
pling led to bugs and changes propagating among
modules of different services (low maintainability), as
well as low developer productivity (e.g., developers
have to co-ordinate their development work involving
different services). More formally, we computed the
structural coupling among a service s1 and service s2
as reported in the following formula (inspired by the
Definition 10 in page 13 of the work by Savic et al.
(Savic et al., 2017)):
StructuralCoupling(s1,s2) =
1 −
1
(degree(s1,s2))
∗ LW F ∗ GWF (1)
In this definition of structural coupling, dependencies
among two services s1 and s2 are weighted consider-
ing both Local Weighting Factor (LWF), considering
the degree and in-degree of s1 with s2, and the Global
Weighting Factor (GWF), considering the max degree
among all services of the system, weighting factors:
LocalWeightFactor(s1, s2) =
1 + outdegree(s1,s2)
1 + degree(s1,s2)
GlobalWeightFactor(s1,s2) =
degree(s1,s2)
max(degree(all services))
(2)
This re-weighted structural coupling measurement
ensures that the actual coupling value between s1 and
s2 range between [0-1] and that these values depend
also on the general dependencies distributed to other
services.
• degree(s1,s2). is the number of all structural de-
pendencies between s1 and s2;
• the outdegree(s1,s2). is the actual number of
static dependencies, among the total one, that are
directed from s1 to s2; in-degree(s1,s2). is the
actual number of static dependencies, among the
total one, that are directed from s2 to s1;
• the max(degree(all services)). corresponds to the
max number of dependencies (i.e., max degree)
among all (possible pairs of) services of the sys-
tem.
3.3 Example
Starting from the system depicted in Figure 2, we now
describe how to calculate the structural coupling. The
system adopted as example is composed by five mi-
croservices, connected together directly.
Table 2 reports an example of metrics proposed
in the literature, calculated for the example-system
depicted in Figure 2. In particular, we represent the
size of each microservices (number of classes), the in-
degree of each microservice (the number of incoming
service calls), the out-degree (the number of outgo-
ing calls), and the degree (sum of in-degree and out-
degree).
Structural Coupling for Microservices
283

Table 3 shows the example of the calculation
Local Weight Factor (LWF), Global Weight Factor
(GWF) and Structural Coupling (SC) on the same sys-
tem.
Figure 2: The Example of Microservices-based System.
Table 2: Example of metrics for the system in Figure 2.
in-degree out-degree degree #classes
A 4 1 5 50
B 0 1 1 10
C 0 1 1 11
D 0 1 1 17
E 0 1 2 30
4 VALIDATION
Case and Subjects Selection. We selected the 17
projects developed in Java and using Docker from the
Microservice Dataset (Rahman et al., 2019). Table 4
describes the 17 selected projects, providing infor-
mation on the number of microservices in each sys-
tem (#MS), the size of each system in lines of code
(#KLOC), the number of commits and the number of
dependencies (#Dep) .
Data Collection Procedure. For each project, we
counted the number of classes per microservice, to
compare our measure with the measures proposed in
the literature. Then, we calculated the coupling met-
rics proposed in the literature, together with the Struc-
tural Coupling proposed in Section 3.
We generated a csv file collecting metrics in-
degree, out-degree, degree, #classes (number of
classes), LOC (Lines Of Code). For each metric SIY,
LWF, GWF and SC we generated a matrix to calculate
the dependency between all couples of microservices.
Analysis Procedure. For each system, we draw a
chart reporting SC for each pairs of MS. This graph-
ical representation is useful to understand which are
the MS in the system with the highest coupling. In
order to compare the different measures, we also com-
pute descriptive statistics of SC for each microservice.
The results of the analysis are available in the
replication package
1
4.1 Results
From Table 5, we can already observe that the aver-
age values of structural coupling metrics, computed
among all services of each project, tend to be differ-
ent than CBM and that the simple degree metric. This
already confirms our initial conjecture that such met-
ric can provide a different view of the services com-
position of microservice-based applications.
To facilitate the interpretation of such metrics, and
to further confirm our conjecture, we provide a graph
representation of some of the projects (not all of them
for reason of space) in Table 4. In particular, as dis-
cussed in Section 3, given the computed couplings
values among the services it is possible to represent
the service composition of a project as a directed
graph, in which the nodes correspond to the microser-
vices and the weighted edges represent the coupling
dependencies among these nodes. Thus, by leverag-
ing the R packages igraph,sna, and ggplot2, we gen-
erate the graph that is possible to observe in Figure 3.
To simplify the interpretation of the various gen-
erated graph (Figure 3) we used different coloring
strategies: (i) we colored in green all the nodes (ser-
vices) that are a hub in the services coupling network
(i.e., have a high degree); (i) in yellow we colored all
the nodes (services) that act as bridge between two
or more services in the services coupling network; (i)
we colored in blue all the nodes (services) that have a
high out-degree, compared to their in-degree. The re-
maining nodes are colored in red. Finally, the size of
nodes (i.e., services) in the graphs reflect the degree
of each service in the services coupling network (e.g.,
higher is the relative degree of a service compared to
other services, bigger will be its size ).
In the case of Spring (Table 4), the microservices
are connected to each other via an API Gateway, and
this is reflected in the structural coupling: no service
is no structurally coupled with other services. In Fig-
ure 3, we can see that the three coupling metrics pro-
vide different view of the service compositions. In
this specific case, the structural coupling shows a very
well structured service composition. Indeed, in a few
cases we observe a node with a high number of struc-
tural dependencies with other nodes.
Our findings show that the usage of structural cou-
pling can be of high relevance for developers inter-
ested to observe how their services are decomposed.
Moreover, these metrics provide a rather different, but
1
Replication Package: https://github.com/clowee/Structural-
Coupling-for-Microservices
CLOSER 2021 - 11th International Conference on Cloud Computing and Services Science
284
Table 3: SIY, LWF, GWF and SC for the system in Figure 2.
LWF GWF SC
A B C D E A B C D E A B C D E
A 0 0.66 1 1 1 0 2 0 0 0
B 0 0 0.5 0.5 0.5 0 0 1 1 1 0.33 0.5 0.5
C 1 0 0 1 1 0 0 0 0 0 0.5
D 1 0 1 0 1 0 0 0 0 0
Table 4: The selected projects.
Project Name #Ms. KLOC #Commits #Dep.
CQRS microservice application 7 1.632 86 3
E-Commerce App 7 0.967 20 4
EnterprisePlanner 5 4.264 49 2
eShopOnContainers 25 69.874 3246 18
FTGO - Restaurant Management 13 9.366 172 9
Lakeside Mutual Insurance 8 19.363 12 7
Microservice Blog post 9 1.536 90 7
Microservices book 6 2.417 127 5
Open-loyalty 5 16.641 71 2
Pitstop - Garage Management 13 34.625 198 9
Robot Shop 12 2.523 208 8
Share bike (Chinese) 9 3.02 62 6
Spinnaker 10 33.822 1669 6
Spring Cloud Microservice 10 2.333 35 9
Spring PetClinic 8 2.475 658 7
Spring-cloud-netflix 9 0.419 61 6
Vehicle tracking 8 5.462 116 5
Figure 3: Example of Structural Coupling Graph represen-
tation.
also complementary views of the services decompo-
sition. We believe that such metrics can be used for
guiding refactoring operations or re-modularization at
the level of microservice composition. In addition,
they can be used for making quick diagnosis on po-
tential bad developers coordination practices, when
evolving/migrating applications to the cloud.
It is interesting to note that CBM (Taibi and Syst
¨
a,
2019) can not be computed in six projects (out of 17),
while Structural Coupling can anyways be applied. It
is also important to note that our proposal, together
with the graphical representation of the structural cou-
pling, allows to easily see microservices with a high
out-degree and to graphically compare the Structural
Coupling of each node.
5 DISCUSSIONS AND
CONCLUSIONS
Practitioners and researchers agree that microservices
must be lowly coupled and highly cohesive. The
development of microservice-based systems is grow-
ing, however at the best of our knowledge, there are
no validated metrics to evaluate coupling and cohe-
sion between services. Some researchers (Bogner
et al., 2017a) proposed to extend coupling measures
adopted for SOA but these measures have never been
validated nor used in the microservice domain.
In order to help practitioners to clearly identify
coupling between services, in this work, we intro-
duced the Structural Coupling, a metric based on the
structural dependencies between services.
We validated the structural coupling measure on
17 Open Source projects developed with a microser-
vice architectural pattern and we proposed a visual-
ization to graphically represent the measure. Results
show that structural coupling easily shows the degree
of coupling between existing services, and the visu-
alization provided can be adopted to easily spot cou-
pling issues in (micro)services. Differently than other
coupling metrics for microservices, structural cou-
pling seems to be always applicable, while in some
case, CBM (Taibi and Syst
¨
a, 2019) is not applicable,
since its denominator can be zero.
Future works include the packaging of script to
calculate the measures and to generate the visualiza-
tions into an Open Source tool. As for the application
of the structural coupling to different systems, other
type of connections between services should be in-
vestigated. As an example, microservices might be
connected using publisher-subscriber mechanisms, or
using other REST principles such as HATEOAS (Hy-
permedia as the Engine of Application State) that en-
able loose coupling by design. We are planning to
validate these metrics on industrial case studies, to an-
alyze the perceived usefulness (e.g., by analyzing user
and developers feedback (Panichella et al., 2015)) of
Structural Coupling for Microservices
285

Table 5: Results of the Coupling Metrics Applied to the 17 projects.
Project Name Degree SC CBM
Max Avg Med. Stdev Tot Max Avg Med. Stdev Tot Max Avg Med. Stdev
CQRS microservice appl. 1 1 1 0.0 7.25 0.88 0.80 0.75 0.06 2.5 1.0 0.35 1.0 0.23
E-Commerce App 2 1.14 1.0 0.34 8.87 0.88 0.80 0.75 0.06 3.27 1.0 0.46 1.0 0.42
EnterprisePlanner 3 1.00 1.00 0.00 3.50 0.83 0.70 0.67 0.07
eShopOnContainers 8 1.16 1.00 0.46 71.06 0.94 0.91 0.94 0.03
FTGO - Restaurant Man. 2 1.13 1.0 0.33 24.00 0.9 0.86 0.9 0.05 0.39 0.12 0.03 0.04 0.34
Lakeside Mutual Ins. 3 1.67 1.00 1.05 6.67 0.83 0.74 0.67 0.08 1.12 1.00 0.12 0.03 0.39
Microservice Blog post 4 1.10 1.00 0.30 13.75 0.88 0.81 0.75 0.06 3.61 1.00 0.36 0.50 0.25
Microservices book 1 1.83 1.00 1.86 1.00 0.50 0.20 0.00 0.24 2.75 1.00 0.46 0.30 0.41
Open-loyalty 3 1.20 1.00 0.40 2.83 0.83 0.71 0.67 0.07
Pitstop - Garage Manag. 3 1.15 1.00 0.53 14.50 0.83 0.76 0.83 0.08 1.14 0.33 0.09 0.08 0.11
Robot Shop 4 1.50 1.00 0.76 9.38 0.88 0.78 0.75 0.05
Share bike (Chinese) 3 1.10 1.00 0.30 11.33 0.83 0.76 0.83 0.08 2.38 1.00 0.24 0.13 0.43
Spinnaker 7 1.20 1.00 0.60 18.79 0.93 0.89 0.93 0.04
Spring Cloud Micros. 7 1.10 1.00 0.30 23.21 0.93 0.89 0.89 0.04 5.75 1.00 0.57 1.00 0.41
Spring PetClinic 2 1.09 1.00 0.29 7.75 0.75 0.60 0.50 0.12 3.01 1.00 0.27 0.35 0.29
Spring-cloud-netflix 7 1.11 1.00 0.31 23.29 0.93 0.90 0.93 0.04 5.75 1.00 0.64 1.00 0.29
Vehicle tracking 4 1.00 1.00 0.00 13.88 0.88 0.82 0.88 0.06
Table 6: Results of the LWF and GWF of the 17 projects.
Project Name
LWF GWF
Tot Max Avg Med. Stdev Tot Max Avg Med. Stdev
CQRS microservice application 7.0 1.0 0.78 1.0 0.25 2.25 0.25 0.25 0.25 0.0
E-Commerce App 8.5 1.0 0.77 1.0 0.25 2.75 0.25 0.25 0.25 0.0
EnterprisePlanner 4.5 1.0 0.9 1.0 0.2 1.67 0.33 0.33 0.33 0.0
eShopOnContainers 55.5 1.0 0.71 0.5 0.25 9.75 0.13 0.13 0.13 0.0
FTGO - Restaurant Management 20.0 1.0 0.71 0.5 0.25 5.6 0.2 0.2 0.2 0.0
Lakeside Mutual Insurance 7.0 1.0 0.78 1.0 0.25 3.0 0.33 0.33 0.33 0.0
Microservice Blog post 13.0 1.0 0.76 1.0 0.25 4.25 0.25 0.25 0.25 0.0
Microservices book 4.0 1.0 0.8 1.0 0.24 5.0 1.0 1.0 1.0 0.0
Open-loyalty 3.5 1.0 0.88 1.0 0.22 1.33 0.33 0.33 0.33 0.0
Pitstop - Garage Management 13.5 1.0 0.71 0.5 0.25 6.33 0.33 0.33 0.33 0.0
Robot Shop 10.5 1.0 0.88 1.0 0.22 3.0 0.25 0.25 0.25 0.0
Share bike (Chinese) 11.0 1.0 0.73 0.5 0.25 5.0 0.33 0.33 0.33 0.0
Spinnaker 15.5 1.0 0.74 0.5 0.25 3.0 0.14 0.14 0.14 0.0
Spring Cloud Microservice 19.5 1.0 0.75 0.75 0.25 3.71 0.14 0.14 0.14 0.0
Spring PetClinic 10.5 1.0 0.81 1.0 0.24 6.5 0.5 0.5 0.5 0.0
Spring-cloud-netflix 19.0 1.0 0.73 0.5 0.25 3.71 0.14 0.14 0.14 0.0
Vehicle tracking 12.5 1.0 0.74 0.5 0.25 4.25 0.25 0.25 0.25 0.0
the visualization and to analyze further correlations
between coupling and maintenance effort or other
software qualities perceived by the developers. Future
works also include the definition and validation of
metrics to evaluate the system decomposition, includ-
ing cohesion metrics. Moreover, future works include
the application of Structural Coupling to other cloud-
native technologies such as serverless functions.
REFERENCES
Amaral, M., Polo, J., Carrera, D., Mohomed, I., Unuvar,
M., and Steinder, M. (2015). Performance evaluation
of microservices architectures using containers. In Int.
Symp. on Network Computing and Applications.
Azadi, U., Arcelli Fontana, F., and Taibi, D. (2019). Ar-
chitectural smells detected by tools: a catalogue pro-
posal. In Int. Conf. on Technical Debt (TechDebt).
Bogner, J., Wagner, S., and Zimmermann, A. (2017a). Au-
tomatically measuring the maintainability of service-
and microservice-based systems: A literature review.
In Int. Conf. on Software Process and Product Mea-
surement, IWSM Mensura ’17, pages 107–115.
Bogner, J., Wagner, S., and Zimmermann, A. (2017b). To-
wards a practical maintainability quality model for
service-and microservice-based systems. In European
Conference on Software Architecture, ECSA ’17.
Bouwers, E., Correia, J. P., v. Deursen, A., and Visser, J.
(2011). Quantifying the analyzability of software ar-
chitectures. In Int. Conf. on Software Architecture.
Chidamber, S. R. and Kemerer, C. F. (1994). A metrics
suite for object oriented design. IEEE Trans. Softw.
Eng., 20(6):476–493.
CLOSER 2021 - 11th International Conference on Cloud Computing and Services Science
286

Dragoni, N., Giallorenzo, S., Lafuente, A. L., Mazzara, M.,
Montesi, F., Mustafin, R., and Safina, L. (2017). Mi-
croservices: Yesterday, Today, and Tomorrow, pages
195–216. Springer International Publishing.
Engel, T., Langermeier, M., Bauer, B., and Hofmann, A.
(2018). Evaluation of microservice architectures: A
metric and tool-based approach. In Information Sys-
tems in the Big Data Era, pages 74–89.
Fenton, N. E. (1991). Software Metrics: A Rigorous Ap-
proach. Chapman & Hall, Ltd., London, UK, UK.
Hasselbring, W. and Steinacker, G. (2017). Microservice
architectures for scalability, agility and reliability in
e-commerce. In Int. Conf. on Software Architecture
Workshops (ICSAW), pages 243–246.
Hirzalla, M., Cleland-Huang, J., and Arsanjani, A. (2009).
Service-oriented computing — icsoc 2008 workshops.
In A Metrics Suite for Evaluating Flexibility and Com-
plexity in Service Oriented Architectures.
Kramer, S. and Kaindl, H. (2004). Coupling and co-
hesion metrics for knowledge-based systems using
frames and rules. ACM Trans. Softw. Eng. Methodol.,
13(3):332–358.
Lenarduzzi, V., Lomio, N., Saarim
¨
aki, N., and Taibi, D.
(2020). Does migrating a monolithic system to mi-
croservices decrease the technical debt? Journal of
Systems and Software, 169:110710.
Lenarduzzi, V. and Taibi, D. (2018). Microservices, contin-
uous architecture, and technical debt interest: An em-
pirical study. In Euromicro SEAA: Work in Progress.
Lewis, J. and Fowler, M. (2014). Microservices.
www.martinfowler.com/articles/microservices.html,
Accessed: December 2016.
Martin, D. and Panichella, S. (2019). The cloudifica-
tion perspectives of search-based software testing. In
Gorla, A. and Rojas, J. M., editors, Int. Workshot on
Search-Based Software Testing, pages 5–6.
Myers, C. R. (2003). Software systems as complex net-
works: structure, function, and evolvability of soft-
ware collaboration graphs. CoRR, cond-mat/0305575.
Neri, D., Soldani, J., Zimmermann, O., and Brogi, A.
(2020). Design principles, architectural smells and
refactorings for microservices: a multivocal review.
SICS Softw.-Intensive Cyber Phys. Syst., 35(1):3–15.
Pahl, C. and Jamshidi, P. (2016). Microservices: A system-
atic mapping study. In Int. Conf. on Cloud Computing
and Services Science, pages 137–146.
Panichella, S., Sorbo, A. D., Guzman, E., Visaggio, C. A.,
Canfora, G., and Gall, H. C. (2015). How can i im-
prove my app? classifying user reviews for software
maintenance and evolution. In Int. Conf. on Software
Maintenance and Evolution, ICSME, pages 281–290.
Perepletchikov, M., Ryan, C., Frampton, K., and Tari, Z.
(2007). Coupling metrics for predicting maintainabil-
ity in service-oriented designs. In Australian Software
Engineering Conference (ASWEC’07).
Pigazzini, I., Arcelli Fontana, F., Lenarduzzi, V., and Taibi,
D. (2020). Towards microservice smells detection. In
Proceedings of the 3rd International Conference on
Technical Debt, TechDebt ’20, page 92–97.
Rahman, M. I., Panichella, S., and Taibi, D. (2019). A cu-
rated dataset of microservices-based systems. In Joint
Proceedings of the Summer School on Software Main-
tenance and Evolution.
Rud, D., Schmietendorf, A., and Dumke, R. R. (2006).
Product metrics for service-oriented infrastructures
product metrics for service-oriented infrastructures. In
Int. Works. on Software Metrics (IWSM).
Savic, M., Ivanovic, M., and Radovanovic, M. (2017).
Analysis of high structural class coupling in object-
oriented software systems. Computing, 99(11):1055–
1079.
Shim, B., Choue, S., Kim, S., and Park, S. (2008). A de-
sign quality model for service-oriented architecture.
In Asia-Pacific Software Engineering Conference.
Soares de Toledo, S., Martini, A., Przybyszewska, A., and
Sjøberg, D. I. K. (2019). Architectural technical debt
in microservices: A case study in a large company. In
Int. Conf. on Technical Debt (TechDebt).
Soldani, J., Tamburri, D. A., and Heuvel, W.-J. V. D. (2018).
The pains and gains of microservices: A systematic
grey literature review. Journal of Systems and Soft-
ware, 146:215 – 232.
Taibi, D., Auer, F., Lenarduzzi, V., and Felderer, M. (2021).
From monolithic systems to microservices: An as-
sessment framework. Information and Software Tech-
nolology.
Taibi, D. and Lenarduzzi, V. (2018). On the definition of
microservice bad smells. IEEE Software, 35(3):56–
62.
Taibi, D., Lenarduzzi, V., and Pahl, C. (2017). Processes,
motivations, and issues for migrating to microservices
architectures: An empirical investigation. IEEE Cloud
Computing, 4(5):22–32.
Taibi, D., Lenarduzzi, V., and Pahl, C. (2018). Architec-
tural patterns for microservices: A systematic map-
ping study. In Int. Conf. on Cloud Computing and
Services Science - CLOSER, pages 221–232.
Taibi, D., Lenarduzzi, V., and Pahl, C. (2019). Microser-
vices architectural, code and organizational antipat-
terns. Communications in Computer and Information
Science (Springer), pages 126–151.
Taibi, D., Lenarduzzi, V., and Pahl, C. (2020). Microser-
vices Anti-patterns: A Taxonomy, pages 111–128.
Springer International Publishing, Cham.
Taibi, D. and Syst
¨
a, K. (2019). From monolithic systems
to microservices: A decomposition framework based
on process mining. In Int. Conf. on Cloud Computing
and Services Science, CLOSER 2019).
Taibi, D. and Syst
¨
a, K. (2020). A decomposition and
metric-based evaluation framework for microservices.
In Cloud Computing and Services Science.
Yourdon, E. and Constantine, L. L. (1979). Structured De-
sign: Fundamentals of a Discipline of Computer Pro-
gram and Systems Design. Prentice-Hall, Inc.
Structural Coupling for Microservices
287
