
A Social Network Approach for Student’s School Performance
Measurement
Waldir Siqueira Moura
a
, Mônica Ferreira da Silva
b
, Jonice de Oliveira Sampaio
c
,
Tainá Guimarães de Souza
d
, Elton Carneiro Marinho
e
and Victor Prado
f
Computer Science Graduate Program, PPGI, Federal University of Rio de Janeiro, Térreo, Bloco E, CCMN/NCE,
University City, post code 68.530, Rio de Janeiro, Brazil
vhdoprado@hotmail.com
Keywords: Analysis of Social Networks, School Performance, Method.
Abstract: This article brings to light analyses of student’s social networks in order to comprehend how social
interactions occur in schools. Furthermore, the present research intents on verifying if social groups affect
student’s performance. In view of this reality, this work presents the analysis of 40 social network students
with the objective of measuring the degrees of interrelationship between groups to provide means of
implementing the process of building Collective Knowledge in the classroom. One of the main challenges
encountered at work is the understanding between native psychic and somesthetic students. From the data
collection of the experiment, it was evidenced that there is a strong correlation between the networks of
friendships and grades, which allowed to verify that repeating students do not fit in with students of the
grade in which they are and that students with good grades have many friendship bonds, however these bonds
are weak since they are only bonds with interest in the notes. The Collective Knowledge applied by the
teacher must collaborate for the interrelation of the students and, consequently, in the strengthening of bonds
and grades.
a
https://orcid.org/0000-0003-1545-7487
b
https://orcid.org/0000-0003-0951-6612
c
https://orcid.org/0000-0002-2495-1463
d
https://orcid.org/0000-0002-8311-5043
e
https://orcid.org/0000-0003-0117-0610
f
https://orcid.org/0000-0003-3960-7195
1 INTRODUCTION
This article brings to light analyses of student’s
social networks in order to comprehend how social
interactions occur in schools. Furthermore, the
present research intents on verifying if social groups
affect student’s performance. Its goal is to help
teachers better comprehend different student’s groups
and support the development of cooperative work
inside the classroom.
The formation of groups to develop collaborative
work within the classroom is a rich tool that can
provide the development of Collective Knowledge
effectively, provided there is planning. For this
reason, understanding how social interactions and
school performance influence the formation of these
interactions is something relevant.
The difficulties of inter-relationship between
students and problems of implementation and use of
technology as pedagogical and social tools, is the
reason behind the current research. The literature
chosen for this research, comes from Professor
Xavier’s psychogenetics, with origin in Piaget’s
psychogenetic study which is directed at the
fundamentals of intelligence. The main focus of the
chosen research, is the thorough comprehension of
the human behaviour, cognition and the interactions
of metacognition.
Inter-relationship is fundamental, as explained by
Delbem (2014), because within it, students are able to
develop connections, have existential exchanges,
establish dialogue, be interested in cooperative work
and feel rewarded by reciprocity.
Moura, W., Silva, M., Sampaio, J., Souza, T., Marinho, E. and Prado, V.
A Social Networ k Approach for Student’s School Performance Measurement.
DOI: 10.5220/0010480003110318
In Proceedings of the 13th International Conference on Computer Supported Education (CSEDU 2021) - Volume 2, pages 311-318
ISBN: 978-989-758-502-9
Copyright
c
2021 by SCITEPRESS – Science and Technology Publications, Lda. All r ights reserved
311

Our proposal, as a possible solution towards this
research problem, is to, it is the tangent between
students' native and non-native competences for
integral development that occurs through the
awareness of the individual to the collective, that is,
the awareness that not only should personal and
comfortable factors be considered, but also external
objective characters, common objectives that require
the collaboration of two or more individuals with
divergent native capacities.
As a main result we found after the experiment
that the higher the number of the entry grade, the
higher the student's grade. That is, in this experiment
we can see that the more friends the student has, the
greater his chance of getting a grade. We also noticed
that there is a strong correlation between the networks
of friendships and grades, which allowed to verify
that repeating students do not fit in with students of
the grade in which they are and that students with
good grades have many friendship bonds, however
these bonds are weak since they are only bonds with
interest in the notes
In order to organize the discussion and proposals
described in this article, it is divided into the
following sections: section 2 presents the conceptual
foundations (metrification of complex networks, and
theoretical framework of the research). Section 3
presents the related papers. Section 4 describes the
methodology used to conduct the study presented in
this article. Section 5 displays the data analysis and
its results. And finally, section 6 presents the
conclusions and future work of this research.
2 CONCEPTUAL FOUNDATIONS
2.1 Collaborative Work
For the development of this article, we utilized the
following concept of Social Network. Social
networks are an essential part of humanity (Bezerra
2014). These networks are based on the
interrelationships between humans seeking a
common goal, between entities and can be mediated
and metrified using technologies, as we can see in
Bastos (Bastos, Queiroz 2015). The observation and
research to raise patterns of connection between
social groups and how connections are established
between individuals is something already found in
current research, however there is no metric that
makes it possible to see how social interactions within
certain networks interfere in academic development.
The formation of networks in school, operate in
the same manner as other networks, as explained by
the concept cited above. This means that, the results
of the two enturmentations, we can say that the
productivity considered in the different objectives can
differentiate in relation to collaborative work and its
production. Based on the 3C model
7
(Fuks; Pimentel,
2011) we proposed some of the main differences
that we believe to be distinct in both groupings:
In strictly hedonistic groups we emphasize
communication and cooperation, because the
members of this group are associated not only with a
view of an objective and its development, but
especially by common affinities and tastes, which
creates a strong interactional bond between the
members, but disregards productive capacity
specifically. Therefore, these groups have strong
interactional and collaborative bonds, but with
exceptions such as a football match, for example, they
do not tend to be organized by skills, and there are
exclusions of weaker members.
Conversely, utilitarian groupings - although they
may occur as practical communities - tend to occur in
the face of a specific activity, challenge or need. In
this case, the communication between the members
already has a character of commitment to the
objective, the coordination is a fundamental
characteristic, because the objective is the focus
through which the groups will organize and divide
and, therefore, the skills of each member are
considered.
7
It is the model that classifies into three dimensions the
systems that support group work: communication,
coordination and collaboration. This classification gave
rise to the 3C Collaboration model, later formulated. In
this model, cooperation strictly refers to the action of
operating together, while collaboration refers to the action
of doing all the work together, which involves
communication, coordination and cooperation.
The main difference highlighted for the differentiation
of these groupings is the planned coordination, that is,
while in the hedonite grouping this coordination takes
place naturally or not, in the utility grouping it is
fundamental, because the primary objective of this
grouping is to achieve a pre- established objective that
requires the action of ordering the grouping in tasks and
resources according to the capacities of each member.
To understand the scenario of the problem proposed in
this research, we start from the hypothesis that its solution
is to create a means for mapping students' social networks
to formulate a metrification that enables an intervention
that potentializes the tangent of young people's interrelated
capabilities through collective knowledge. We consider
that the methods of work and of potentiation of collective
knowledge are sufficient, but we also recognize that their
application does not favour the means for mapping the
social networks of the participants nor potentiates the ideal
enturmation that aims at the real inter-relational tangency.
CSEDU 2021 - 13th International Conference on Computer Supported Education
312

Even though social networks are apparently
similar to others. When it comes to complex social
network analysis among students, the concerns
become greater, since metrifying their personal
interrelationships and their individual performance is
not a trivial task. Thus, this metrification should
develop sufficient data for the verification of
utilitarian and hedonistic relationships, so that
through this data, teachers can intervene and form
groups in which students with low school
performance and more difficulty in interacting feel
involved and motivated in the learning process.
2.2 Psychogenetics
In creating the metrics for mapping the tangency
(Xavier 2004) of these social networks, our attention
was focused on observing the relationships of students
within the school, both in class and at intervals, for
analyses, Xavier’s psychogenetics was used.
According to psychogenetics (Xavier 2004),
psychism and somesthesis are propositional concepts.
Thus, psychism groups the competencies for the so-
called "superior" activities, while somesthesis groups
the bodily functions correlated to the so-called
"human" activities. Both definitions refer, according
to Delbem (Delbem 2014), to the difference of energy
to action, that is, psychism is the pattern of innovation
dosed with somesthesis, and somesthesis is the
pattern of somatic repetition accelerated by the
psychism.
The tangency is the articulation of these two
instances, and it is understood as articulation, the
evolutionary structure, measurable by seasonal
diachrony. As Xavier explains (Xavier 2004)
articulation is the meeting of these two energies
which, according to him, can be understood as
hybridization
8
, this is because the energies coexist in
a process of complementing one with the other, they
do not merge into another.
Therefore, it can be understood that a higher
density in one instance does not require damage to the
other, because one instance has no quota to the
detriment of another. Therefore, articulation is
summed up as the regulation between somesthesis,
psychism and tangency as the balance between all.
This is understood as "native", the predominant
energy in the individual that can also be called as a
pioneer competence, that is, it is the individual's
strong point.
8
Hybridization is the acquisition of new properties by
combination with the other energy (somesthesis or
psychism).
3 RELATED WORKS
One of the aspects that marks the 2.0 generation of
the Internet is the idea of co-authorship, that is,
collaborative production. This is because, as
cyberspace is an environment of production and
consumption in an expanded way, collaborative
production is achieved through co-authoring, which
we can call cyber culture (Fuks; Pimentel, 2011).
This incorporation of the digital into our daily
lives has resulted in what the artist and researcher
Domingues calls biohybrids, that is, a biological,
cybernetic and hybrid subject; and this reality allows
the generation of biohybrid narratives of life in a
mixed way (Domingues, 2004).
The concept of network, according to Deroy-
Pineau (Deroy 1994) can be recognized through its
effectiveness, both as the static point of use and the
dynamic point of use. The static point of use exploits
the structure of the network, while the dynamic point
exploits the system that constitutes the network.
The analysis of social networks establishes a new
paradigm, since the study of the behaviour or
opinions of individuals depends on the structures in
which they are inserted, Thus, the unit of analysis is
not individual - sex, class, age, gender, etc. - but the
whole built through the interpellation of the whole.
This structure is illustrated and apprehended
concretely by the network of relationships and
limitations that weighs on the choices, orientations,
behaviours and opinions of individuals as Bastos
explains (Bastos et al. 2014).
The analysis of networks is not an end in itself. It
is the means to carry out a structural analysis whose
objective is to show in which form the network
explains the analysed phenomena. The objective is to
demonstrate that the analysis of a diode (interaction
between two people) only makes sense in relation to
the set of other diodes of the network, because its
structural position necessarily has an effect on its
form, its content and its function (Marteleto 2001).
The basic premise of information technology is
management through the epistemic-ethical posture
of the individual in the exercise of his autonomy in
social media as Delbem states (Delbem 2014). Its
starting point is the 'Inter-relationship' as a marker of
cognitive development. Thus, interaction precedes
and determines knowledge. Therefore, one
investigates doing, living together, collaborating,
producing, knowing, reciprocating, finally, inter-
relationship.
Marinho also used the Technology Acceptance
Model (TAM) to identify different motivational
factors of the use of a Virtual Teaching Platform
A Social Network Approach for Student’s School Performance Measurement
313
(Marinho et al., 2015).
One important characteristic of social network
analysis is the capacity of describing mathematically
the characteristics of a node in a network. The
positions of notes in networks are frequently
described in terms of centrality. The three main points
of centrality are the degree of centrality,
intermediation centrality and proximity centrality
(Degenne e Forse 1999).
For example, Liu et al., Use these concepts and
analyze the dynamic characteristics of the network
structures and, in fact, found that the structure of the
students' social network varies dynamically with the
progress of the course. In the same article, they
concluded that "in the interactions of the course
forum, the positions of students in the network are
partially correlated to learning results" (Liu et al.,
2018).
Still in a school environment, social networks
allow the prediction of learning success in education
with their tools offering results that can direct the
attention of teachers to their teaching practice, that is,
through analysis in this environment, tools for
modification are added in the physical environment in
which the research actors are inserted (Souza et. al,
2018).
So the operations of the academic subjects carried
out in virtual spaces by adolescents maintain the
concreteness of proprioception coming from the
instantiated functioning in 'somesthesis'. The virtual
space aggregates the conceptual data, but without
losing the bodily reality. It only changes the state
from real to virtual, preserving the experience of
contact with the real object (Delbem 2014).
4 METHODOLOGY USED
The problem that permeates this research is
understanding how school social interactions are
formed. As well as verify how school performance is
influenced by social groups. To understand how these
networks are developed, might help teachers to map
and comprehend the main difficulties students face
during group work. With this, a strategy can be
crafted for the development of the student within
groups, since low levels of cooperation results in
lower rates of interactions (relationships).
The formations of these networks work in the
same way as the networks of practical communities,
that is, they are made up of informal groups that have
a shared practice and a clear and defined objective.
Therefore, for the metrification of the students' social
networks a questionnaire, which is found in table 1,
was first elaborated, individually made for 40
previously selected students (considering that all of
them studied together since the sixth grade of
elementary school II). In this questionnaire the
preferences of the students in various psychic and
motor activities were considered, as well as a
previous spontaneous survey of their networks of
friends, where they highlighted the friends they have
for specific activities (in sports, collaborative digital
games - like RPG, for example -, school work,
proximity to home, etc). As seen in table 1.
Table 1: Questionnaire applied during the survey.
Application questionnaire template
Student:
Age:
Friend of:
Applied questions
Do you practice any sport?
Yes No Which one
Do any friends play on your team?
Do you play video games or online games?
Do you usually play alone or in a group?
Do any classmates live near your home?
Like to read? If so, what genre?
Do you do any kind of artistic activity?
Social media you use:
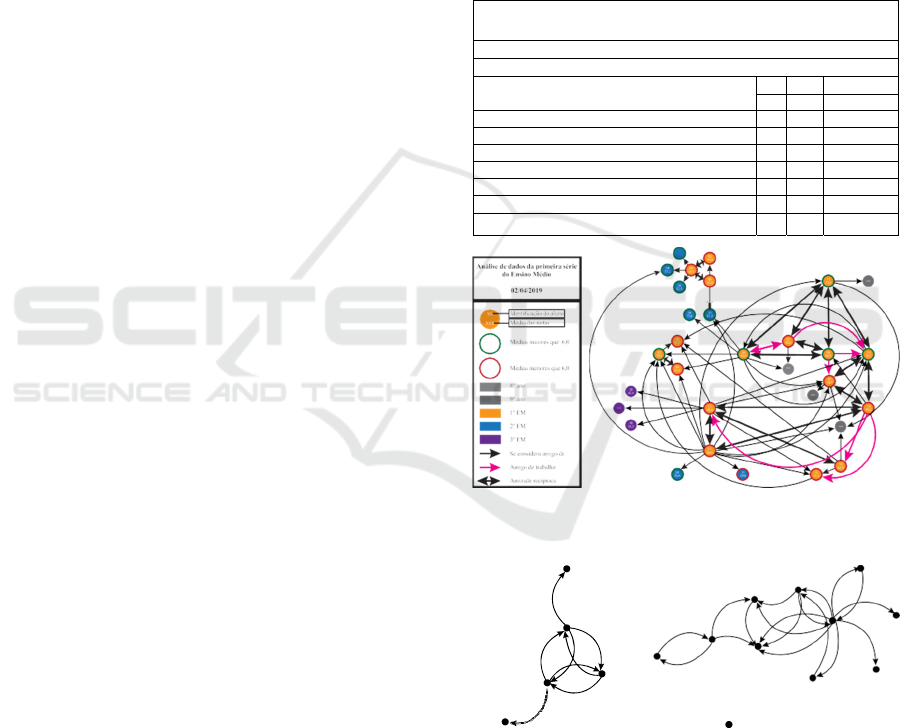
Figure 1: A Detailed analysis of the social networks of first
grade high school students.
Figure 2: Social network graph of High School 1
st
Grade
students.
After the interview, an observation was initiated
with the teachers, where some of them were
previously instructed (those who considered the data
collected in the interview). This observation was
intended to confirm, or refute, the data previously
provided and tabulated by the interview.
CSEDU 2021 - 13th International Conference on Computer Supported Education
314

Based on the reports of teachers who have
followed the development of students since the sixth
grade of elementary school II, it was possible to see
how interactions between them take place. These
reports provided data that confirm much of the
information gathered in the interview, reinforcing the
informed social networks.
After this return of comparative data between the
interview and the observation, the data was analysed
within Cytoscape
9
, which is an open-source software
platform for viewing complex networks. After the
construction of the graphs of the social networks
(built with the help of the software), the following
metric was analysed and calculated: In-degree (which
is the degree of entry of the vertex). It was
calculated based on the number of friends of each
student and based on their relationships. For
example, a student ‘x’ can have a number ‘y’ of
friends and a number ‘z’ of work friends only. So,
first the total entry grade was raised and then
subdivided between work friends and personal
friends.
To establish a correlation between the in-degree
metric and the average score (which corresponds to
the student's performance in the subjects), we use the
CCP which measures the degree of linear correlation
between these two quantitative variables. The CCP is
a dimensional index with values between -1.0 and 1.0
that reflects the intensity of a linear relationship
between two data sets.
In our analysis, this coefficient is represented
below the graphs by the letter "r" and assumes only
values between -1 and 1, being that 1 means a perfect
positive correlation between the two variables and -1
a perfect negative correlation between the two
variables - that is, if one increases, the other always
decreases. This way, we consider that r=0 means
that the two variables do not depend linearly on each
other. Therefore, based on the metrics of social
network analysis and the CCP calculation, we
propose a formal system that has rules for the analysis
of interactions and their representations.
After the interrelationships were found, the data
collected was strengthened. The notes of each student
were collected from the coordination of the College,
thus generating a general individual performance
average, and with this data, cross-references of
information between the analysis of the social
network and the averages were made.
9
https://cytoscape.org/ - Accessed 20/09/2019
5 DATA AND ANALYSIS
RESULTS
The experiment was developed on April 2, 2019
targeting students in 1st, 2nd and 3rd grades. The age
of the participants was between 15 and 17 years, and
the number of participants was 40 students. The
method used to collect and analyze the data was
through the empirical sieve, that is, a prior interview
was developed with 40 students regularly enrolled in
the first to third grades of a high school in a private
network and of teacher’s reports.
In this first graph that represents the
interrelationships of the first-grade students (Figure
2), we can see how the networks between them are
structured and with this we can conclude that I - the
student number 13, located in the right median corner,
has the highest average in the class. We can also
observe the large number of entries he has, however,
although he considers all the entries as reciprocal
friendship, the vast majority of the entries consider
him only as a work friend and not as a personal friend,
as can be observed by the pink arrows. Another
important data that we can observe in this graph is the
list of student’s numbers 05, 06 and 03 that are
located in the upper left corner. As can be seen, the
grades of the trio are below average and they do not
relate to anyone in their class. After these findings,
we sought more information about these students and
found that the three are repeat students.
We highlight here, that as mentioned earlier, these
were considered for this deeper analysis in the first
year of high school because it is a class where
students have lived together since the sixth year of
elementary school II. In other words, they have
maintained the same group as the previous year and
have maintained the interrelationships with the
friends who were approved. This leads us to
consider that there may be a cause-and-effect
relationship between poor performance because they
do not interact with peers in the current grade.
In this detailed chart we can consider a way of
approach to improve student performance, being the
implementation of a model of induced collaborative
work, where the teacher should naturally include
student number 13 to work with students’ number 05,
06 and 03. This way, the network of interest for his
grade is broken and failed students have the
opportunity to produce and be approved. The other
two series (Figure 5 and Figure 6) are presented here
only in their simplified form to highlight the issues
discussed in this article.
A Social Network Approach for Student’s School Performance Measurement
315
4
6 8
10
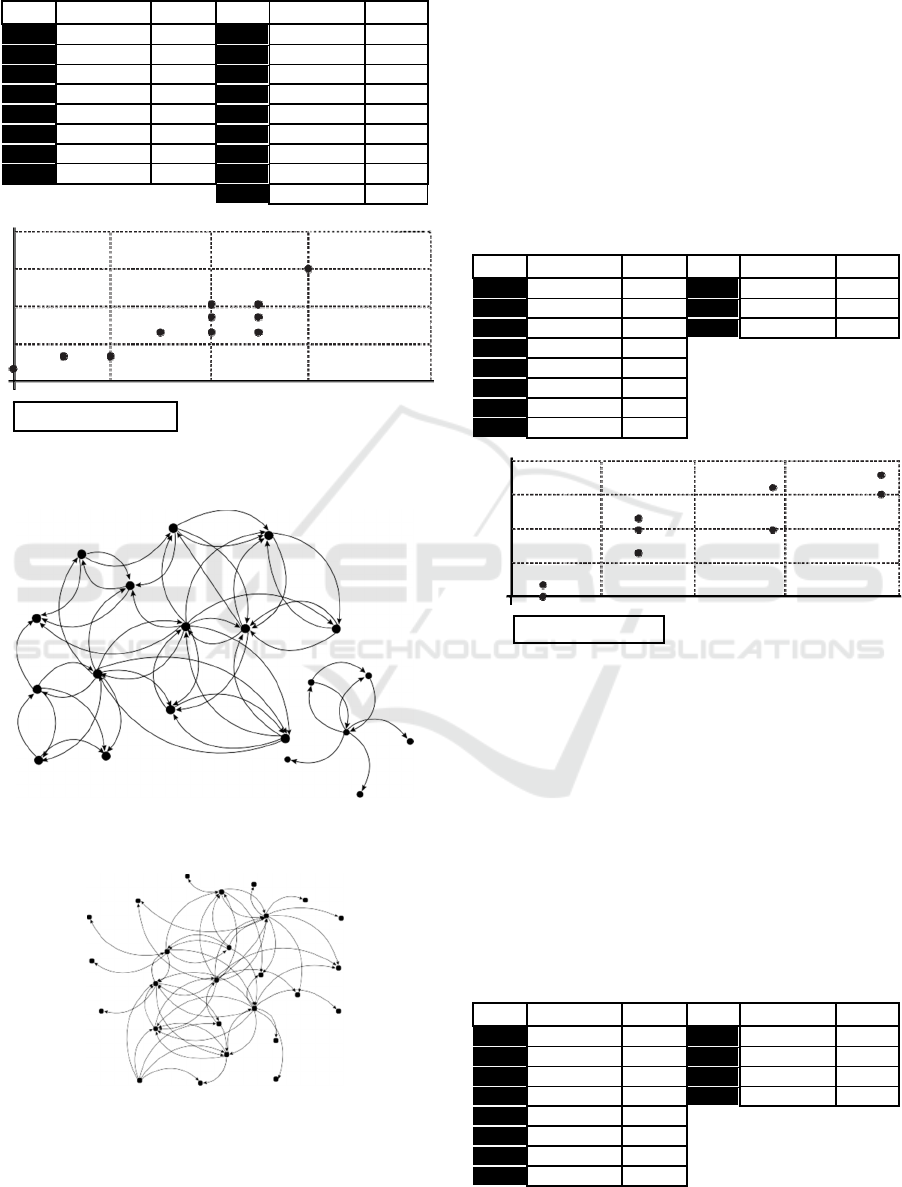
Table 2: Analysis input degree x grade 1
st
series High
School.
Student
Input degree Grade
Student
Input degree Grade
1 6 58,9 9 4 62,6
2 6 70,5 10 5 65,9
3 2 49,0 11 5 58,4
4 4 57,5 12 6 73,9
5 2 56,9 13 9 76,1
6 1 35,0 14 4 49,2
7 4 50,0 15 4 57,3
8 4 64,8 16 5 37,7
17 3 56,6
12
9
6
3
0
Figure 3: Pearson correlation coefficient for input degree x
grade 1
st
High School.
Figure 4: Social network graph of High School Third
Grade students.
Figure 5: Social network graph of Secondary School
students.
After structuring the social networks of each
room, and analysing the data according to the graph
theory, the comparative tables were constructed with
the information surveyed in order to prepare the
Pearson's Correlation Coefficient chart.
In Table 2 we have the number that represents the
student, which is a standardized numbering and does
not correspond to the actual call number made to
make it impossible to recognize the student by an
external agent. In Figure 3 we find the Pearson
Correlation Coefficient graph, which was calculated
by this data.
Table 3: Analysis input degree x grade 1
st
series High
School.
Student
Input degree Grade
Student
Input degree Grade
18 4 80,0 26 4 82,8
19 2 77,2 27 2 77,5
20 4 82,7 28 2 73,0
21 1 69,8
22 3 81,0
23 3 76,4
24 2 76,4
25 1 68,6
84
80
76
72
68
Figure 6: Pearson correlation coefficient for input degree x
grade 2
st
High School.
As can be seen (Table 3 and Figure 6), there is a
positive linear correlation between Input Grades and
Grades. In detail, this means that the higher the input
grade number, the higher the student's grade, i.e., the
more friends the student has the better chance of
achieving a grade. Considering that Pearson's
correlation coefficient in the 2nd year High School
analysis is 0.8030 we can conclude that this
correlation is strong.
Table 4: Analysis input degree x grade 3
rd
series High
School.
Student
Input degree
Grade
Student
Input degree Grade
29 2 42,5 37 3 59,9
30 6 70,0 38 6 80,0
31 5 66,3 39 3 54,3
32 5 70,0 40 6 70,9
33 6 75,8
34 4 61,6
35 4 62,2
36 6 75,3
Pearson correlation coefficient’s:
r = 0.8030
Pearson correlation coefficient’s:
r = 0.8419
0,8 1.6 2.4
3.2
4
CSEDU 2021 - 13th International Conference on Computer Supported Education
316
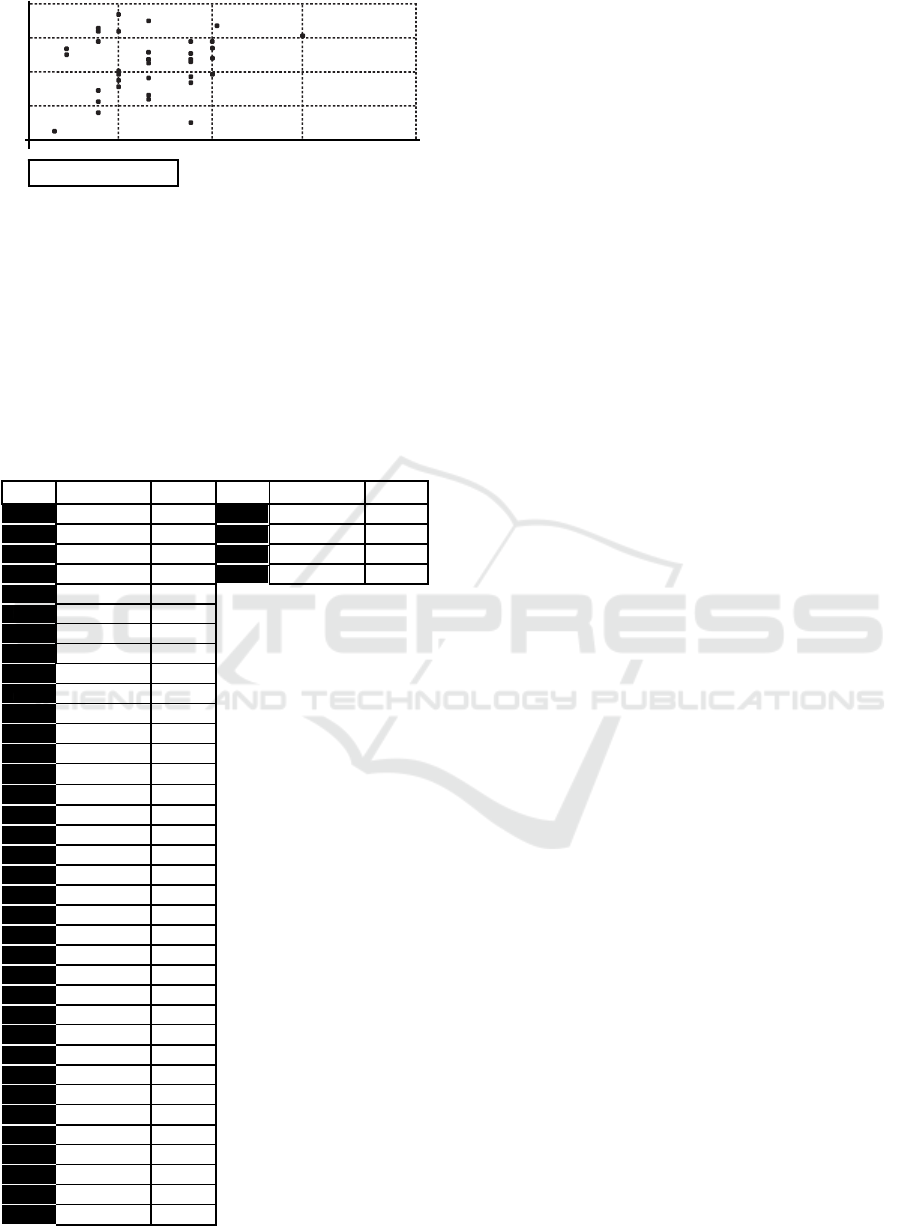
90
75
60
45
30
Figure 7: Pearson correlation coefficient for input degree x
grade 3
rd
High School.
As can be seen (Table 4 and Figure 7), there is a
positive linear correlation between the Input Grades
and Grades. In detail, this means that the higher the
number of input grades, the higher the student's score.
Considering that Pearson's correlation coefficient in
the analysis of the 3rd year of MS is 0.5686 we can
conclude that this correlation is strong.
Table 5: Analysis Input degree x 1
st
, 2
nd
and 3
rd
grade.
Student
Input degree Grade
Student
Input degree Grade
1 6 58,9 37 3 59,9
2 6 70,5 38 6 80,0
3 2 49,0 39 3 54,3
4 4 57,5 40 6 70,9
5 2 56,9
6 1 35,0
7 4 50,0
8 4 64,8
9 4 62,6
10 5 65,9
11 5 58,4
12 6 73,9
13
9
76,1
14
4
49,2
15 4 57,3
16 5 37,7
17 3 56,6
18 4 80,0
19
2
77,2
20 4 82,7
21 1 69,8
22 3 81,0
23 3 76,4
24 2 76,4
25 1 68,6
26 4 82,8
27 2 77,5
28 2 73,0
29 2 42,5
30 6 70,0
31 5 66,3
32 5 70,0
33 6 75,8
34 4 61,6
35 4 62,2
36 6 75,3
As can be seen (Table 5 and Figure 7), there is a
positive linear correlation between the Input Grade
and the Grades of the 3 high school series when they
are compared with each other. This may mean that the
higher the input grade number the higher the student's
grade. That is, in this experiment we can notice that
the more friends the student has, the higher is their
chance to achieve a grade. Considering that Pearson's
correlation coefficient in this case is 0.5000 we can
conclude that this correlation is strong.
However, the entry note and the note have a
strong relationship repeatedly, as we can observe in
the analysis, which indicates that the research can be
reproduced by other researchers through the
questionnaire applied to the students found in table 1.
As the results of this analysis show, that students with
more friends have a higher chance of obtaining a
grade. Also noted was that there is a strong correlation
between the networks of friendships and grades,
which allowed to verify that repeating students do not
fit in with students of the grade in which they are and
that students with good grades have many friendship
bonds, however these bonds are weak since they are
only bonds with interest in the notes.
6 COMPLETION AND FURTHER
WORK
The difficulties of interrelationship between students,
and the problems of implementing and using
technologies as pedagogical and inter-relational
tools is what motivated us to develop this research.
Technology can be a facilitator in this process of
implementing educational technology in schools, but,
according to Sancho (8), for this to happen, it needs
to be inserted together with a reflection and action
project that uses it in a meaningful way.
What is expected, is that the school is favoured
with tools, for the development of a method that
enables the creation of group works in class, it means
offering collaborative and inter-relational work
among students by developing processes that allow
the control of technologies and their effects, so that,
in this way, students can fully develop through the
interrelation with the aid of technologies.
We believe that a quality human structure should
be tangentiated between psychic (groups the
competencies for the so-called "superior" activities)
and somesthesis (groups the bodily functions
correlated to the so-called "human" activities), and
this tangentiously may be fostered through the
interrelationship between individuals instantiated in
Pearson correlation coefficient’s:
r = 0.5686
0
3
6 9
12
A Social Network Approach for Student’s School Performance Measurement
317

the opposing capacities through an intervention in the
process of diagnosed enturmation.
This research’s goal is to understand the results of
student’s social network analyses to help teachers
better understand groups and develop better
cooperative works., using a method to measure the
weight of social networks built among students and
diagnosing the processes of enturmatization in
evidence: hedonistic and utilitarian.
However, this action may favor new inter-
relational processes, and it is for this reason that we
propose the development of this method which allows
the measurement and diagnosis of the types of
enturmations which occur within the classroom. From
this method we may identify hedonistic and utilitarian
enturmentations and, consequently, an
operationalization of the tangent through collective
knowledge applications.
We applied this method associated with
storytelling technique and we realized that the
techniques of regrouping encouraged the teachers as
we could see in the comments made by them: “I
thought it was very special. These activities cause a
good movement in the College, they win and so do
we ... "and they also commented" It was a rewarding
experience, this type of activity is always something
enriching for both sides, but especially for
students..." (Siqueira et al., 2020).
As future work we indicate the reproduction of the
method in other schools mainly in public schools, the
increase of the method with the insertion of more
metrics and a next research with the comparative of
the evolution of the class after the implementation of
the method.
REFERENCES
Bastos, Cecilio Ricardo de C; Queiroz, Márcio Pedro C. P.
de. 2015. Use of educational social network in research
project at the university. Brazilian Symposium on
Informatics in Education (SBIE): 1270-1273.
Bezerra, Y.M.S., Correia-Neto, J.S., Santos, R.E.S., Vilar,
G., Magalhães, C.V.C., Queiros, L.M. 2014.Virtual
learning environments and virtual social networks:
preliminary results of a systematic mapping in the
context of information technology in education. In
Nuevas Ideas en Informática Educativa, TISE.
Degenne, Alain, and Michel Forse. 1999. Introducing
Social Networks.
Delbem, Edgar, sjr. (2014) Modelo computacional
colaborativo para mensurar o desenvolvimento inter-
relacional em alunos do Ensino Médio. Dissertação
(Mestrad oem Informática) – Universidade Federal do
Rio de Janeiro, Instituto de Matemática, Instituto Tércio
Pacitti Gessinger, R.M. (2008) “Atividade em grupo,
In: A gestão da aula universitáriana PUCRS”, editado
por Grillo, M.C., Freitas, A.L.S., Gessinger, R.M.,
Lima, V.M.R., EdiPUCRS, Porto Alegre.
Delbem, Edgar. 2014. Collaborative computational model
to measure interrelated development in high school
students. Dissertation (MSc in Informatics) -
Universidade Federal do Rio de Janeiro, Instituto de
Matemática, Instituto Tércio Pacitti.
Deroy-Pineau, Françoise. 1994 Reseauxsociaux:
bibliographie commenté. Montréal: Université de
Montréal.
Domingues, Diana Maria Gallicchio. (2004). Ciberespaço e
rituais: tecnologia, antropologia e criatividade.
Horizontes Antropológicos, 10(21), 181-197. DOI:
10.1590/S0104-71832004000100008.
Fuks, Hugo; Pimentel, Mariano. Sistemas Colaborativos.
Rio de Janeiro, Elsevier, 2011.
Liu, Z.; Kang, L..; Domanska, M.; Liu, S.; Sun, J. and Fang,
C. (2018). Social Network Characteristics of Learners
in a Course Forum and Their Relationship to Learning
Outcomes. In Proceedings of the 10th International
Conference on Computer Supported Education:
CSEDU, ISBN 978-989-758-291-2, pages 15-21.
DOI:10.5220/0006647600150021.
Marinho, É. C.; Ferreira da Silva, M.; de Souza Dias, D.;
Schmitz, E. and Alencar, A. (2015). Motivational
Factors and the Intention of Use of a Virtual Learning
Environment - A Preliminary Study about an e-
Learning Application Developed by the Brazilian
Ministry of Education in Proceedings of the 7th
International Conference on Computer Supported
Education - Volume 2: CSEDU, ISBN 978-989-758-
108-3, pages 477-482. DOI: 10.5220/0005429104
770482.
Marteleto, Regina Maria. 2001. Analysis of social networks
- application in studies of information transfer. In Ci.
Inf., Brasília, v. 30, n. 1, p. 71-81, jan./abr.
Sancho, J. M.; HERNANDEZ, F. et al. (Org). (2006).
Tecnologias para transformar a educação. Revista
Educar. Nº 28, p. 279-282. UFPR, Porto Alegre:
Artmed.
Souza Vieira, M. E.; López-Ardao, J. C.; Fernández-Veiga,
M.; Ferreira-Pires and Rodrígues-Péres (2018).
Prediction of Learning Success Via Rate of Events in
Social Networks for Education. In Proceedings of the
10th International Conference on Computer Supported
Education: CSEDU, ISBN 978-989-758-291-2, pages
374-382. DOI:10.5220/0006780703740382.
W. S. Moura, J. de O. Sampaio, J. B. S. França, A. Dias,
and M. R. S. Borges, “Colabsaber: a Pedagogical
Support Framework in the Collaborative Construction
of Knowledge / Colabsaber: Uma Estrutura Pedagógica
De Apoio Na Construção Colaborativa Do
Conhecimento,” Brazilian Journal of Development,
vol. 6, no. 12, pp. 103018–103031, 2020, doi:
10.34117/bjdv6n12-705.
Xavier, Jr., Joaquim Ferreira. A psicogenética –
demarcando os processos da vida. Tremembé: VespeR
Editora, 2004, p. 40-43.
CSEDU 2021 - 13th International Conference on Computer Supported Education
318
