
End-user Evaluation of a Mobile Application Prototype for
Territorial Innovation
Eliza Oliveira
a
, André C. Branco
b
, Daniel Carvalho
c
, Eveline Sacramento
d
,
Oksana Tymoshchuk
e
, Luis Pedro
f
, Maria J. Antunes
g
, Ana M. Almeida
h
and
Fernando Ramos
1i
DigitalMedia and Interaction Research Centre, University of Aveiro, Aveiro, Portugal
Keywords: User Experience, Mobile Application Prototype, Usability, Design and Evaluation, Communities-led
Initiatives, Territorial based Innovation.
Abstract: This study is part of a larger research effort taking place under the umbrella of CeNTER Program, an
interdisciplinary project that aims to promote the development of the Centro Region of Portugal. The general
contribution of this paper is the evaluation of a mobile application prototype that promotes collaboration
between the various agents involved in Tourism, Health and Wellbeing. For the evaluation of the prototype,
different methods were employed, which included the collection of quantitative and qualitative data.
Quantitative data were obtained through the combination of two User Experience evaluation tools (SUS and
AttrakDiff) and from usability metrics of effectiveness and efficiency, which are key factors related to the
usability of a product. Qualitative data were obtained using the Think-aloud protocol, which allowed
immediate feedback from end-users on their experience of interacting with the prototype. Although there are
still several improvements to be addressed, the overall end-users’ opinions show that the CeNTER application
is a sustainable and timely contribution, with an interesting potential to help foster community-led initiatives.
The article offers a better understanding for the evaluation of mobile applications, which foster the same
subject approached in this study.
1 INTRODUCTION
Digital media promotes the communication between
local regional agents and boosts the dissemination of
information regarding local products and activities
for an unlimited number of people online (Encalada
et al. 2017). Thus, it can facilitate collaborative
processes among local citizens, valuing endogenous
resources and promoting assets associated with a
specific territory (Bonomi, 2017). It also allows to
recreate a “virtual proximity” among the different
agents involved in the territory’s development
process (Saint-Onge et al., 2012). In this context, a
a
https://orcid.org/0000-0002-3518-3447
b
https://orcid.org/0000-0002-6493-6938
c
https://orcid.org/0000-0003-0108-8887
d
https://orcid.org/0000-0003-0839-4537
e
https://orcid.org/0000-0001-8054-8014
f
https://orcid.org/0000-0003-1763-8433
g
https://orcid.org/0000-0002-7819-4103
h
https://orcid.org/0000-0002-7349-457X
i
https://orcid.org/0000-0003-3405-6953
digital platform (mobile application) is being
designed, whose primary focus is to promote
collaboration between the various agents
(community-led initiatives, public and private
entities, networks and citizens), involved in
territorial-based innovation processes in the Centro
Region of Portugal (Tymoshchuk et al., 2021).
The main goal of this paper is to present the
assessment of a prototype of a mobile application,
designed under the scope of the CeNTER Research
Program, by end-users. Bearing in mind that
continuous feedback from users in the early stages of
development is crucial to detect possible problems
that a system may present, an initial testing phase was
Oliveira, E., Branco, A., Carvalho, D., Sacramento, E., Tymoshchuk, O., Pedro, L., Antunes, M., Almeida, A. and Ramos, F.
End-user Evaluation of a Mobile Application Prototype for Territorial Innovation.
DOI: 10.5220/0010479104950504
In Proceedings of the 23rd International Conference on Enterprise Information Systems (ICEIS 2021) - Volume 2, pages 495-504
ISBN: 978-989-758-509-8
Copyright
c
2021 by SCITEPRESS – Science and Technology Publications, Lda. All rights reserved
495

carried out, with the evaluation of the prototype by
experts in a laboratory context. Such tests included
the appreciation of the prototype at different stages of
evolution, and from various perspectives, enabling a
complete assessment.
In the first phase of evaluation, two groups of
specialists carried out the heuristic evaluation of the
prototype. The first panel consisted of five experts in
the Digital Technologies field who have knowledge
and experience in developing interfaces. The second
panel consisted of five experts in the fields of
Tourism, Health, and Well-being, who have
knowledge of the domain and are involved in
different community projects. This evaluation
allowed us to identify and correct 50 usability
problems, providing more engaging versions of the
application (Branco et al., 2021 in press).
This article presents the second phase of
assessment of the mobile application prototype,
carried out with potential end-users.
This study is framed by a “User-Centered Design”
(UCD) approach, which defines the process
necessary to develop products easier to use and better
fulfil the objectives related to the usability (Fonseca
et al., 2012). It is also supported on a User Experience
(UX) theoretical basis, which provided significant
knowledge to elaborate on the mobile application
prototype evaluation in the CeNTER Program scope.
The paper is organized as follows. Section 2
briefly reviews some important concepts used in this
research. Section 3 addresses the adopted
methodology and Section 4 presents the mobile
application prototype. Section 5 presents the
quantitative and qualitative results collected from the
end-users’ evaluation tests. Finally, Section 6
contains the main conclusions and presents future
research.
2 THEORETICAL
BACKGROUND
The purpose of UCD is to define the process
necessary to develop products that are easy to use and
better fulfill the objectives related to usability
(Fonseca et al., 2012). It implies, therefore, the active
engagement of users throughout the product or
service development process, in order to prevent
digital systems from failing due to lack of
communication between developers and users (Still
and Crane, 2017). For these authors, design
professionals need to follow a set of guiding
principles in the process of developing a product, so
they can adapt it to conform the needs of each user.
Still according to these authors, compliance with
these principles makes it possible to develop a
product or service that is entirely user-centered. In
order to understand users' desires and needs, it is
necessary to gather as much observable data as
possible in the entire design process and make a
comparative analysis of these data to determine what
similarities are found. To do that, different evaluation
methods are used, which include the collection of
qualitative and quantitative data.
User Experience refers to how the end-user feels
about the products created. Experience is a construct
formed in the mind itself, in addition to an infinity of
other factors and is a completely subjective issue
(Knight, 2019). Bernhaupt and Pirker (2013) state
that the concept of UX is related to positive emotions
and emotional results, such as joy, fun and pride. For
Knight (2019), creating an experience is not just
about how the product is designed, which structures
were implemented or whether state-of-the-art
technology is used. It is about how the product helps
users to accomplish their tasks, achieve their goals
and how they feel when they use and get involved
with the product. In the case of digital solutions, for
example, intentions are turned into products, which
will be used by real people.
A mobile application's usability allows it to work
as expected, enabling users to achieve their goals
effectively, efficiently, and pleasantly (Rogers et al.,
2011), being presented as a great educational
mechanism (Welfer, Silva and Kazienko, 2014). As
Jones and Pu (2007) mention usability is not a purely
one-dimensional property of an interface. It consists
of a subset of user experiences associated with the
effectiveness, efficiency, and satisfaction with which
users can perform a specific set of tasks in a given
environment. In fact, usability is one of the key
factors that affects a software quality (Dourado and
Canedo, 2018).
In this context, efficiency is seen as "the
quickness with which the user’s goal can be
accomplished accurately and completely and is
usually a measure of time" (Rubin and Chisnell, 2008,
p.4). Effectiveness refers to "the extent to which the
product behaves in the way that users expect it to and
the ease with which users can use it to do what they
intend" (Rubin and Chisnell, 2008, p.4).
Effectiveness is usually measured quantitatively with
an error rate. According to these authors, satisfaction
refers to "the user’s perceptions, feelings, and
opinions of the product, usually captured through
both written and oral questioning" (Rubin and
Chisnell, 2008, p.4).
ICEIS 2021 - 23rd International Conference on Enterprise Information Systems
496

Therefore, interfaces with good usability are
characterized by their ability to offer a practical, easy,
appreciable, and satisfying user experience (Rogers,
Sharp and Preece, 2011). In this sense, to certify that
a product has a satisfactory level of usability, it is
essential to carry out tests, that provide direct
information about the problems that users encounter,
allowing researchers to obtain precise
recommendations on what should be modified in an
interface (Carroll et al., 2002; Nielsen, 1994; Nielsen,
1997; Muchagata and Ferreira, 2019).
3 METHODOLOGY
With the intent to cover the largest number of usage
scenarios by each group of regional actors, such as
citizens, community-led initiatives, public and
private entities and networks, four different
hypothetical Use Cases were prototyped. These cases
correspond to common scenarios elaborated with 10
ordered tasks to be performed by three distinct
participants that composed each group.
The collected data was based on qualitative and
quantitative information. Quantitative data were
obtained through the combination of two UX
evaluation tools, and from metrics of effectiveness
and efficiency, which are key factors related to the
usability of a product. The evaluation instruments
were the System Usability Scale (SUS) (Martins et
al., 2015), and the AttrakDiff (Hassenzahl et al.,
2003). SUS is a widely used instrument for
identifying usability’s issues of a system, while
AttrakDiff also comprises emotion and hedonic
aspects of a product, embracing other important UX
factors in the evaluation.
For each task performed by the users it was
identified whether they finished the task successfully
or with assistance. The completed tasks are those in
which users have accomplished their objective
without any help. Tasks that required help were
pointed out as “Needed some help” and were not
considered for the computation. Based on this result,
a percentage of effectiveness is calculated for each
use case. This indicator was based on the Nielsen
(2001) success rate usability metric. The
effectiveness metric is a percentage of completed
tasks divided by the total number of tasks (ratio).
The efficiency metric considered the time that
each evaluator took to complete the tasks. According
to Nielsen (2001) and Sauro and Lewis (2016), the
evaluator with the best average time is considered as
the reference for the use case that he belongs to. The
time was measured in seconds, and it was counted
from the user's first touch on the screen. Then, the
percentage obtained from the best evaluator was
calculated and compared to the average of the two
other evaluators for each task. Tasks that have the
highest difference ratio between the time, in seconds,
from the best participant to the average, will be those
that have usability problems, since they present a
significant variation in their execution times and,
therefore, need to be reviewed.
Qualitative data were obtained through a dialogue
with the evaluators, which was captured on video
throughout the test.
The test session began with presentation of the
CeNTER Program, the reading and collection of a
free and informed consent document and an
explanation of the test. The evaluation started after
that with a free exploration of the prototype by the
evaluator, followed by the dictation of each task by
one of the team members. A Guided Exploration Task
Guide, or Cognitive Walkthrough (Wharton et al.,
1994), was used, being this an inspection method
based on performing a sequence of actions to
complete a task. In addition, the Think aloud Protocol
(Jaspers, 2009) was also employed, which encourages
users to think out loud while exploring and /or
performing a set of tasks.
Afterwards, the instruments (SUS and AttrakDiff)
were presented to users, fulfilling the three phases of
the test: Introduction, task execution and application
of the instruments. All tests were recorded for later
analysis by the team, in order to obtain more
qualitative data through the comments of the
evaluators.
Considering the dynamic evaluation process
presented, the tests encompassed the following goals:
▪ Measure indicative aspects of the prototype's
usability, such as efficiency, effectiveness and
satisfaction;
▪ Collect other important UX factors, such as
hedonic qualities and an overall perception
regarding the interface’s look and feel;
▪ Verify the acceptance of the CeNTER
prototype concept;
▪ Gather suggestions for improvement.
The evaluation sessions occurred in October and
November of 2020, in locations and times that varied
according to the preference of each evaluator. Some
tests were carried out at the University of Aveiro,
while others took place at the institution or even at the
residence of the participants.
The evaluations were carried out individually,
with evaluators who met the inclusion criteria within
the different agents in the territory. A total of 12 tests
End-user Evaluation of a Mobile Application Prototype for Territorial Innovation
497

were accomplished. The researchers defined four Use
Cases (UC): UC1 - Community-led initiatives -
involved evaluators representing community-based
initiatives in the Centro Region of Portugal; UC 2 -
Public Entities - tests were carried out with City
Councils, Health Centers, and Parish Councils
representatives in the Centro Region of Portugal; UC
3 - Citizens - people gathered as an individual
participation; and UC 4 - Networks - tests were
performed with representatives of the Networks. This
study's participants represented different profiles in
terms of education, age, gender, and role performed
in society, presenting distinct learning curves
concerning the use of digital technologies.
Finally, after two months of testing, the UX
assessment instruments results were verified for data
analysis. In parallel, qualitative data obtained from
the careful observation of the videos were gathered,
collecting comments and suggestions from the
evaluators during the test.
3.1 Use Cases
This section presents the use cases in detail. Each use
case was composed of a sequence of 10 pre-
established tasks proposed to the participants.
The Use Case 1 (Community-led Initiatives)
encompassed the following tasks: (i) See examples of
higher-ranking events; (ii) Add new event; (iii) Select
a specific date in the register; (vi) Request a specific
volunteer in the event register; (v) End registration
(detailed event screen appears); (vi) Share event on
Facebook; (vii) See on the map the location of the
event; (viii) Check on the map if there are events
nearby; (ix) See settings / configurations; (x) Change
user preferences.
The Use Case 2 (Public Entities) implied the
following tasks: (i) Search initiatives that are
happening in a certain place; (ii) Read and participate
in an initiative; (iii) Identify the organization that
organizes this initiative; (iv) In this initiative, browse
the existing events (Identify the place, date and time
of the event); (v) Browse partners for this event; (vi)
Request to be an event partner; (vii) Go back to the
home screen; (viii) Create a new resource offering;
(ix) In the definitions, see initiatives created by you;
(x) Open an initiative created by you and change its
location.
Use Case 3 (Individual participation) presented
the following tasks to be accomplished: (i) Search
events occurring in a certain place; (ii) Search the
classification of an event; (iii) Participate in an event;
(iv) Create profile (choose the option register
yourself); (v) Save an event; (vi) On the home page,
consult and delete an event that has already taken
place; (vii) Browse the notifications; (viii) Contact
the organizers of a given event to clarify a doubt by
email; (ix) Ask to be a volunteer and (x) Consult the
ideas section and insert an idea.
Finally, the fourth and final Use Case (Networks)
requested the realization of the following tasks: (i)
Add an Initiative; (ii) Request a resource; (iii)
Request partners; (iv) Consult events on the agenda;
(v) Change user preferences; (vi) See on the map the
volunteers available in a geographic area; (vii)
Consult information about a volunteer; (viii) Contact
a volunteer; (ix) Comment on an idea; (x) Consult the
participations of the user.
The Use Cases were elaborated by the CeNTER
team, taking into consideration the results from a
previous research (Silva et al, 2020) that allowed the
identification of the potential regional agents highly
involved in territorial innovation. Therefore, the
outcomes achieved in this study may help to identify
whether the CeNTER accomplishes the relevant
functionalities for territorial development.
4 PROTOTYPE
A mobile application is currently under development
and its main objective is to encourage interactions
among local agents, to facilitate communication and
collaboration processes, to benefit from existing
mediation strategies and encourage the joint creation
of new ideas and activities. This effort is being
developed using the Principle software, which allows
the development of a medium-fidelity prototype
(Oliveira et al., 2020).
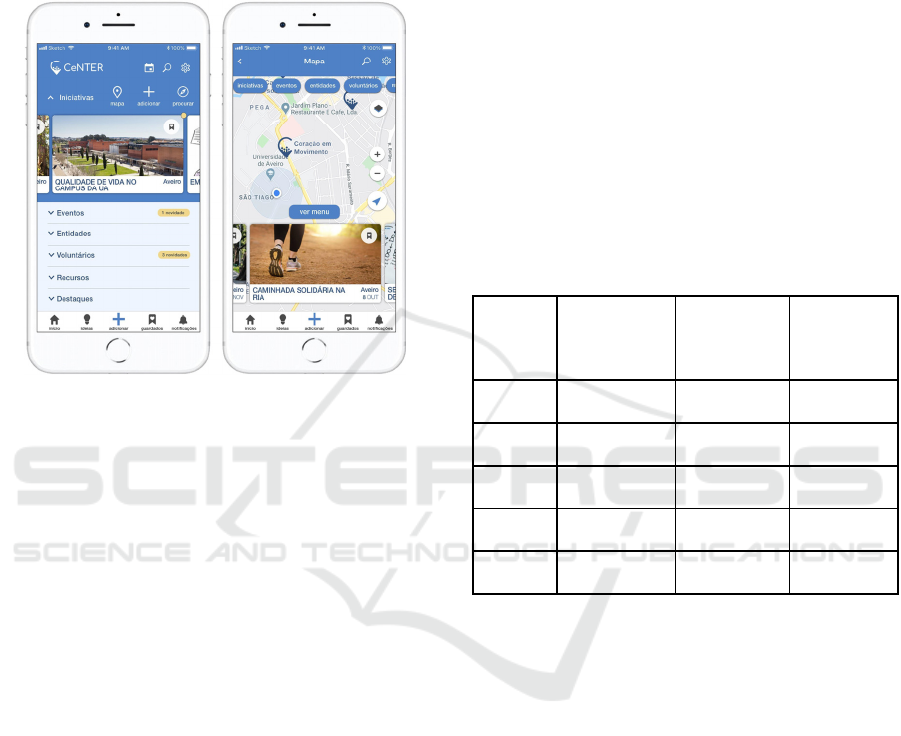
As shown in Figure 1, the main screen of the
application presents a grid with six primary tabs:
initiatives, events, entities, volunteers, resources, and
highlights, which act as starting points in the
application. When opening a tab, the user finds the
information displayed in a carousel mode, with cards
representing the different units of content. These
cards have essential information (e.g., image, date
and time, location) and can be manipulated with
gestures, such as swiping (e.g., discard or save as
favorites). Further, when a card is presented, different
actions are possible, such as viewing the element on
the map, adding a new element and making specific
searches within each tab.
The prototype header presents agenda features,
search tools across the platform, and access to
application settings. The menu in the footer includes
other functionality options, such as accessing the user
profile and ideas, visiting saved items, viewing
ICEIS 2021 - 23rd International Conference on Enterprise Information Systems
498
notifications and general exploration on the map. The
navigation in the application is done with a minimum
number of gestures.
Besides that, the CeNTER mobile application has
a small tutorial that aims to help anyone to easily
understand how to interact with the platform.
Figure 1: Screen samples from CeNTER Prototype: Main
screen and map screen.
5 DISCUSSION OF RESULTS
This section presents the main results obtained
through the tests carried out with potential end-users,
which provided relevant quantitative and qualitative
results regarding instrumental and non-instrumental
characteristics of the medium fidelity prototype.
5.1 Results from Effectiveness and
Efficiency
This section presents the results of effectiveness and
efficiency tests with potential end-users of the
CeNTER prototype. The usability metric of
effectiveness (whether the user performed the task,
with or without help, or did not perform it) and
efficiency (time of execution of each task), provided
cues on: how intuitive the design is; how frequent
errors were committed, while performing a specific
task or action; and the required learning curve to use
the platform. The effectiveness usability metric
measured each user´s success rate in performing 10
tasks, totalizing 30 tasks performed in each use case.
The results can be seen in Table 1.
On average, an efficiency rate of 87% was
obtained. However, it is important to highlight the
lowest and highest effectiveness index obtained in the
use cases, being 80% for use case 2 and 97% for the
use case 4. According to the metrics pointed out by
Nielsen (2001), an index above 80% is considered
good, and it is not necessary to reach a higher value
in time for a project prototype (Nielsen, 2001; Sauro
and Lewis, 2016). These values correlate to the
average obtained in verbal help, so the use case with
the highest effectiveness index had a lower average in
verbal help and vice versa, i.e., when the evaluator
needed assistance to perform a task, this contributed
to the decrease in the effectiveness index. Henceforth,
the total average of the four use cases was made
(Table 1), making it possible to understand that
approximately every evaluator needed verbal help in
at least one in ten tasks.
Table 1: Global results regarding Effectiveness and
Efficiency.
Use
Case
Effectiveness
Verbal Help
(average per
en
d
-user
)
Efficiency
(average
p
er task
)
UC1 87% 6,66% 16 sec.
UC2 80% 20% 15 sec.
UC3 83% 16,66% 18 sec.
UC4 97% 10% 17 sec.
Avera
g
e 87% 13,33% 16,5 sec.
The average was made according to the number of
times an end-user needed verbal help during the
execution of the 10 tasks. Afterwards, in the same use
case, the average obtained from all end-users was
determined. Finally, the average obtained from the
total use cases was calculated.
It is possible to conclude that the results obtained
in the efficiency analysis were satisfactory. It is
noteworthy that the efficiency metrics were obtained
according to the time difference that the distinct
evaluators took to perform the same task. It is also
observed that the average time of execution of each
task was around 16.5 seconds (Table 1), with low
variation between the average of each use case, which
demonstrates a high efficiency in terms of usability
from the prototype.
In addition, three evaluators revealed some
difficulties in carrying out tasks that required content
creation (creating a profile or event with a date and
time) and browsing tasks (such as finding the existing
initiatives or reading the ideas’ screen and
End-user Evaluation of a Mobile Application Prototype for Territorial Innovation
499
subsequently creating a new idea). These outcomes
were directly influenced by the learning curve of
users, as well as their experience in using similar
mobile applications. Thus, the usability evaluation of
the CeNTER application prototype provided good
results in terms of learnability, effectiveness and
efficiency.
5.2 Results from the SUS and
AttrakDiff Instruments
The main results concerning the application of SUS
and AttrakDiff in all Use Cases are shown in Table 2.
The SUS results show that, in terms of usability
characteristics, the prototype is at an excellent level
according to the opinion of the evaluators of the first
use case (85 points). According to Sauro (2011), the
average of the System Usability Score is 68 points. In
this sense, if the score is less than this value, the
product probably faces usability problems, since it is
under the average (Barbosa, 2019; Sauro, 2011).
Therefore, a score between 80 and 90 in SUS
corresponds to an excellent usability (Barbosa, 2019),
reflected in the case of the CeNTER mobile
application prototype, with the global result of 85,83
scores.
Table 2: Global results from SUS and AttrakDiff.
Use
Cases
Instrumental
Qualities
Non-instrumental Qualities
SUS
(0 to
100)
AttrakDiff (-3 to 3)
AttrakDiff
(
-3 to 3
)
PQ HQ-S HQ-I ATT
UC1 85 1,57 2,10 1,76 2,19
UC2 87,5 1,00 1,52 1,52 1,71
UC3 95 1,76 2,24 1,90 2,67
UC4 75,83 2,05 1,67 1,67 2,43
Average 85,83 1,60 1,88 1,71 2,23
The results obtained through the SUS
administration in all use cases show an overall
agreement among the participants, reinforcing the
value of excellence, which is between 80 and 90
points, relative to the usability criteria measured by
this evaluation instrument within the CeNTER
platform.
Although the value related to SUS reinforces a
high usability index, the value of Pragmatic
Dimension (PQ), which encompasses aspects
regarding usability and product functionality,
obtained lower results (1,60), with oscillations
between the Use Cases. The higher value was
achieved in Use Case 4, while the lower scores were
given by the participants of the Use Case 2. However,
the global average value remained positive (between
-3 and 3), so it is possible to consider that the
prototype has a favourable index in the criteria of
effectiveness, efficiency, satisfaction and ease of
learning.
In regard to the results obtained from the
AttrakDiff scale, the average values of the four
dimensions were calculated, all of which had high
scores, being possible to achieve scores between -3 to
3. The apical general value is related to the
prototypes’ aesthetics “ATT” - Attractiveness (2,23),
followed by the Hedonic Quality – Stimulation (HQ-
S - 1,88), which is strictly related to the desire to
understand and develop skills for using the product.
Afterwards, the biggest score is from the Hedonic
Identification (HQ-I - 1,71), which are attributes
alluding to the level of user identification with the
system. Finally, as previously said, the lowest score
corresponds to the Pragmatic Quality (PQ - 1,60),
which is correlated to usability issues.
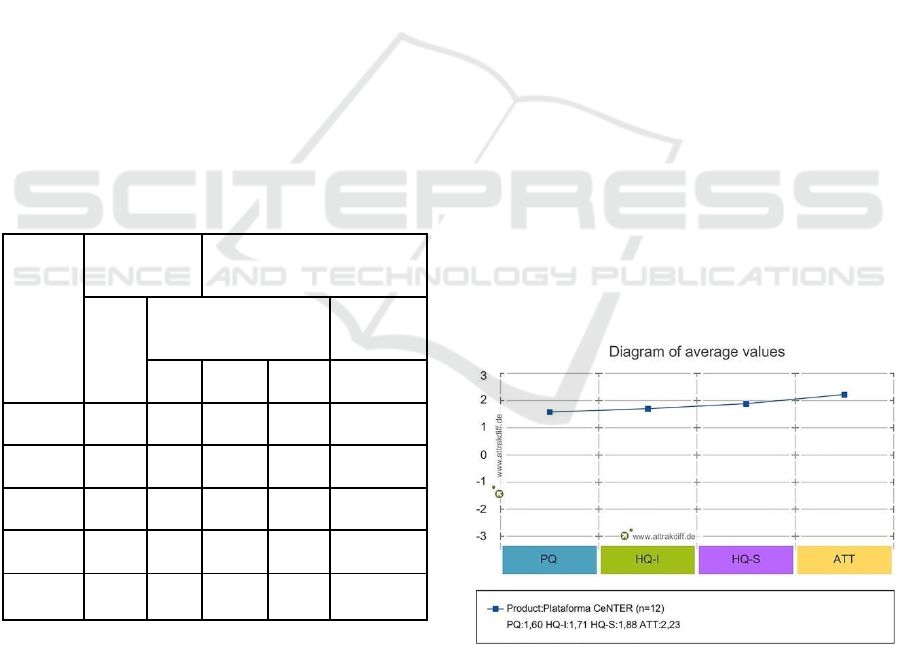
Figure 2 shows the average values obtained in the
other dimensions, highlighting the aspect related to
the prototype aesthetics (ATT), which presented, in
agreement with the previous results, a value
significantly higher than in the other dimensions.
Figure 2: Diagram of the global average of values of the
four dimensions of AttrakDiff.
Also, in a coherent way with the rest of the results,
QH-S obtained a higher value than QH-I, showing
that the aspects referring to the desire to understand
and develop skills for using the product are more
ICEIS 2021 - 23rd International Conference on Enterprise Information Systems
500
evident than those related to the level of user
identification with the system.
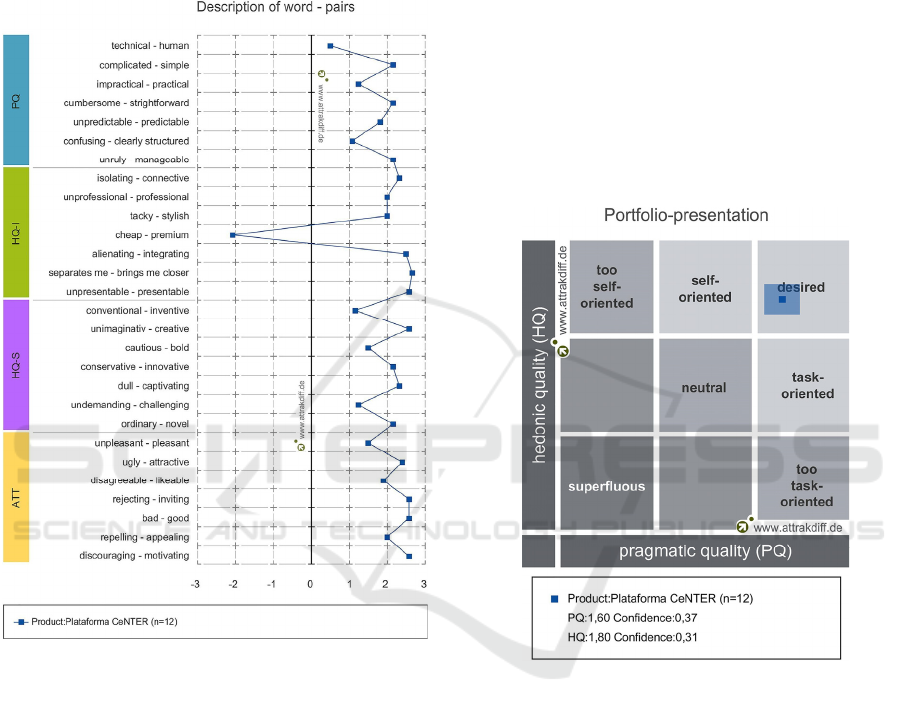
Figure 3 shows that the pair of words which
received the negative result in AttrakDiff was the
topic “cheap - premium”, in QH-I dimension, with no
other negative average values among all items in the
other dimensions.
Figure 3: Diagram of the description of word pairs. Global
average of measured items.
However, it is important to emphasise that, under
the CeNTER project, none of the opposites in “cheap
- premium" has an essentially negative connotation.
Thus, a quality of “cheap” might mean that the
Platform is accessible to all social fringes, which
consolidates the intention to democratize digital
technologies in all strata of the population. Likewise,
“cheap” can refer to a low complexity of the platform,
indicating the desired ease of use within the scope of
CeNTER. This point of view is consistent with the
fact that the punctuation for the “simple -
complicated” opposites are significantly more
inclined towards the simple than for its reverse, and
with the fact that the usability score measured by
SUS, which refers to the ease of use, have shown to
be substantially high.
Concerning Figure 4, the general results achieved
from AttrakDiff positioned the confidence rectangle
in the “desirable” quadrant, assuming the perceptions
of PQ (1.60) and QH (1.80). According to the
Attrakdiff methodology, the smaller the difference
between the two rectangles, the greater is the
confidence level of the results, indicating that
participants maintained good affinity among their
responses. Moreover, in the CeNTER scope, the
confidence rectangle extends within the “desired” or
“desired” area. Therefore, it can be clearly classified
as a desirable product. This value, as well as all the
other graphs presented above, were generated
according to the AttrakDiff methodology.
Figure 4: Confidence rectangles of the evaluation with end-
users.
An accurate analysis of the quantitative results in
each use case, separately, shows that the participants
in UC2 had more difficulty in performing the tasks,
considering that this was the group that most needed
verbal help. In the meantime, the results obtained
from AttrakDiff showed lowest values scored by
participants. In this sense, the global results indicate
that the UC2 tasks (public entities) were challenging
for the local agents, reflecting the results of the
evaluation of AttrakDiff. Additionally, it is
noteworthy that the UC4 presented higher scores in
effectiveness, while the UC2 had better values in
terms of efficiency. Regarding SUS and AttrakDiff,
the higher average ponctuation was given by the end-
End-user Evaluation of a Mobile Application Prototype for Territorial Innovation
501
users of the UC3, showing a higher level of
satisfaction concerning the CeNTER prototype.
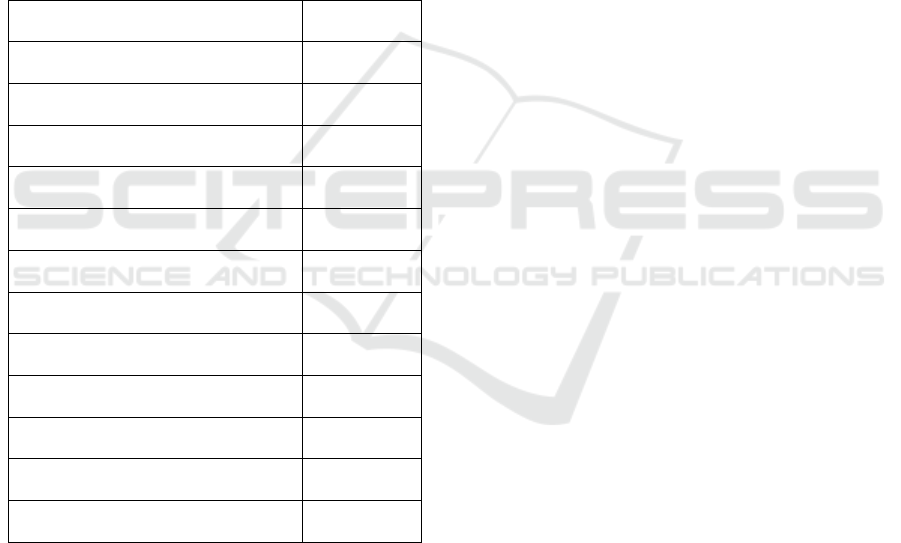
5.3 Qualitative Results
The Think-aloud protocol was used to obtain
immediate feedback from end-users about their
experience of interacting with the prototype. The
application of this method allowed the qualitative
evaluation of the prototype based on the users' verbal
comments. The inputs were divided according to each
corresponding screen to relate user comments to the
main screens tested. Table 3 shows that, among the
screens that obtained the largest number of inputs, the
main screen stood out (13/46), as well as the details
screen (9/46).
Table 3: Inputs according to the prototype interface.
Interfaces Nº of inputs
Tutorial 1
Main screen 13
Profile 5
Register of an initiative or event 1
Ideas 4
Maps 4
A
g
enda 2
Save
d
2
Notifications 0
Details of an event / initiative / entit
y
9
Others 5
Total 46
Forty-six (46) inputs were reported during the free
exploration by the end-users, 36 of which were
considered by the team as suggestions for platform
improvements, 7 as prototype usability errors, and
three were interpreted as suggestions for
improvement and usability errors.
Usability errors correspond to inconsistencies in
the interface's use, such as the lack of feedback on
acting, the need to do more than three steps on one of
the screens to return to the home screen, and the
difficulty moving the cards on the carousel. It should
be noted that some of these problems were related to
the limitations of the software used in the prototyping
process, for example some difficulties that the
evaluators felt in the movement of the cards.
Improvement suggestions were related to the
possibility of changing the main screen according to
user preferences; apply search filters to the schedule;
replace the title "Ideas" with a more dynamic one,
such as: "Get your idea moving". The largest number
of suggestions for improvement was related to the
suggestion of new features (10/39). As an example of
these suggestions, we can mention the suggestions of
“include supply/demand for an employee, in addition
to a volunteer”; “Generate certificate of participation
of volunteers”; “To be able to invite participants who
have participated in previous events”. It is important
to note that these suggestions are precious for
developing this mobile application and future digital
solutions aimed at community initiatives.
In addition to these inputs, 34 positive comments
were also collected on the mobile application under
development. These comments showed that users
have fully understood the purpose and objectives of
the platform. For example: “I liked the fact that I
could cross similar initiatives, access it, either by map
or by theme. I liked the possibility of creating a
synergy between the partners”. “Many people want to
help and do not often know-how. Moreover, there are
always entities that have initiatives and want to
share”; “The synergies created within the application
allow us to create new forms of interactions, which
current applications would not yet allow”.
6 CONCLUSIONS
Usability tests proved to be an effective way to
acquire information that contributes to significantly
improve the interface of a future mobile application,
thus favouring the user experience. The user-centered
design approach, used in all stages of the CeNTER
prototype development, contributed strongly to the
understanding of the users' needs.
The application of the Cognitive Walkthrough
method and the Think-aloud protocol, together with
the SUS and AttrakDiff, allowed the integration of
quantitative and qualitative assessment approaches in
this study. The different methods of analysis with
metrics of usability provided a multifaceted
understanding of what local agents expected and how
they intend to interact with the mobile application
during their community and/or professional activities.
Instrumental and non-instrumental characteristics of
the prototype allowed us to obtain information, in
addition to the usability data, providing results on
ICEIS 2021 - 23rd International Conference on Enterprise Information Systems
502

aesthetic and emotional aspects related to the
platform.
It is important to highlight that the number of
usability problems identified during the end-users’
tests, compared to tests with experts, has significantly
decreased. As previously mentioned, in usability tests
with experts 50 problems were identified and the vast
majority of those were soon corrected. After that,
only seven usability problems were identified in the
12 tests applied with end-users.
The analysis of the data collected indicates good
usability and high values of acceptance and
satisfaction from the different local agents with the
developed prototype. This tends to demonstrate the
relevance of the end-user-centered approach to the
development of tools dedicated to territorial based
innovation. The sample size was composed by three
evaluators per use case, demonstrating that the
prototype had a good efficiency index, since it
obtained a classification of 80% or more in all use
cases.
The difficulties in carrying out tasks that required
content creation and consultation by some evaluators
were influenced by the learning curve of users, as
well as their experience in using similar mobile
applications. Although the design of this study does
not allow us to generalize its results they reflect the
user experience of the regional agents previously
selected, providing evidence of what is important for
a mobile application in territorial-based innovation.
This study had limitations related to the sample
size that was relatively small, which restricted the
generalization of the results. However, it seemed to
be sufficient for the execution of usability tests.
Another restriction is related to the fact that the
Principle software does not allow some types of
interactions, such as the pinch gesture (pinching to
zoom in and zoom out on the map of a mobile
touchscreen application), insert personalized data by
the user (the prototype only simulates the information
that is entered by the user) or some limitations in
gestures such as drag and drop (it is not possible to
use the same graphic object to perform two different
drag functions).
However, these limitations were not an
impairment for a good user experience evaluation.
The main positive results from the evaluation tools
are a good indicator of the acceptance and a pleasant
experience concerning the use of prototype. User tests
positively highlighted several platform features, such
as sharing resources and volunteers, collaborative
development of events, sharing ideas and creating
new initiatives based on these ideas. Also, many users
reported that these are innovative features, which
increase the relevance of the CeNTER platform as an
original and useful option.
As a final conclusion, it was possible to learn
several important lessons throughout this
collaborative process, which can be useful for other
researchers who develop digital solutions in the same
subject area: i) include community initiatives in the
entire design process to better tailor the solution to
their needs; ii) be flexible to meet the preferences of
the community and of the stakeholders; iii)
incorporate mixed methods in design and assessment
tests, which provide valuable information to produce
an acceptable and well-designed solution.
As future work it is aimed to develop a fully
functional platform, allowing the experimentation
and evaluation in the context of community-led
initiatives. Nonetheless, it is intended to study the
adoption, use and impact of the application in
promoting processes of articulation and
approximation between local agents, as well as in the
construction and diffusion of knowledge and
innovations.
ACKNOWLEDGEMENTS
This article was developed under the support of the
Research Program “CeNTER - Community-led
Networks for Territorial Innovation” Integrated
Research Program (CENTRO-01-0145-FEDER-
000002), funded by Programa Operacional Regional
do Centro (CENTRO 2020), PT2020.”
REFERENCES
Barbosa, A., 2019. Medindo a usabilidade do seu produto
com System Usability Scale (SUS). CA Design.
https://medium.com/design-contaazul/medindo-a-
usabilidade-do-seu-produto-com-system-usability-
scale-sus-3956612d9229.
Bernhaupt, M., Pirker, R., 2013. Evaluating User
Experience for Interactive Television: Towards the
Development of a Domain-Specific User Experience
Questionnaire, Human-computer Interact. - Lect. Notes
Comput. Sci. 8118, 642–659.
Bonomi, S., Ricciardi, F., Rossignoli, C., 2017. Network
organisations for externality challenges: How social
entrepreneurship co-evolves with ICT-enabled
solutions. International Journal of Knowledge-Based
Development 8(4), 346-366.
Branco, A, C., Carvalho, D., Sacramento, E., Tymoshchuk,
O., Oliveira, E., Antunes, M.J., Pedro, L., Almeida,
A.M., Ramos, F., 2021, in press. Prototyping and
evaluating a mobile app to promote territorial
End-user Evaluation of a Mobile Application Prototype for Territorial Innovation
503

innovation. In Proceedings – Conference Communities
and Networks for Territorial Innovation.
Carroll, C., Marsden, P., Soden, P., Naylor, E., New, J.,
Dornan, T., 2002. Involving users in the design and
usability evaluation of a clinical decision support
system. Computer methods and programs in
biomedicine, 69(2), 123-135.
Dourado, M. A. D., Canedo, E. D., 2018. Usability
heuristics for mobile applications a systematic review.
In Proceedings of the 20th International Conference on
Enterprise Information Systems, (pp. 483-494).
Encalada, L., Boavida-Portugal, I., Ferreira, C., Rocha, J.,
2017. Identifying tourist places of interest based on
digital imprints: Towards a sustainable smart city.
Sustainability 9(12), 2303-2317. https://doi.org/10.
3390/su9122317
Fonseca, M. J., Campos, P., Gonçalves, D., 2012.
Introdução ao Design de Interfaces (2a Edição). FCA -
Editora de Informática.
Hassenzahl M., Burmester M., Koller F., 2003. AttrakDiff:
Ein Fragebogen zur Messung wahrgenommener
hedonischer und pragmatischer Qualität. In: Szwillus
G., Ziegler J. (eds) Mensch and Computer. Berichte des
German Chapter of the ACM, vol 57.
VIEWEG+TEUBNER VERLAG. https://doi.org/10.
1007/978-3-322-80058-9_19
Jaspers, M. W., 2009. A comparison of usability methods
for testing interactive health technologies:
methodological aspects and empirical evidence.
International journal of medical informatics, 78(5),
340-353.
Jones, N., Pu, P., 2007. User technology adoption issues in
recommender systems. In Proceedings of the 2007
Networking and Electronic Commerce Research
Conference (pp. 379-394).
Knight, W., 2019. UX for Developers. Northampton.
APRESS.
Martins, A. I., Rosa, A. F., Queirós, A., Silva, A., Rocha,
N., 2015. European portuguese validation of the system
usability scale (SUS). Procedia Computer Science, 67,
293-300.
Muchagata, J., Ferreira, A., 2019. Visual Schedule: A
Mobile Application for Autistic Children-Preliminary
Study. In Proceedings of ICEIS 2, (pp. 452-459).
Nielsen, J., 1994. Usability inspection methods. In
Conference companion on Human factors in computing
systems (pp. 413-414).
Nielsen, J., 1997. Usability testing. Handbook of human
factors and ergonomics, 2, 1543-1568.
Nielsen, J., 2001. Usability Metrics. Retrieved December
16, 2020, from https://www.nngroup.com/articles/
usability-metrics/
Nielsen, J., 2001. Success Rate: The Simplest Usability
Metric. Retrieved January 16, 2020, from
https://www.nngroup.com/articles/success-rate-the-
simplest-usability-metric/
Oliveira, E., Antunes, M. J., Tymoshchuk, O., Pedro, L.,
Almeida, M., Carvalho, D., Ramos, F., 2020.
Prototipagem de uma Plataforma Digital para a
Promoção da Inovação Territorial de Base Comunitária.
Journal of Digital Media and Interaction, 3(6), pp. 53-
71 https://doi.org/10.34624/jdmi.v3i6.15517
Rogers, Y., Sharp, H., Preece, J., 2011. Interaction design:
beyond human-computer interaction. John Wiley and
Sons.
Rubin, J., Chisnell, D., 2008. How to plan, design, and
conduct effective tests. Handbook of usability testing,
348.
Saint-Onge, H., Wallace, D., 2012. Leveraging
communities of practice for strategic advantage.
Routledge.
Silva, P. A., Antunes, M. J., Tymoshchuk, O., Pedro, L.,
Almeida, M., Ramos, F., 2020. Understanding the role
of communication and mediation strategies in
community-led territorial innovation: a systematic
review. Interaction Design and Architecture(s) Journal
(IxD&A), 44, 7 – 28.
Sauro, J., 2011. Measuring Usability with the System
Usability Scale (SUS). Measuring U.
https://measuringu.com/sus/.
Sauro, J., Lewis, J. R., 2016. Quantifying the User
Experience, 2 Edition. Practical Statistics for User
Research. Cambridge. ELSEVIER.
Still, B., Crane, K., 2017. Fundamentals of User-centered
Design. Nova York. CRC Press.
Tymoshchuk, O., Almeida, A. M., Pedro, L., Antunes, M.
J., Ramos, F., Oliveira, E., Carvalho, D., 2021. Digital
Technologies as Tools to Promote Tourism and
Territorial Development: Design of a Mobile
Application for Community-Led Initiatives. In Dinis,
M. G., Bonixe, L., Lamy, S., Breda, Z. (Ed.), Impact of
New Media in Tourism (pp. 268-291). IGI GLOBAL.
http://doi:10.4018/978-1-7998-7095-1.ch016
Welfer, D., da Silva, R. C. F., Kazienko, J. F., 2014.
MobiCAP: A mobile application prototype for
management of community-acquired pneumonia. In
2014 IEEE 16th International Conference on e-Health
Networking, Applications and Services (Healthcom)
(pp. 126-127). IEEE.
Wharton, C., Rieman, J., Lewis, C., Polson, P., 1994. The
Cognitive Walkthrough: A practitioner’s guide. In J.
Nielsen., R. L. Mack (Eds.), Usability inspections
methods (pp. 105-140). New York. WILEY.
ICEIS 2021 - 23rd International Conference on Enterprise Information Systems
504
