
A Systematic Mapping on the Use of Data Mining for the Face-to-Face
School Dropout Problem
Leandro Rondado de Sousa
1
, Veronica Oliveira de Carvalho
1 a
,
Bruno Elias Penteado
2
and Frank Jos
´
e Affonso
1
1
Universidade Estadual Paulista (Unesp), Instituto de Geoci
ˆ
encias e Ci
ˆ
encias Exatas, Rio Claro, Brazil
2
Universidade de S
˜
ao Paulo (USP), Instituto de Ci
ˆ
encias Matem
´
aticas e de Computac¸
˜
ao, S
˜
ao Carlos, Brazil
Keywords:
School Dropout, Face-to-Face, Data Mining, Systematic Mapping.
Abstract:
Dropout is a critical problem that affects institutions worldwide. Data mining is an analytical solution that has
been used to deal with it. Typically, data mining follows a structured process containing the following general
steps: data collection, pre-processing, pattern extraction, post-processing (validation). Until know, it is not
known how data mining has been used to address the dropout problem in face-to-face education considering
all steps of the process. For that, a Systematic Literature Mapping was conducted to identify and analyze
the primary studies available in the literature to address some research questions. The aim was to provide
an overview of the aspects related to data mining steps in the presented context, without going into details
about specific techniques, but about the solutions themselves (for example, imbalanced techniques, instead of
SMOTE). 118 papers were selected considering a period of 10 years (01/01/2010 to 31/12/2020).
1 INTRODUCTION
Dropout is a critical problem that affects institutions
worldwide. Many works have been done to under-
stand the factors that lead students to quit their stud-
ies. There is no consensus on the definition of dropout
(Manh
˜
aes et al., 2014; M
´
arquez-Vera et al., 2016), but
in this paper it is considered as the students who in-
terrupt the course for any reason (course transfer, reg-
istration locking, etc.) and do not finish their studies
with their cohorts.
According to (Delen, 2011) there are two ap-
proaches that can be used to deal with the dropout
problem: survey-based and data-driven (analytic). In
the survey-based, theoretical models, such as the one
developed by Tinto (Tinto, 1993), are developed. In
the data-driven, institutional data are analyzed by an-
alytical methods. Data mining is one of those ana-
lytical solutions, as seen in (Gustian and Hundayani,
2017; Pertiwi et al., 2017; Pereira and Zambrano,
2017). As stated by (Plotnikova et al., 2020), data
mining projects generally follow a structured pro-
cess or methodology, such as KDD, CRISP-DM or
SEMMA. We are considering here the following main
steps that normally appear in these processes: data
a
https://orcid.org/0000-0003-1741-1618
collection, pre-processing, pattern extraction, post-
processing (validation). From now on, data mining
will be understood as a process containing these main
steps.
Although there are many studies that use data
mining to analyze the dropout problem, it is not
known how data mining has been used to address
the dropout problem in face-to-face education con-
sidering all steps of the process. Therefore, a Sys-
tematic Literature Mapping (SLM) (Kitchenham and
Charters, 2007) was done to identify and analyze the
primary studies available in the literature to address
some research questions. The aim was to provide
an overview of the aspects related to data mining
steps in the presented context, without going into de-
tails about specific techniques, but about the solutions
themselves (for example, imbalanced techniques, in-
stead of SMOTE).
It is important to mention that some secondary
studies were found, although only one similar to our
research. In (Agrusti et al., 2019) the authors also
present a systematic review on dropout through data
mining. However, they covered only one aspect of the
data mining process, the pattern extraction (specifi-
cally techniques, algorithms and tools). Our goal is
to cover all steps of the process. In other words, the
authors did not capture all the aspects that interest us.
36
Rondado de Sousa, L., Oliveira de Carvalho, V., Penteado, B. and Affonso, F.
A Systematic Mapping on the Use of Data Mining for the Face-to-Face School Dropout Problem.
DOI: 10.5220/0010476300360047
In Proceedings of the 13th International Conference on Computer Supported Education (CSEDU 2021) - Volume 1, pages 36-47
ISBN: 978-989-758-502-9
Copyright
c
2021 by SCITEPRESS – Science and Technology Publications, Lda. All rights reser ved

This work is structured as follows: Section 2 de-
scribes the SLM protocol. Section 3 presents the re-
sults, as well as the analyzes and discussions for each
research question. An overview of the studies is also
presented. Finally, Section 4 concludes the paper and
discusses some gaps that can be explored.
2 PROTOCOL
A Systematic Literature Mapping (SLM) (Kitchen-
ham and Charters, 2007) is a process in which a set of
studies, available in the literature, is analyzed based
on a research question. The aim is to provide an
overview of the state of the art through the presenta-
tion and discussion of the results considering the ana-
lyzes carried out in studies identified as relevant. For
that, a protocol is elaborated, which contains the fol-
lowing steps: (a) formulation of one or more research
questions (Section 2.1); (b) identification of the pri-
mary studies to be considered (for that purpose, the
studies must be extracted and analyzed) (Section 2.2);
(c) data extraction and synthesis (Section 2.3); (d)
summary and discussion of the results (Section 3).
2.1 Research Questions
The aim of this SLM was to retrieve and analyze pri-
mary studies that use data mining in the dropout con-
text to understand how the process occurs, from data
collection to the validation of the extracted patterns.
This study only addressed the face-to-face dropout
problem, since all institutions have data on the tra-
jectories of their students in their academic systems,
which can be analyzed and explored. Therefore, the
questions below were formulated.
RQ1. What levels of education are explored? This
question aims to identify the levels of education (uni-
versity, high school, etc.) data mining has been ap-
plied. It is important to know if there are researches
focused on the different levels of education, since the
problem exists in all of them and the data mining pro-
cess can be used in these different contexts in order to
better understand the problem.
RQ2. Considering the samples (datasets) used,
how big are they and how are they generated? This
question aims to identify the samples sizes and the cut
that is made in the data to obtain the sample (by year,
by course, etc.). It is important to know the samples
sizes as this impacts on the extracted model in relation
to generalization and overfitting (Tan et al., 2018). In
addition, if the analyzes are being made to understand
the students of a certain course, a specific area (engi-
neering, for example), etc., and in what period (an-
nual, half-yearly, etc.).
RQ3. What aspects (features, attributes) have
been used to model the dropout problem? This
question aims to identify the features that have been
used to induce the models. From this analysis it is
possible to know if there is any aspect not yet ex-
plored (academic, demographic, etc.) or even to di-
rect future explorations towards what, in general, is
used.
RQ4. What kind of pre-processing has been ap-
plied to the samples? As stated by (Romero et al.,
2014), pre-processing is one of the most important
steps. It affects all other subsequent steps. There-
fore, it is important to identify the techniques that
have been applied to prepare the samples for model
induction.
RQ5. What algorithm families have been used?
As many algorithms can be used to induce a model,
it is important to identify those that have been ex-
plored and whether they are all predictive or whether
there are solutions using descriptive tasks. However,
as many algorithms can appear, we intent to group
them by similarity, as done, for example, in Weka
1
,
named here as family.
RQ6. What measures have been used to validate
the extracted patterns? After model induction, it
is necessary to validate the extracted patterns. It is
important to identify the measures that have been used
in the post-processing step, since some measures, as
accuracy, are too general to validate the results.
2.2 Identification of the Primary Studies
To identify the primary studies relevant to data ex-
traction, it is necessary to define the search string, the
databases for retrieving the papers, the inclusion and
exclusion criteria to select or not a paper as relevant
and the steps to make the selection.
Search String. The search string was formu-
lated with the aim of contemplating the issues of
“dropout” and “data mining”: “({desertion} OR
{attrition} OR {withdrawal} OR {withdraw} OR
{evasion} OR {dropout} OR {dropouts} OR {drop-
out} OR {drop-outs} OR {drop out} OR {drop outs})
AND ({student} OR {students} OR {school} OR
{academic} OR {education}) AND ({data mining}
OR {machine learning}) AND NOT ({distance} OR
{online} OR {on-line})”. The first part addresses the
dropout problem, the second the school context, the
third data mining and the last the application of a filter
to exclude distance education, since we focus on face-
to-face learning. To formulate this string we evaluated
1
https://www.cs.waikato.ac.nz/ml/weka/.
A Systematic Mapping on the Use of Data Mining for the Face-to-Face School Dropout Problem
37

the words frequently used in several works, as well as
their synonyms, and then verified the works retrieved
with such string, in the databases used, to calibrate it.
Source Selection. The search string was applied
only to electronic databases, making the necessary
adjustments to the syntax of each one. The follow-
ing electronic databases were considered: Scopus
2
,
Compendex
3
, ISI Web of Science
4
, IEEE Xplore
5
,
ACM Digital Library
6
and ScienceDirect
7
. The string
was applied to titles, abstracts and keywords. The pe-
riod considered in the search was from 01/01/2010 to
31/12/2020 (10 years)
8
.
Inclusion and Exclusion Criteria. The purpose of
defining these criteria is to identify the primary stud-
ies that provide direct evidence in relation to the re-
search questions. Therefore, the studies to be selected
for data extraction are those that do not match any
exclusion criteria. The following inclusion criterion
was considered: (i) the paper addresses the topic of
data mining in the face-to-face school dropout con-
text. The following exclusion criteria were consid-
ered: (i) the paper is out of scope: does not address
school dropout, face-to-face learning or data mining;
(ii) the paper does not contain an abstract; (iii) the pa-
per only contains an abstract; (iv) the paper is a copy
or a version of another paper already considered; (v)
the paper is not a primary study (such as editorial, po-
sition paper, keynote, opinion, tutorial, poster, panel,
book, technical report, etc.); (vi) the paper is a sec-
ondary study (review, survey, etc.); (vii) we were un-
able to access the full paper; (viii) the paper addresses
the use of tools and/or softwares and not the data min-
ing process itself; (ix) the paper is not written in En-
glish.
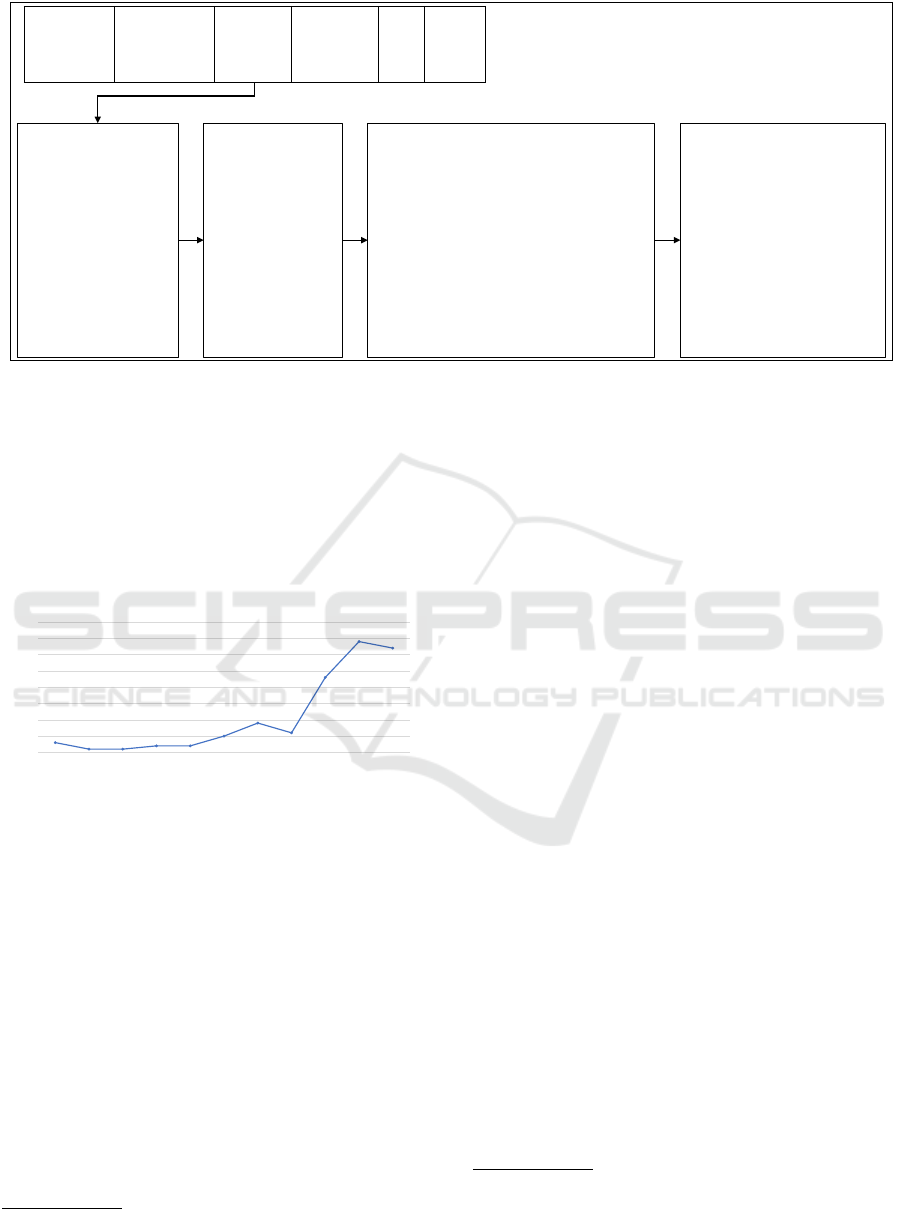
Selection Steps. To assist the process we used the
StArt
9
tool, since it automatically detects duplicate
papers, manages the entire process, maintaining a his-
tory on the number of included and excluded papers
by selection step and electronic database. Figure 1
shows the steps that were used to select the papers,
which are described in the figure itself. The values
initially obtained in the searches, as the values ob-
tained in each step, are also presented in the figure.
2
www.scopus.com.
3
www.engineeringvillage.com.
4
http://apps.webofknowledge.com/.
5
http://ieeexplore.ieee.org.
6
http://dl.acm.org.
7
http://www.sciencedirect.com.
8
The SLM was completed in October, and, at the be-
ginning of the year, the search string was executed again
in the respective databases and the papers of 2020 that had
not been identified until then were added and analyzed as
described below.
9
http://lapes.dc.ufscar.br/tools/start tool.
A total of 118 articles were selected. For the sake
of space, the set of selected papers is available at
https://bit.ly/dropout2021.
2.3 Data Extraction and Synthesis
Data extraction is concerned with collecting informa-
tion from selected articles in order to answer research
questions. Data extraction was performed through the
reading of the selected papers. However, it is also
important to extract and organize more general data
about the papers. The extraction forms were also built
with the StArt tool. The tool allows, after the extrac-
tion, to export all information to an electronic spread-
sheet in order to perform the data synthesis.
2.4 Threats to Validity
One of the advantages of making a SLM is to present
an overview of the state of the art through a method-
ological and not arbitrary process. However, even in
this case, it is possible that relevant papers end up
not being included. In this work we can mention two
threats. The first is concerned to the number of syn-
onyms related to the word dropout. As mentioned be-
fore, there is no consensus on the definition of dropout
and, therefore, many other words can be used to ex-
press dropout depending on the context. However,
we consider that we used several of them. The sec-
ond is concerned to the word data mining. As we
want to focus in all steps of the process, we consid-
ered the word machine learning as a synonym for it,
as they are general terms that cover aspects such as
techniques (such as classification), algorithms (such
as C4.5), etc. Therefore, we chose to use only gen-
eral terms and not specific ones (as neural network,
Bayesian), as done in (Agrusti et al., 2019).
3 RESULTS AND ANALYSIS
Before presenting the results regarding the research
questions, more general data about the papers are pre-
sented.
3.1 Overview of the Studies
This section presents some general aspects about the
118 selected papers.
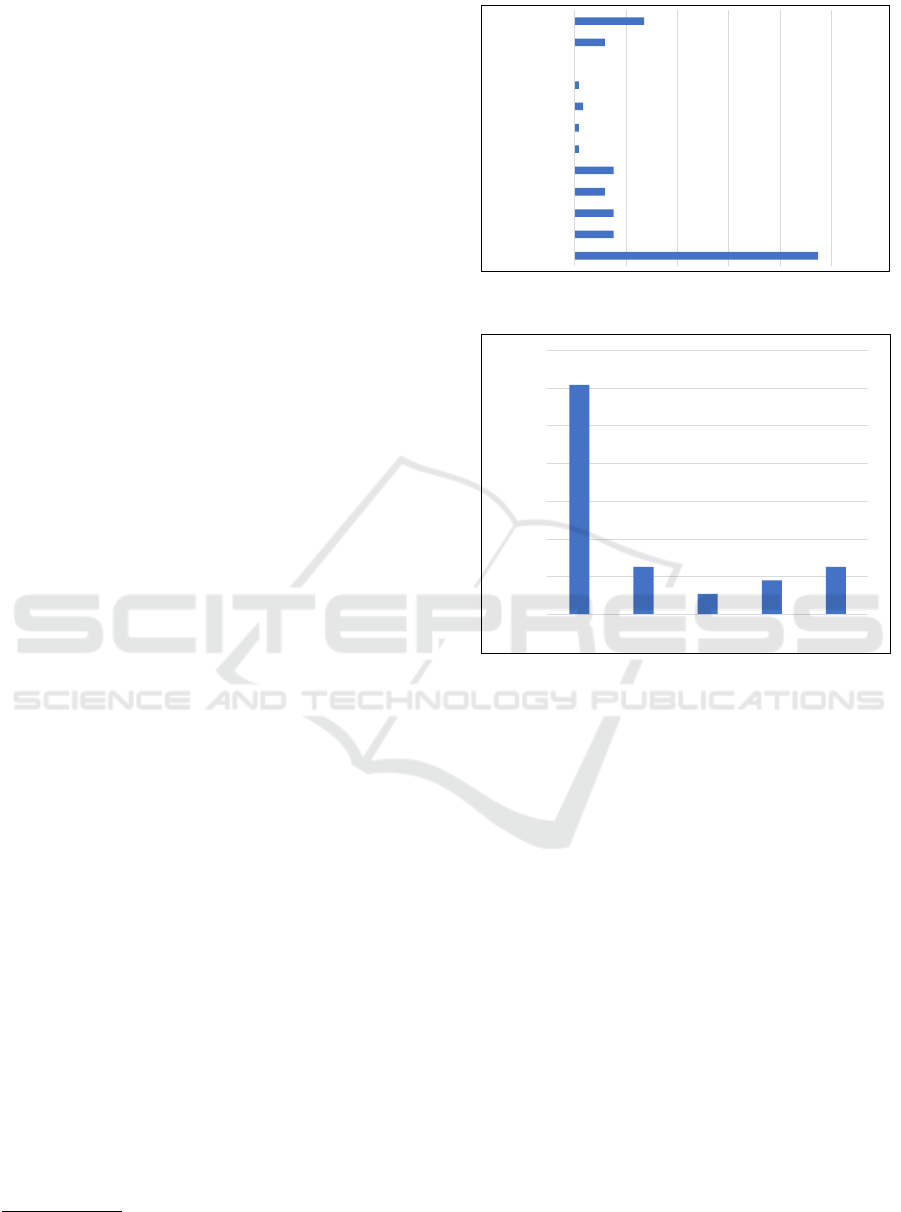
Publication Year. As mentioned before, the period
considered was from 01/01/2010 to 31/12/2020 (10
years). We could observe an increase (Figure 2) in
the number of publications since 2018. 75.42% (89
CSEDU 2021 - 13th International Conference on Computer Supported Education
38
SCOPUS
N=288
COMPENDEX
N=190
WEB OF
SCIENCE
N=181
IEEE XPLORE
N=88
ACM
N=15
SCIENCE
DIRECT
N=56
Step 1: identification
and organization of
articles returned
from digital libraries.
N=818
Step 2: automatic
removal of
duplicate articles
using the START
tool.
N=377
Step 3: review of titles and abstracts to
apply the inclusion and exclusion
criteria. Articles that met the exclusion
criteria have been removed. Articles
that met the inclusion criteria were
selected for the next step. If in doubt,
the article was included and evaluated
in the next step.
N=229
Step 4: review of complete
articles. Articles that met
the exclusion criteria have
been removed. Articles that
met the inclusion criteria
were maintained.
N=118
Figure 1: Selection steps.
studies)
10
of the papers were published from this year.
2019 (28.81%, 34) is the year with most publications,
followed by 2020 (27.12%, 32), 2018 (19.49%, 23),
2016 (7.63%, 9), 2017 (5.08%, 6), 2015 (4.24%, 5),
2010 (2.54%, 3), 2013 and 2014 (1.69%, 2 each),
2011 and 2012 (0.85%, 1 each). It can be noticed that
the interest in the presented context has been growing
year by year.
3
11
22
5
9
6
23
34
32
0
5
10
15
20
25
30
35
40
2010 2011 2012 2013 2014 2015 2016 2017 2018 2019 2020
Figure 2: Number of publications per year.
Paper Type. Most papers were found in conferences
(55.08%, 65), followed by journals (44.07%, 52) and
book chapters (0.85%, 1).
Paper Country. An interesting fact that could be
observed is that dropout is a worldwide problem.
Researchers everywhere are struggling to understand
the problem. The following countries were iden-
tified, which are listed by the number of papers
(from highest to lowest values): USA (12.71%, 15),
Brazil (11.86%, 14), Colombia and Indonesia (8.47%,
10 each), India (7.63%, 9), Thailand (5.93%, 7),
Bangladesh (5.08%, 6), Ecuador (4.24%, 5), Hun-
gary and Spain (2.54%, 3 each), Taiwan, China, Italy,
Mexico, Peru, Malaysia, Croatia, Australia, Germany
and Philippines (1.69%, 2 each), Costa Rica, Por-
tugal, Czech Republic, Pakistan, Chile, Saudi Ara-
10
From now on we will always try to present the relative
and absolute values using “()” or “,”.
bia, Botswana, Latvia, Yemen, South Africa, Canada,
Bulgaria, Korea, United Arab Emirates, Oman and
Fiji (0.85%, 1 each). The country of the first author
was considered.
Research Method. The papers were classified on
three categories
11
: “Comparative Analysis”, “Case
Study” and “Solution Proposal”. The Comparative
Analysis (56.78%, 67) includes papers that performed
comparative analyzes between techniques and/or al-
gorithms based on one or more datasets. The Case
Study (50%, 59) includes papers that presented an
analysis on a specific dataset using one or more tech-
niques and/or algorithms. The Solution Proposal
(7.63%, 9) includes papers that proposed a new so-
lution to the dropout problem through data mining.
It could be noticed that the tendency of the papers
was to perform an exploratory analysis on a specific
dataset considering different algorithms, bringing to-
gether the Comparative Analysis and Case Study cat-
egories.
3.2 RQ1: What Levels of Education Are
Explored?
The purpose of this question was to identify the lev-
els of education (university, high school, etc.) data
mining has been applied.
3.2.1 Results
It could be noticed that studies related to universities
were the majority with approximately 86.44% (102).
11
Sometimes a publication is counted more than once (for
example, it is classified in more than one category). Thus,
from now on, the sum of some percentages can be greater
than 100%.
A Systematic Mapping on the Use of Data Mining for the Face-to-Face School Dropout Problem
39
16.10% (19) were related with high school (countries:
USA, Mexico, Korea, India, Croatia, Hungary and
Brazil) (studies ID: 9, 10, 17, 18, 20, 26, 32, 41, 68,
72, 79, 94, 98, 102, 107, 111, 113, 115 and 116)
12
.
Considering the two countries with the highest num-
ber of studies, USA and Brazil, 66.67% (10) from the
USA studies are related with higher level and from
Brazil 85.71% (12).
3.2.2 Analysis and Discussion
Although dropout can occur at different levels of ed-
ucation, the level that stood out was the higher level.
The reasons for the preference for this level of edu-
cation are not reported, although studies mention that
dropout at higher level is a concern in several coun-
tries, including theoretical models of study in this
context, as addressed in (Perchinunno et al., 2019).
One of the reasons for the choice may be the fact
that the researchers use the databases of the institu-
tions where they are located. Another, as reported by
(Chen et al., 2018), is that at this level of education
more than 60% of the dropouts occur in the first two
years. However, other levels are also important, as
reported by (Chung and Lee, 2019). Therefore, more
efforts could be made to better understand the dropout
problem at different levels.
3.3 RQ2. Considering the Samples
(Datasets) Used, How Big Are They
and How Are They Generated?
The purpose of this question was to identify the sam-
ples sizes and the cut that is made in the data to obtain
the sample (by year, by course, etc.).
3.3.1 Results
The size of the samples varied widely between works.
For a better understanding, the values were grouped in
ranges, as shown in Figure 3. It was noticed that al-
most 50% (47.46%, 56) of the works used small sam-
ples when compared to the educational context; in this
case, the sizes were less than or equal to 5,000. Con-
sidering this range (Figure 4) 60.70% (34) use sizes
less than 1,000 (28.81% (34) in relation to the total
(118)).
In relation to the strategies used to obtain the sam-
ples, it could be noticed that they followed a cer-
tain pattern: period of time (annual or half-yearly),
number of subjects and number of courses. Figure 5
presents the obtained patterns. It can be seen that the
12
From now on, the papers associated with the IDs can
be seen at https://bit.ly/dropout2021.
47.46% (56)
7.63% (9)
5.93% (7)
5.93% (7)
7.63% (9)
0.85% (1)
0.85% (1)
1.69% (2)
0.85% (1)
0% (0)
5.93% (7)
13.56% (16)
]1,-5,000]
]5,000-10,000]
]10,000-15,000]
]15,000-20,000]
]20,000-25,000]
]25,000-30,000]
]30,000-35,000]
]35,000-40,000]
]40,000-45,000]
]45,000-50,000]
>50,000
Not specified
Frequency
Ranges
Figure 3: Samples size grouped by ranges.
60.71%
(34)
12.50%
(7)
5.36%
(3)
8.93%
(5)
12.50%
(7)
0.00%
10.00%
20.00%
30.00%
40.00%
50.00%
60.00%
70.00%
]1-1,000] ]1,000-2,000] ]2,000-3,000] ]3,000-4,000] ]4,000-5,000]
Frequency
Ranges
Figure 4: Range ]1-5,000] (Figure 3) broken in ranges of
1,000.
samples include data from periods longer than two
years, as well as data from more than two courses.
For a better understanding of the results, since the in-
formation was obtained during the reading of the pa-
pers, a synthesis was generated to relate “period” x
“aspects related to the courses”. As seen in Figure 6
56.78% (67) of the studies have used samples cover-
ing two or more courses considering a period of more
than two years.
3.3.2 Analysis and Discussion
As mentioned before, it is important to know the sam-
ples sizes as this impacts on the extracted model in
relation to generalization and overfitting (Tan et al.,
2018). It was noticed that almost 50% (47.46%,
56) of the works used small samples when compared
to the educational context (being 28.81% (34) less
than 1,000). Therefore, in some contexts, it may be
difficult to conclude about the results regarding the
dropout problem, i.e., the inferences may not be gen-
eralizable. This aspect was not considered during
the data mining process, regardless of the algorithms
CSEDU 2021 - 13th International Conference on Computer Supported Education
40
3.39%
(4)
35.59%
(42)
3.39%
(4)
20.34%
(24)
4.24%
(5)
1.69%
(2)
32.20%
(38)
15.25%
(18)
0.00%
5.00%
10.00%
15.00%
20.00%
25.00%
30.00%
35.00%
40.00%
Frequency
Figure 5: Samples patterns.
56.78% (67)
36.44%(43)
9.32%
(11)
2.54%(3)
0.00%
10.00%
20.00%
30.00%
40.00%
50.00%
60.00%
Frequency
Figure 6: Samples patterns organized by “period” x “as-
pects related to the courses”.
used. In addition, it was noticed that the data used
to carry out the experiments are not available, which
hinders the reproducibility of the research (more on
reproducibility see (Tatman et al., 2018)). In general,
the data is a sample from a database of a specific in-
stitution.
The other aspect explored was whether the ana-
lyzes are being made to understand the students of
a certain course, a specific area (engineering, for ex-
ample), etc., and in what period (annual, half-yearly,
etc.). It could be seen that many studies focus on two
or more courses considering a period of more than
two years. Thus, there is a concern about diversifica-
tion (several courses) considering a longer period of
time. This fact favors the problem of the size of the
samples, which in general is small.
Finally, it is worth mentioning that most studies
do not mention the moment when dropout is ana-
lyzed. Only 16.95% (20) of the works make this in-
dication, for example, (Delen, 2010), (Castro et al.,
2018), (Chai and Gibson, 2015), which indicate that
the dropout analysis is carried out at the end of each
semester.
3.4 RQ3. What Aspects (Features,
Attributes) Have Been Used to
Model the Dropout Problem?
The purpose of this question was to identify the fea-
tures that have been used to induce the models.
3.4.1 Results
Papers, in general, use different features; however, the
reason for including them is not essentially justified.
191 distinct features were accounted (including the la-
bel “Not specified”). Thus, to better understand the
set of distinct features found, the strategy of dividing
them into groups of variables was used, namely: de-
mographic, social, psychological, financial and aca-
demic. The works of (Chai and Gibson, 2015), (Dhar-
mawan et al., 2018), (P
´
erez et al., 2018a), (P
´
erez
et al., 2018b), (Sorensen, 2018), (Guarin et al., 2015)
and (Delen, 2010) carry out similar strategies.
Figure 7 shows the distribution of the 191 fea-
tures across the groups. The two groups that stand
out are those related to academic and demographic
variables, which together represent more than 77.49%
(148) of the total. Table 1 shows the most representa-
tive features in each group, the frequency and percent-
age of occurrence. For the academic and demographic
groups, the features with a frequency greater than or
equal to 10 are presented; for the other groups (psy-
chological, social and financial) greater than or equal
to 5. Note that a feature can appear in one or more
studies; thus column “Freq.” (frequency) presents
two pieces of information, X/Y, where X indicates
the number of occurrence of the listed features and Y
the number of occurrence of the features in the group.
“%” indicates the percentage regarding the listed fea-
tures (
X
Y
). Finally, Table 2 presents for each of the
groups the papers IDs that contain, at least, one fea-
ture of the group. Observe that most papers use fea-
Figure 7: Distribution of the 191 distinct features across the
groups.
A Systematic Mapping on the Use of Data Mining for the Face-to-Face School Dropout Problem
41
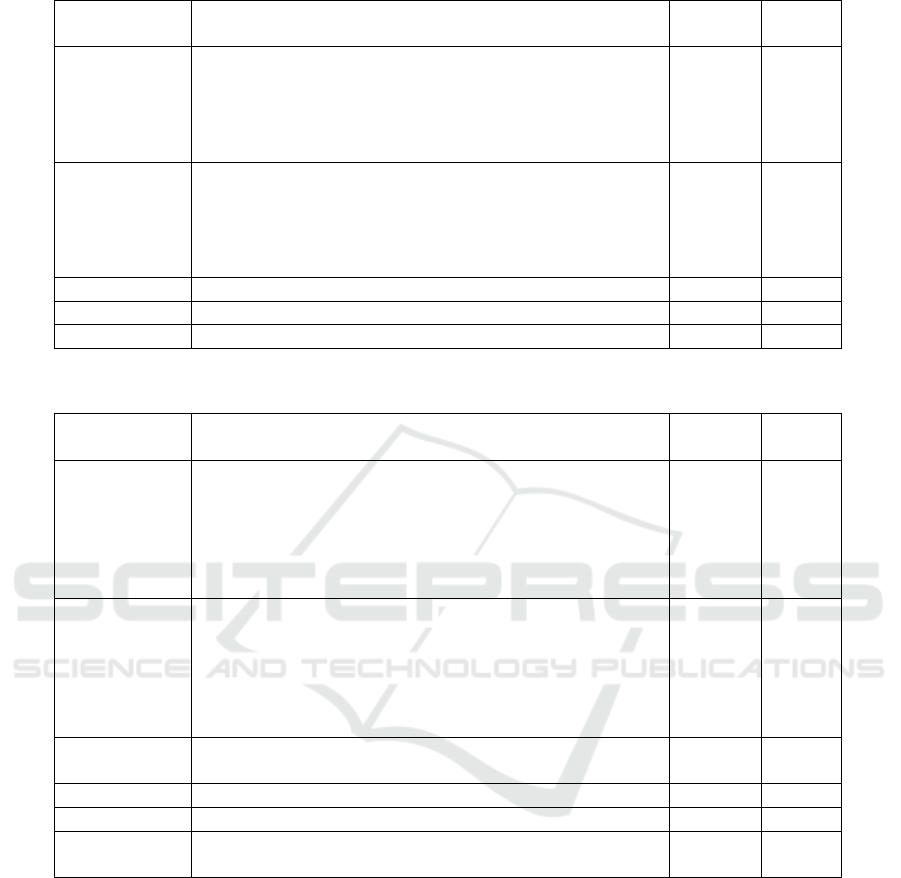
Table 1: Most representative features of each group.
Feature
Group
Features Freq. %
Academic course (11.76%, 40), yield (7.94%, 27), year ticket and
GPA (6.47%, 22 each), course area (5%, 17), admission
note (4.41%, 15); conclusion year, credits per semester
and admission form (3.53%, 12 each) and native lan-
guage note (3.24%, 11)
190/340 55.88%
Demographic gender (19.26%, 68), age (9.35%, 33), has work (6.52%,
23), marital status (5.95%, 21), schooling of the fa-
ther (5.38%, 19), mother’s schooling (5.10%, 18), ad-
dress (4.53%, 16), mother has work and father has work
(4.25%, 15 each) and ethnicity (3.68%, 13)
241/353 68.27%
Psychological interest in studies (17.24%, 5), personality (17.24%, 5) 10/29 34.48%
Social relationship with friends (17.24%, 5) 5/29 17.24%
Finance familiar income (54.55%, 18), financing type (15.15%, 5) 23/33 69.70%
Table 2: Studies by feature groups.
Feature
Group
Study ID Freq. %
Academic 2, 3, 5, 6, 7, 8, 10, 11, 12, 15, 16, 17, 20, 21, 22, 24, 25,
26, 27, 28, 29, 30, 31, 32, 33, 34, 35, 36, 37, 38, 40, 41,
42, 43, 44, 46, 47, 49, 50, 51, 53, 54, 55, 56, 57, 58, 59,
61, 62, 63, 64, 66, 67, 68, 69, 71, 75, 76, 78, 79, 80, 81,
83, 84, 86, 88, 89, 90, 91, 95, 99, 100, 101, 102, 103,
105, 107, 108, 109, 111, 112, 114, 115, 116, 118
85 72.03%
Demographic 1, 2, 6, 8, 9, 10, 11, 12, 15, 16, 17, 18, 20, 21, 24, 25,
26, 27, 28, 29, 30, 31, 32, 33, 35, 36, 37, 38, 40, 41, 42,
43, 44, 46, 48, 49, 51, 53, 54, 55, 56, 57, 58, 59, 60, 61,
63, 64, 67, 68, 69, 71, 75, 76, 78, 79, 80, 81, 83, 84, 88,
89, 90, 91, 92, 96, 99, 100, 102, 103, 105, 108, 111, 112,
114, 115, 118
77 65.25%
Finance 2, 3, 10, 12, 24, 26, 27, 30, 31, 35, 36, 37, 42, 43, 46, 48,
56, 58, 60, 63, 71, 76, 79, 89, 92, 96, 102, 105
28 23.73%
Social 1, 6, 7, 28, 30, 60, 63, 71, 89, 92, 108, 111 12 10.17%
Psychological 1, 7, 28, 30, 41, 46, 48, 54, 71, 115 10 8.47%
Not specified 4, 9, 13, 14, 15, 17, 19, 22, 39, 45, 52, 65, 70, 72, 73, 74,
82, 85, 87, 93, 97, 98, 102, 104, 106, 113
26 22.03%
tures from the academic (72.03%) and demographic
(65.25%) groups.
3.4.2 Analysis and Discussion
As seen above, the two groups that stand out are those
related to academic and demographic features. The
use of these groups is justified due to the fact that the
institutions store these data in the student’s history;
however, the other groups represent additional data
that are usually collected through other mechanisms,
such as physical or digital forms. However, there is
a tendency to use variables from different groups in
order to verify their influence in the process. In ad-
dition, it is clear that despite the papers use a consid-
erable number of variables, there is no consensus on
their choice, indicating a gap to be explored regarding
their selection.
Another aspect observed is that few papers dis-
cuss and/or present the best predictive features, as
in the following works: (Adil et al., 2018) number
of family members, relationship with teachers, inter-
est in studies; (Delen, 2010) academic performance
(grades/concepts), financial aid (scholarship); (Castro
et al., 2018) cite, in addition to age, variables selected
through the psychological test called BADyG, among
them, visual memory, speed of reasoning and ability
to complete sentences; (Chai and Gibson, 2015) aver-
CSEDU 2021 - 13th International Conference on Computer Supported Education
42
age grade in the course, study time, amount of credits
taken. Thus, even if the groups of academic and de-
mographic variables stand out, the predictive features
are not always within these groups. This lack of anal-
ysis of the best predictive features may be related, for
example, to data characteristics, types of samples, re-
search objective, etc. The fact is that there was no
consensus on the most predictive, i.e., it was not pos-
sible to identify the main predictive features and/or if
there is any relationship between them.
3.5 RQ4. What Kind of Pre-processing
Has Been Applied to the Samples?
The purpose of this question was to identify the tech-
niques that have been applied to prepare the samples
for model induction.
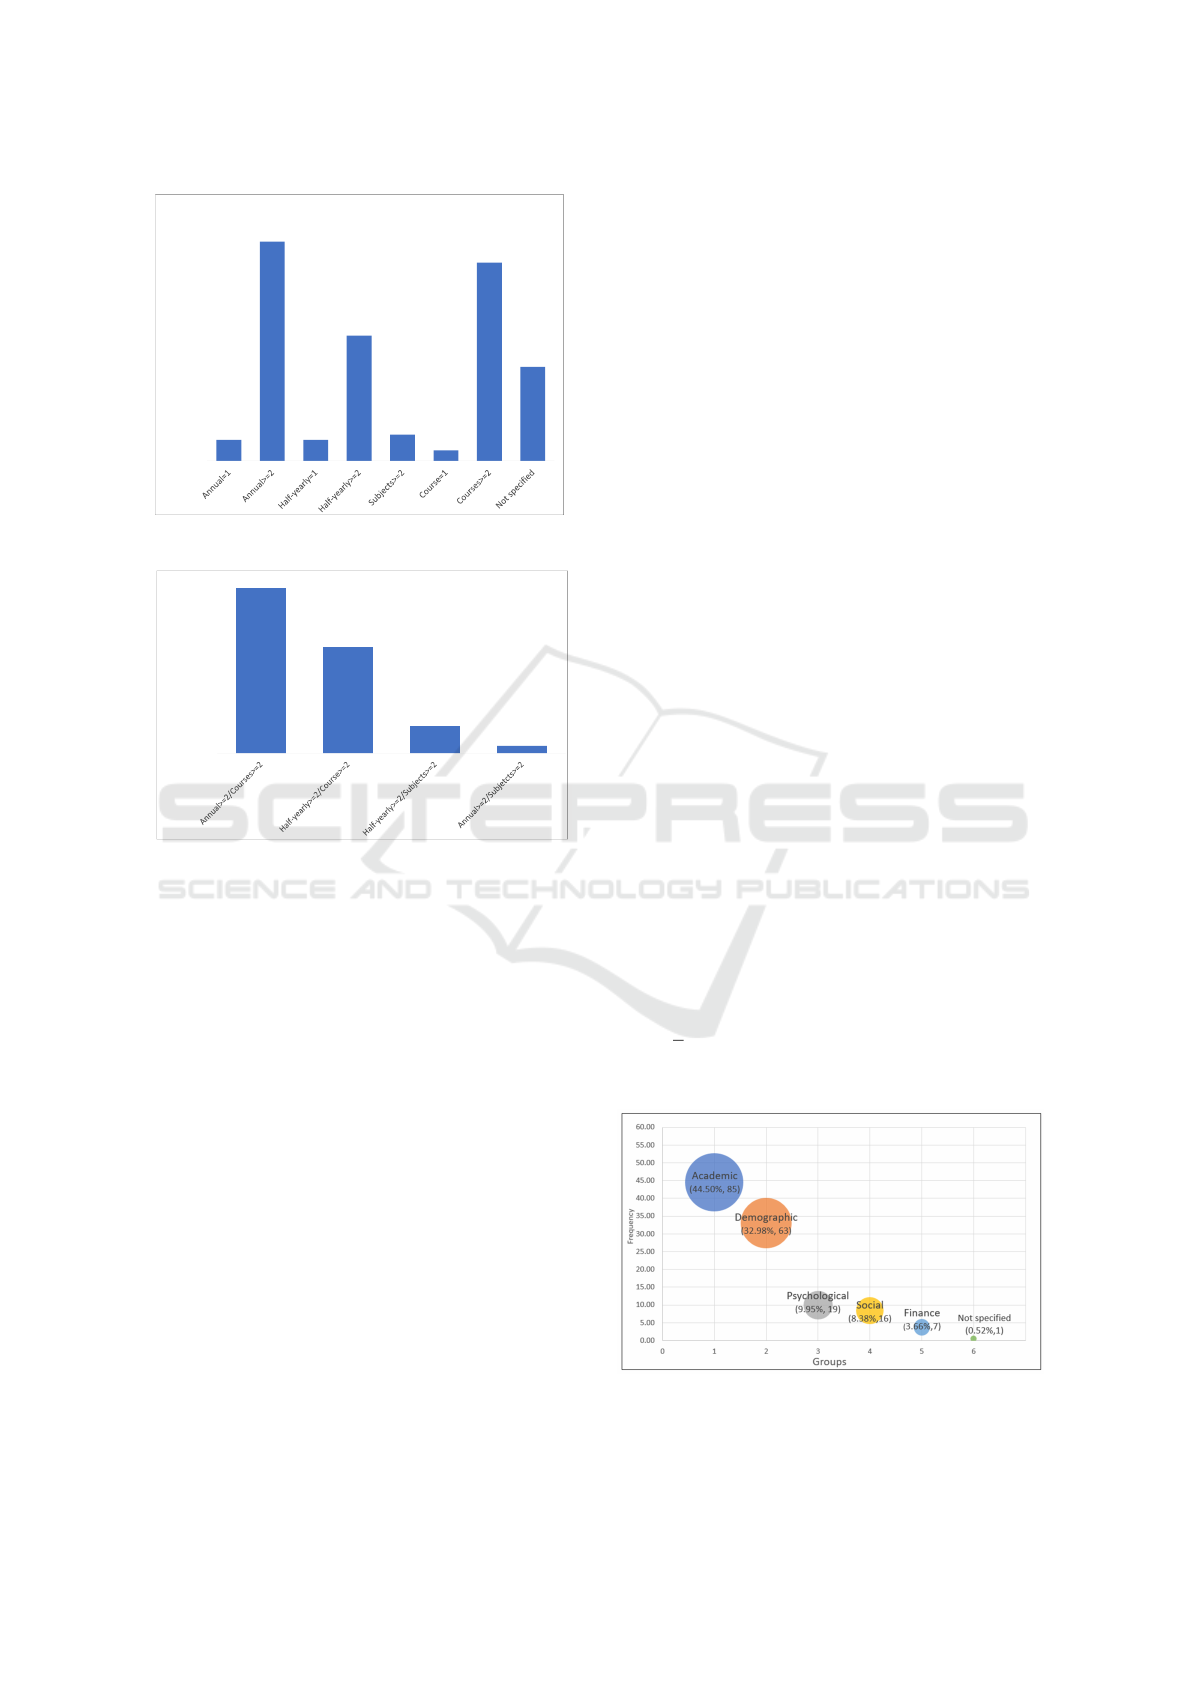
3.5.1 Results
Even though pre-processing is one of the most im-
portant steps, 42.37% (50) of the papers do not spec-
ify the type of pre-processing performed, although
most of them (57.63%, 68) mention that this step was
used. In these papers, the following pre-procesing
were done: missing values (20.34%, 24), data bal-
ance (19.49%, 23), attribute selection (16.10%, 19),
descriptive statistic (15.25%, 18), attribute reduction
and discretization (5.93%, 7 each), data normalization
and outlier (2.54%, 3 each), attribute creation (0.85%,
1). Table 3 presents for each of the pre-processing
techniques the papers IDs that contain, at least, one
solution regarding it. See (Tan et al., 2018) for details
on data pre-processing.
3.5.2 Analysis and Discussion
Although pre-processing affects all other subsequent
steps, the reason for the lack of information on this
step (42.37%) may be due to the characteristics of
the algorithms used, as explained in (Alexandropou-
los et al., 2019). The authors relate the algorithms to
the pre-processing techniques and indicate that some
algorithms already have implicit pre-processing steps.
It could be noticed that the step was considered so
trivial that its details were not presented or briefly pre-
sented; however, the results may be compromised, es-
pecially in the context of dropout, since the problem
is inherently imbalanced (only 19.49% of the papers
comment on this aspect).
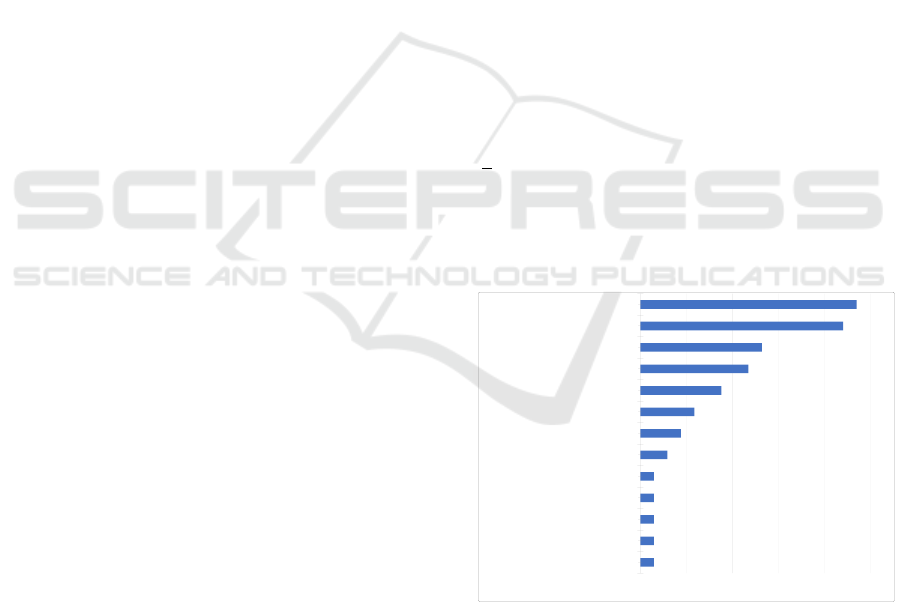
3.6 RQ5. What Algorithm Families
Have Been Used?
The purpose of this question was to identify the al-
gorithm families that have been explored and whether
they are all predictive or whether there are solutions
using descriptive tasks.
3.6.1 Results
68 distinct algorithms were accounted. Grouping
them by task we have: classification (95.59%, 65),
clustering, association and sequential pattern (1.47%,
1 each). The task that stood out was classifica-
tion. Grouping them by similarity, as previously men-
tioned, named here as family, we have the frequen-
cies shown in Figure 8. Table 4 shows the most rep-
resentative algorithm in each family, the frequency
and percentage of occurrence. Note that an algo-
rithm can appear in one or more studies; thus col-
umn “Freq.” (frequency) presents two pieces of in-
formation, X/Y, where X indicates the number of oc-
currence of the listed algorithm and Y the number of
occurrence of the algorithms in the family. “%” in-
dicates the percentage regarding the listed algorithm
(
X
Y
). Finally, Table 5 presents for each of the families
the papers IDs that contain, at least, one algorithm of
the group. The families that stood out were decision
tree (69.49%, 82), ensemble (51.69%, 61) and regres-
sion (32.20%, 38) (as seen in Table 5).
23.53%
(16)
22.06% (15)
13.24%(9)
11.76%(8)
8.82%(6)
5.88%(4)
4.41%(3)
2.94%(2)
1.47%(1)
1.47%(1)
1.47%(1)
1.47%(1)
1.47%(1)
0.00% 5.00% 10.00% 15.00% 20.00% 25.00%
Decision Tree
Ensemble
Rule-Based
Neural Network/Deep Neural Networks
Regression
Bayesian
Instance-Based
Support Vector Machine
Clustering
Association
Discriminant Analysis
Sequential Pattern
Nature-Inspired
Figure 8: Frequency of algorithm families.
3.6.2 Analysis and Discussion
Although different algorithms were used, there was
no mention of the reasons for the choice. It was ob-
served that the choice was made arbitrarily, seeking
to diversify the exploration in order to measure the
results (see Section 3.1 about “Comparative Analy-
A Systematic Mapping on the Use of Data Mining for the Face-to-Face School Dropout Problem
43

Table 3: Studies by pre-processing techniques.
Technique Study ID Freq. %
Missing
Values
2, 5, 10, 16, 18, 21, 22, 23, 24, 29, 30, 32, 37, 38, 41, 45,
54, 58, 67, 68, 99, 100, 103, 108
24 20.34%
Data Balance 9, 18, 23, 28, 30, 31, 33, 38, 41, 47, 49, 50, 60, 61, 62,
63, 64, 79, 81, 85, 99, 107, 111
23 19.49%
Attribute
Selection
1, 2, 18, 21, 28, 30, 35, 41, 49, 53, 59, 63, 77, 80, 84, 88,
89, 93, 99, 105, 110, 112
19 16.10%
Descriptive
Statistic
2, 5, 7, 10, 11, 18, 19, 23, 24, 29, 37, 41, 42, 45, 46, 48,
50, 56
18 15.25%
Attribute
Reduction
2, 4, 30, 33, 58, 69, 103 7 5.93%
Discretization 10, 24, 29, 30, 32, 40, 109 7 5.93%
Data Nor-
malization
1, 2, 113 3 2.54%
Outlier 1, 58, 93 3 2.54%
Attribute
Creation
1 1 0.85%
Not specified 3, 6, 12, 13, 14, 15, 17, 20, 25, 26, 27, 34, 36, 39, 43, 44,
51, 52, 55, 57, 65, 66, 70, 71, 73, 74, 75, 76, 78, 82, 83,
86, 87, 90, 91, 92, 94, 95, 96, 97, 98, 101, 102, 104, 106,
114, 115, 116, 117, 118
50 42.37%
Table 4: Most representative algorithm of each family.
Family Algorithm Freq. %
Decision Tree J48/C4.5 41/118 34.75%
Ensemble Random Forest 40/86 46.51%
Regression Logistic Regression 36/42 85.71%
Bayesian Naive Bayes 31/37 83.78%
Neural Network/Deep Neural Network MLP 22/36 61.11%
Support Vector Machine SVM 29/30 96.67%
Rule-Based OneR 9/28 32.14%
Instance-Based KNN 20/22 90.91%
Clustering K-means 7/7 100%
Association Apriori 5/5 100%
Discriminant Analysis Linear Discriminant Analysis (LDA) 3/3 100%
Sequential Pattern PrefixSpan 1/1 100%
Nature-Inspired Bacterial Foraging Optimization (BFO) 1/1 100%
sis” and “Case Study”). The decision tree and regres-
sion families may have stood out due to the fact that
the algorithms belonging to them are interpretable
(white box) (Burkart and Huber, 2020), since it is
possible not only to generate a predictive model, but
also to understand the model generated. Therefore,
thinking nowadays about Explainable Artificial In-
telligence (XAI) and white box models, other fami-
lies could be explored, such as associative classifiers
(Padillo et al., 2020).
3.7 RQ6. What Measures Have Been
Used to Validate the Extracted
Patterns?
The purpose of this question was to identify the mea-
sures that have been used in the post-processing step
to validate the extracted patterns.
3.7.1 Results
The measures identified in the papers were accu-
racy (81.36%, 96), precision (37.29%, 44), recall
CSEDU 2021 - 13th International Conference on Computer Supported Education
44

Table 5: Studies by algorithm families.
Algorithm
Family
Study ID Freq. %
Decision Tree 1, 2, 4, 5, 6, 7, 8, 9, 10, 13, 14, 16, 17, 19, 21, 23, 24, 25, 26, 27,
28, 29, 30, 31, 32, 33, 34, 35, 36, 37, 38, 39, 40, 41, 42, 43, 44,
45, 46, 48, 49, 52, 56, 57, 58, 59, 60, 62, 63, 64, 66, 68, 69, 74,
76, 77, 78, 79, 81, 83, 84, 86, 87, 88, 89, 90, 91, 92, 97, 99, 100,
101, 103, 105, 106, 108, 109, 110, 111, 112, 117, 118
82 69.49%
Ensemble 2, 3, 5, 6, 8, 11, 12, 13, 16, 17, 22, 23, 24, 29, 32, 37, 43, 46, 49,
51, 54, 55, 57, 58, 59, 61, 62, 65, 66, 67, 68, 69, 71, 72, 73, 75,
80, 82, 83, 84, 85, 87, 88, 89, 90, 91, 93, 94, 95, 96, 98, 99, 101,
102, 105, 108, 109, 112, 113, 114, 116
61 51.69%
Regression 2, 3, 6, 8, 12, 13, 15, 16, 17, 18, 19, 22, 29, 37, 44, 46, 47, 49,
51, 53, 54, 56, 64, 68, 69, 70, 83, 89, 90, 93, 94, 96, 101, 106,
107, 110, 112, 117
38 32.20%
Bayesian 2, 4, 6, 8, 12, 13, 15, 16, 21, 22, 23, 24, 26, 31, 32, 33, 34, 37,
43, 57, 58, 72, 77, 83, 84, 87, 89, 90, 91, 95, 97, 99, 100, 105,
115, 118
36 30.51%
Neural Net-
work/Deep
Neural Net-
work
2, 3, 11, 24, 29, 32, 33, 34, 37, 43, 44, 46, 50, 52, 53, 55, 56, 59,
60, 68, 69, 78, 81, 83, 84, 87, 89, 90, 101, 106, 110, 111, 112
33 27.97%
Support Vec-
tor Machine
1, 3, 12, 15, 17, 18, 22, 26, 32, 34, 37, 46, 56, 58, 59, 62, 65, 67,
68, 69, 87, 89, 90, 91, 93, 94, 95, 105, 110, 112
30 25.42%
Instance-
Based
1, 2, 6, 12, 16, 26, 32, 33, 56, 58, 59, 62, 68, 87, 89, 95, 96, 99,
101, 106, 113
21 17.80%
Rule-Based 23, 26, 30, 32, 38, 41, 43, 63, 77, 79, 84, 103, 115 13 11.01%
Clustering 14, 27, 29, 35, 45, 47, 104 7 5.93%
Association 12, 35, 45, 52, 104 5 4.24%
Discriminant
Analysis
57, 67, 106 3 2.54%
Nature-
Inspired
62 1 0.85%
Sequential
Pattern
20 1 0.85%
(33.90%, 40)
13
, f-measure (27.97%, 33), area under
curve (AUC) (25.42%, 30, including ROC curve),
true positive (20.34%, 24), true negative (16.10%,
19) false positive and sensitivity (10.17%, 12 each),
false negative (8.47%, 10), specificity (7.63%, 9),
kappa (5.93%, 7), absolute average error and geo-
metric mean (4.24%, 5 each), confidence and gini
(3.39%, 4 each), root mean square error (2.54%, 3),
relative absolute error (1.69%, 2) and support, un-
weighted average recall (UAR), permutation decrease
importance (0.85%, 1 each).
3.7.2 Analysis and Discussion
As the classification task was the one that stood out,
measures referring to the confusion matrix were fre-
13
Recall and sensitivity are the same measures. However,
we preferred to use both to keep the way it was cited.
quently used. Accuracy was the most prevalent mea-
sure. However, as mentioned in (Fern
´
andez et al.,
2018, p.47-49), accuracy is not an adequate measure
to be applied when unbalanced data are used, which
usually occurs when working in the dropout domain.
Thus, the results do not necessarily express clearly the
validity of the obtained model, as it can correctly pre-
dict the examples of the majority class (dropout) and
incorrectly those of the minority class (non-dropout).
However, it is important to mention that 74 (77.08%)
of the 96 studies that used accuracy also applied other
assessment measures. Finally, it was observed that,
as in the algorithm families, the reason for the choice
was not mentioned.
A Systematic Mapping on the Use of Data Mining for the Face-to-Face School Dropout Problem
45

4 CONCLUDING REMARKS
This work presented a SLM to identify and ana-
lyze the primary studies available in the literature
to address some research questions on the use of
data mining for the face-to-face school dropout prob-
lem. The period considered was from 01/01/2010 to
12/31/2020 (10 years). In general, it was observed
that: (i) the academic community has shown inter-
est in the subject, approaching it more strongly since
2018 and, in particular, involving the level of higher
education; (ii) the subject has been addressed in sev-
eral countries, as it is a global problem; (iii) the use of
data mining is more focused on exploratory analysis
(“comparative analysis” and “case study‘”) on spe-
cific datasets (samples); (iv) the samples are gener-
ally small and cover two or more courses consider-
ing a period of more than two years; (v) many fea-
tures are considered in the selection of the samples,
with emphasis on the group of academic and demo-
graphic variables; (vi) most studies adhere to the clas-
sification task, with families of decision tree, ensem-
ble and regression algorithms being used frequently;
(vii) several pre-processing techniques and validation
measures (post-processing) were used.
Considering the SLM it is noted that some gaps
can be explored in order to use data mining, in the
presented context, in a broader way. As mentioned
before, as samples are, in general, small it may be
difficult to conclude about the results regarding the
dropout problem, i.e., the inferences may not be gen-
eralizable. Thus, larger samples could be considered,
since the amount of data that make up an educational
system is generally high. This also makes it possible
to apply other families of algorithms, such as those of
deep neural networks. However, in this case, it would
be of interest to use XAI to make the results inter-
pretable, since in some contexts only prediction is not
enough. Another solution would be the application
of other inherently interpretable families (white box),
such as that of associative classifiers.
Still regarding the samples, it would be interest-
ing if the researchers made their datasets (samples)
available, in order to allow the reproducibility of the
experiments. In this case, it would be possible to
build a “ global ” dataset, making it feasible to obtain
an overview of evasion in several countries. A more
general analysis of the algorithms in relation to the
dropout problem would also be possible, as well as
the adaptation and/or proposal of specific solutions to
the problem. In addition, it is clear that despite the pa-
pers use a considerable number of variables, there is
no consensus on their choice. It is necessary to carry
out studies that try to identify which features are most
relevant or whether one group of variables has more
weight than another in the presented context.
Regarding pre-processing, the step was consid-
ered so trivial that its details were not presented or
briefly presented. However, the dropout problem is
inherently imbalanced. Thus, it is interesting that
studies evaluating this issue of imbalance be car-
ried out. Associated with this, in relation to post-
processing, it is necessary that more appropriate val-
idation measures be used, and not just general ones
such as accuracy.
Finally, it is important to mention that if interested
readers want some additional information on any of
the presented aspects, they can consult the details
in the eletronic spreadsheet available at https://bit.ly/
msl evasao2020. The spreadsheet contains a tab re-
garding each question/aspect discussed here. For ex-
ample, if the reader wants to know the techniques
used to balance the samples in the pre-processing
step, he/she only needs to consult the tab related to
the topic. The aim of this SLM was to provide an
overview of the aspects related to data mining, with-
out going into details about the specific techniques,
but about the solution itself (for example, imbalanced
techniques, instead of SMOTE).
REFERENCES
Adil, M., Tahir, F., and Maqsood, S. (2018). Predictive anal-
ysis for student retention by using neuro-fuzzy algo-
rithm. In 10th Computer Science and Electronic En-
gineering (CEEC), pages 41–45.
Agrusti, F., Bonavolonta, G., and Mezzini, M. (2019). Uni-
versity dropout prediction through educational data
mining techniques: A systematic review. Journal of
e-learning and knowledge society, 15:161–182.
Alexandropoulos, S.-A. N., Kotsiantis, S. B., and Vra-
hatis, M. N. (2019). Data preprocessing in predic-
tive data mining. The Knowledge Engineering Review,
34(e1):1–33.
Burkart, N. and Huber, M. F. (2020). A survey on the ex-
plainability of supervised machine learning. CoRR,
abs/2011.07876.
Castro, R. L. F., Espitia, P. E., and Montilla, A. F. (2018).
Applying CRISP-DM in a KDD process for the analy-
sis of student attrition. Communications in Computer
and Information Science, 885:386–401.
Chai, K. E. K. and Gibson, D. (2015). Predicting the risk of
attrition for undergraduate students with time based
modelling. In Proceedings of the 12th International
Conference on Cognition and Exploratory Learning
in the Digital Age (CELDA), pages 109–116.
Chen, Y., Johri, A., and Rangwala, H. (2018). Running
out of STEM: A comparative study across STEM ma-
jors of college students at-risk of dropping out early.
CSEDU 2021 - 13th International Conference on Computer Supported Education
46

In ACM International Conference Proceeding Series,
pages 270–279.
Chung, J. Y. and Lee, S. (2019). Dropout early warning sys-
tems for high school students using machine learning.
Children and Youth Services Review, 96(C):346–353.
Delen, D. (2010). A comparative analysis of machine learn-
ing techniques for student retention management. De-
cision Support Systems, 49(4):498–506.
Delen, D. (2011). Predicting student attrition with data min-
ing methods. Journal of College Student Retention:
Research, Theory & Practice, 13(1):17–35.
Dharmawan, T., Ginardi, H., and Munif, A. (2018). Dropout
detection using non-academic data. In 4th Interna-
tional Conference on Science and Technology, pages
1–4.
Fern
´
andez, A., Garc
´
ıa, S., Galar, M., Prati, R. C.,
Krawczyk, B., and Herrera, F. (2018). Learning from
Imbalanced Data Sets. Springer.
Guarin, C. E. L., Guzman, E. L., and Gonzalez, F. A.
(2015). A model to predict low academic perfor-
mance at a specific enrollment using data mining. Re-
vista Iberoamericana de Tecnologias del Aprendizaje,
10(3):119–125.
Gustian, D. and Hundayani, R. D. (2017). Combination of
AHP method with C4.5 in the level classification level
out students. In International Conference on Comput-
ing, Engineering, and Design (ICCED), page 6p.
Kitchenham, B. and Charters, S. (2007). Guidelines for per-
forming systematic literature reviews in software en-
gineering. Technical Report EBSE 2007-001, Keele
University and Durham University Joint Report.
Manh
˜
aes, L. M. B., Cruz, S. M. S., and Zimbr
˜
ao, G. (2014).
WAVE: An architecture for predicting dropout in un-
dergraduate courses using EDM. In Proceedings of
the 29th Annual ACM Symposium on Applied Com-
puting (SAC), pages 243–247.
M
´
arquez-Vera, C., Cano, A., Romero, C., Noaman, A.
Y. M., Mousa Fardoun, H., and Ventura, S. (2016).
Early dropout prediction using data mining: A case
study with high school students. Expert Systems: The
Journal of Knowledge Engineering, 33(1):107–124.
Padillo, F., Luna, J. M., and Ventura, S. (2020). LAC: Li-
brary for associative classification. Knowledge-Based
Systems, 193:105432.
Perchinunno, P., Bilancia, M., and Vitale, D. (2019). A sta-
tistical analysis of factors affecting higher education
dropouts. Social Indicators Research, pages 1–22.
Pereira, R. T. and Zambrano, J. C. (2017). Application of
decision trees for detection of student dropout profiles.
In 16th IEEE International Conference on Machine
Learning and Applications (ICMLA), pages 528–531.
P
´
erez, B., Castellanos, C., and Correal, D. (2018a). Apply-
ing data mining techniques to predict student dropout:
A case study. In IEEE 1st Colombian Conference on
Applications in Computational Intelligence, pages 1–
6.
P
´
erez, B., Castellanos, C., and Correal, D. (2018b). Pre-
dicting student drop-out rates using data mining tech-
niques: A case study. Communications in Computer
and Information Science, 833:111–125.
Pertiwi, A. G., Widyaningtyas, T., and Pujianto, U. (2017).
Classification of province based on dropout rate us-
ing C4.5 algorithm. In International Conference on
Sustainable Information Engineering and Technology
(SIET), pages 410–413.
Plotnikova, V., Dumas, M., and Milani, F. (2020). Adap-
tations of data mining methodologies: A systematic
literature review. PeerJ Computer Science, 6:e267.
Romero, C., Romero, J. R., and Ventura, S. (2014). A sur-
vey on pre-processing educational data. Studies in
Computational Intelligence, 524:29–64.
Sorensen, L. (2018). Big Data in educational adminis-
tration: An application for predicting school dropout
risk. Educational Administration Quarterly.
Tan, P.-N., Steinbach, M., Karpatne, A., and Kumar, V.
(2018). Introduction to Data Mining. Pearson, 2nd
edition.
Tatman, R., VanderPlas, J., and Dane, S. (2018). A prac-
tical taxonomy of reproducibility for machine learn-
ing research. In Reproducibility in Machine Learning
Workshop at ICML 2018, page 5p.
Tinto, V. (1993). Leaving College: Rethinking the Causes
and Cures of Student Attrition. University of Chicago
Press.
A Systematic Mapping on the Use of Data Mining for the Face-to-Face School Dropout Problem
47
