
Design of a Very Low Frequency Test Device for Faults Diagnosis
in Underground Cable
Anis Ammous
1
, Mohamed Ali Zdiri
1
, Ammar Assaidi
1
,
Abdulrahman Alahdal
1
and Kaiçar Ammous
2
1
Department of Electrical Engineering, College of Engineering and Islamic Architecture, Umm Al-Qura University, K.S.A.
2
Department of Electrical Engineering, National School of Engineers of Sfax, University of Sfax, Tunisia
Keywords: VLF Generator, Cables Faults, Neural Network, Fault Location, Spline, Identification.
Abstract: In this paper, we present the design of a Very low frequency (VLF) generator made of power electronics
converter coupled to a mechanical system. This device is used to detect and locate faults in cables. This
VLF test is an AC type test at 0.1 Hz of a cosine-rectangular waveform performed on an underground cable.
Simulations were carried out for the following cable faults: open-circuit, short-circuit, resistance fault and
spark gap. For each fault type, simulations are performed for different locations in order to collect databases
in a neural network relating the distance and the corresponding voltage from the fault location. This allows
to register the range of voltages variation in each fault, which is useful for its identification. In addition,
these databases are used to determine the fault location using the Spline interpolation method. The tests
were performed on a 20 km cable length. The obtained results show the high performance and efficiency of
the investigated methods in terms of cable fault identification precision and localization.
1 INTRODUCTION
Overhead lines and underground cables provide
energy transport from power generation plants.
Distribution underground networks and especially
transmission networks are undergoing rapid
development imposed by the growth of urban areas
on the one hand and on the other hand for a better
quality of service and environment required by the
citizen consumer of electricity. The structure of the
cables directly influences the number of
measurements to be carried out to characterize the
types of faults (H. KUZYK, 2006).
Compared to overhead lines, the structure of
underground cables is complicated by the presence
of metal shielding near the central conductor.
Therefore, the inductive and capacitive effects are of
extreme importance, which requires special attention
when calculating the physical parameters of
underground cables such as resistances, chokes and
mutual inductances as well as capacitances (M.
Pays, 1994). In addition, underground electricity
cables have many advantages compared to overhead
lines. Indeed, they require virtually no maintenance
and above all are not affected by hard weather
conditions. On the other hand, and from an
operational point of view, repairing time of a faulty
cable is relatively long due to time-differed steps
necessary for fault location and troubleshooting
procedure.
The electricity transmission network, especially,
using underground cables is never immune to
electrical incidents due to internal and external
origins, causing blackouts. These faults are mostly
from external origin due to earthmoving works (H.
KUZYK, 2006). When an incident occurs, the direct
consequence is the power outage. It is therefore
appropriate for the power company to ensure the
restoration of electrical energy as soon as possible,
hence the need to identify the types and locations of
faults. The faults types are classified mainly into
four families which are open-circuit, short-circuit,
resistance and spark gap faults.
In order to ensure the continuity of electrical
power supply, electricity companies seek to identify
and locate the faulty cable segment with a good
precision in a short time in order to reduce
downtime. This can only be achieved by
implementing simple, fast and precise pre-location
techniques based on an exact determination of the
physical parameters of the cable in order to reduce
repairing time and cost. The different operating
196
Ammous, A., Zdiri, M., Assaidi, A., Alahdal, A. and Ammous, K.
Design of a Very Low Frequency Test Device for Faults Diagnosis in Underground Cable.
DOI: 10.5220/0010472001960203
In Proceedings of the 10th International Conference on Smart Cities and Green ICT Systems (SMARTGREENS 2021), pages 196-203
ISBN: 978-989-758-512-8
Copyright
c
2021 by SCITEPRESS – Science and Technology Publications, Lda. All rights reserved

disturbances observed in the electrical networks
lead, in most cases, power cuts and a important
number of incidents, which are due to external
injuries or internal breakdowns of cables or their
accessories.
Currently, diagnostic methods are developed and
used in a several sectors such as cable faults and
power converters faults (M.A. Zdiri et al., 2019;
M.A. Zdiri et al., 2019; M.A. Zdiri et al., 2020). The
main goal of diagnostic techniques is to prevent
downtime during maintenance on electric network,
independently to its voltage level. It will allow the
operator to determine accurately the cable state
(effects of aging, degree of humidity, or even water
trees) and to warn operator about the deterioration
on the insulation of medium and high voltage cables
by using the dielectric diagnostics (TAN) and the
partial discharge (DP) (H. KUZYK, 2006). The
nature of a fault can easily be determined by simple
methods of measuring insulation resistance and
conductor continuity. The cable tests goal consist to
explore new installations (commissioning, checking
junction and ending boxes) during repair works. The
tests can be carried out with direct current or (VLF)
alternative current (M. Baur, 2008). The VLF
method, recently developed for cables in synthetic
material, has also proved its effectiveness for cables
insulated with impregnated paper. In addition, it
allows a much more interesting and precise
diagnosis, which made its success and incorporation
into European standards (Norme, DIN VDE, 1995).
In (H. Oetjen, 2004), the authors compare different
VLF techniques related to the correlation between
the data of test field and test parameters.
Furthermore, a new design and realization of a VLF
technique based on 0.1 Hz sinusoidal waveform is
presented in (S. Seesanga et al., 2008). In order to
detect and identify cables faults in medium voltage,
the authors in (B.V. Wong et al., 2016) investigate
the VLF test combined with Tan Delta and Partial
Discharge. In addition, the authors in (C. Xie et al.,
2018) highlighted the capacity of the main VLF
testing methods for the cables XLPE (
Cross-linked
polyethylene)
of newly installed 10 kV in approval
tests. Meanwhile, the failures of insulation of XLPE
cables have become a hard security hazard. The
authors in (X. Tan et al., 2019) propose a new type
of 0.1 Hz VLF sinusoidal waveform generator that is
characterized by a novel control and simple
structure.
Despite the existence of different methods in
literature, there is still a lot to be done in order to
develop new methods to improve the reliability of
underground cables. In this paper, we have proposed
a cosine-rectangular waveform VLF device at 0.1
Hz, based on power switches, to detect and identify
the faults of an underground cable with 20 km
length. Using this VLF generator, we tested four
types of faults, which are open-circuit fault, short -
circuit fault, resistance fault and spark gap fault.
These different tests are stored in the neural
network, which make it possible to identify the type
of fault. In addition, the Spline interpolation method
was used for each voltage range corresponding to a
specific fault type. Therefore, the detection,
identification and localization of the cable fault,
these done based on the neural network and the
Spline method.
In conclusion, the simulation results prove to
verify the high performances of these methods in
terms of detection and identification precision of
cables faults.
2 DESIGN OF A 0.1 Hz VLF
GENERATOR FOR TESTING
CABLE FAULTS
As seen previously, we have listed the different
types of HVA underground cable for fault location
tests. Subsequently, we will focus our study on a
very precise and revolutionary test, which is the
VLF test. Therefore, we will study the operation of
the VLF test device and we will try to design a new
device and improving it by mean of simulation for
verification. A very low frequency dielectric test
will check the dielectric state of a polymer cable. In
this section, we will give the operation principle of a
cosine-rectangular VLF device and propose another
device allowing to obtain the same desired
waveform at the output.
2.1 Constitution
The VLF test is featured in several applications with
slow detection time for weak spots on synthetic
cables (PE/XLPE) and paper cables (PILC) and also
excess stress in (BAUR) cables. The cosine-
rectangular VLF waveform is patented and approved
by the CEI and IEEE organizations. A VLF device
generally consists of an HVA DC test unit generator,
a storage coil, an electronic switch (rotary rectifier),
a voltmeter, a discharger switch and a support
capacitor.
Design of a Very Low Frequency Test Device for Faults Diagnosis in Underground Cable
197
2.2 Operation
The VLF test does not damage the cable structure,
however, it does cause rapid growth of electrical
treeing if they exist. Compared with other test
devices, VLF devices have lower weight and lower
power consumption along with higher test reliability.
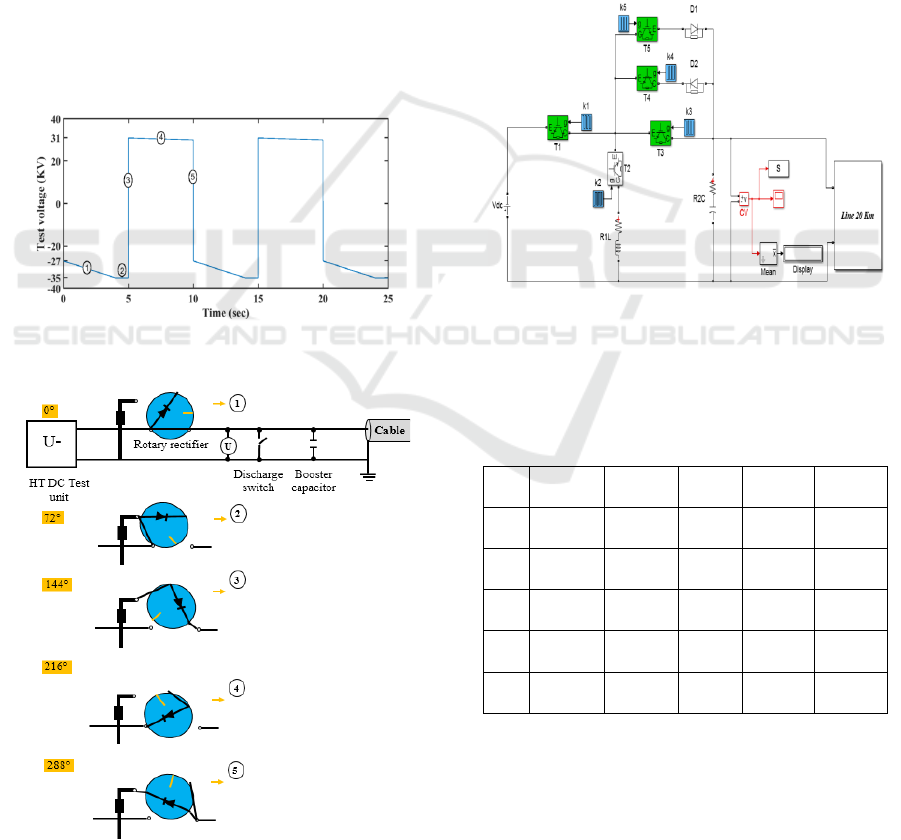
The figure 1 illustrates the voltage curve
characterizing a device of the 0.1 Hz VLF test.
The principle of operation is based on the
position of the rotary diode based rectifier and the
charging and discharging of a capacitor. We can
remark that at an operation state corresponding to an
angle multiple of 72° and a well-defined time. After
a complete turn of the device (passage of the five
stages), we can observe the waveform at the exit of
the capacitor (charge and discharge). Based on the
operating sequences, an equivalent circuit is
modelled and the operating equations are sorted for
each step sequence.
Figure 1: Voltage curve characterizing a 0.1 Hz VLF test
device.
Figure 2: Different rotating rectifier position sequences of
a VLF device.
Different rotary rectifier positions associated to
the VLF generator are shown in figure 2.
2.3 Design of a New Cable Fault Test
VLF Generator
After showing the operation principle of the classical
VLF device, we will propose another type of VLF
device made up of totally controlled components as
shown in figure 3. In this paper, we have focused
our study only on the VLF generator at 0.1 Hz. It is
to be noted that this new VLF generator is based on
IGBT's and diodes. In order to design this device, we
have chosen the following values: Vdc = 40 kV; L =
0.1 H; R1 = 0.001 Ω; C = 0.001 F; R2 = 0.1 Ω.
Figure 3: Model of the new proposed 0.1Hz VLF device.
The table 1 gives the different switching intervals
of each power device for a switching frequency
equal to 0.1 Hz.
Table 1: Power switches Control at 0.1 Hz.
time
(
s
)
[0-2] [2-5] [5-6] [6-8] [8-10]
k1 On-state On-state Off-stat
e
Off-state Off-state
k2 Off-state On-state On-state Off-state On-state
k3 On-state Off-state Off-stat
e
Off-state Off-state
k4 Off-state Off-state Off-stat
e
Off-state On-state
k5 Off-state Off-state On-state Off-state Off-state
In order to apply the proposed VLF generator to a
cable, we will choose a 20 km unipolar one
decomposed into 10 portions of 2 km with own
linear characteristics impedance. This VLF
generator is used in order to see the behaviour of the
output signal during tests on a healthy and faulty
SMARTGREENS 2021 - 10th International Conference on Smart Cities and Green ICT Systems
198
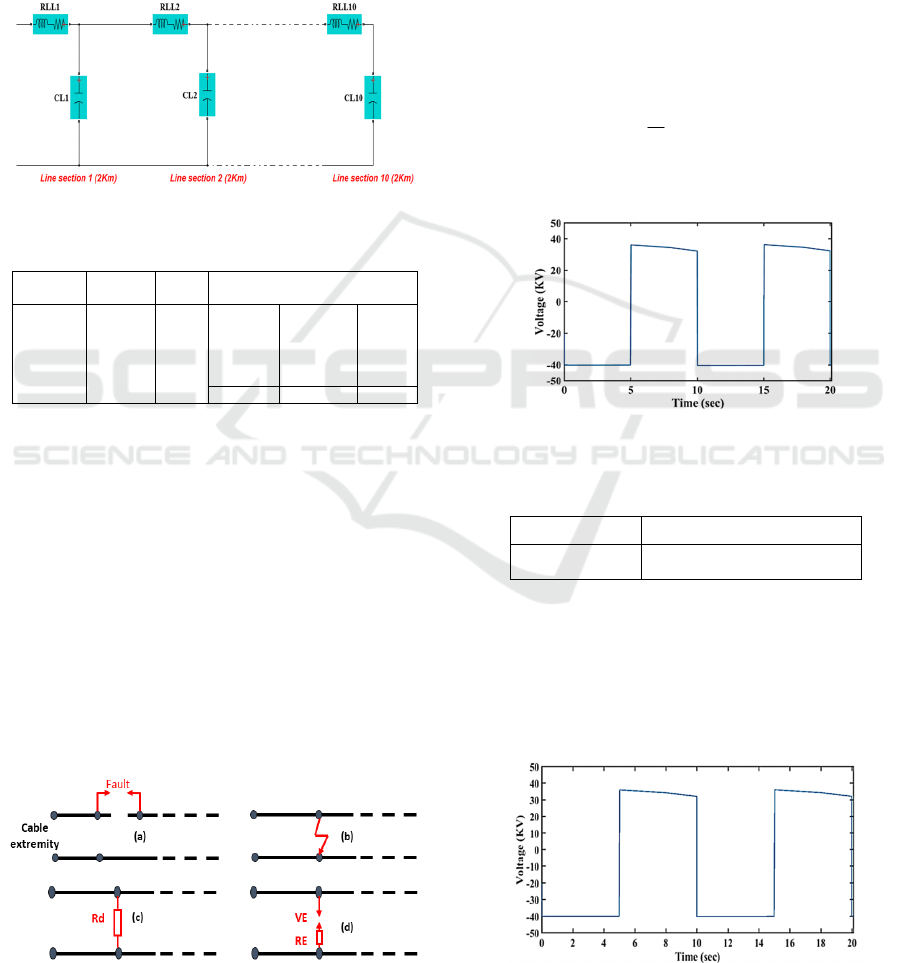
cable. The figure 4 represents the equivalent model
of a 20 km underground cable subdivided into 10
blocks of 2 km length each.
Table 2 illustrates the actual characteristics of an
underground cable from the manufacturer PIRELLI
which can withstand a voltage of 40 kV with an
aluminium conductive core with PR insulator, direct
current resistance R = 0.125 Ω/km at 20 °C, self-
induction L = 0.38 mH/km and capacitance C =
0.212 𝜇𝐹/km.
Figure 4: Model of a 20 km electric cable.
Table 2: Characteristics of an ALU-PR cable.
Builder
Voltage
(kV)
Type Impedance
PIRELLI 18/30 (36) 1*240
ALU-
PR
DC
resistance
(Ω/km)
(at 20 ° C)
Self-
induction
for external
cable
(
mH/km
)
Capacity
(μF/km)
0.125 0.38 0.212
3 SIMULATION RESULTS
As mentioned before, the most common faults
affecting underground cables are open-circuit, short-
circuit, resistance and spark gap faults as presented
in figure 5. To locate the fault of an underground
cable, we carried out tests on a cable of length 20
km. We registered the fault results for different cable
distances. Indeed, we determine for each distance
the mean voltage corresponding to it. We built a
database consisting of the different values of the
average voltages that the cable can withstand for
well-defined lengths.
Figure 5: (a) Open-circuit fault. (b) Short-circuit fault. (c)
Resistance fault and (d) Spark gap fault.
Moreover, we then applied the cubic spline
interpolation method (Schumaker, 2007) according
to the values of the obtained faults. The investigation
phase of the interpolation method consists in being
able to determine the exact location of the failure on
the cable by measuring the voltage value at its input.
This procedure will be applied in the different
simulations of the cable faults.
In the healthy case of the cable, we applied the
signal from the VLF at 0.1 Hz generator to a healthy
cable of 20 km long. Figure 6 shows the waveform
of the voltage at the input of the cable.
The average value of the voltage in the healthy or
faulty case is determined by the following
expression:
0
1
()
T
moy
VVtdt
T
(1)
Furthermore, table 3 illustrates the voltage
average value of a cable with 20 km long.
Figure 6: Waveform of the voltage terminals across a
healthy cable at 0.1 Hz.
Table 3: Simulation results on a healthy cable.
Cable length Voltage average value (V)
20 km -2947.86 V
3.1 Open-circuit Fault
In simulation, we are going to use a breaker in order
to apply the cable open-circuit fault. For a fault
located at a distance equal to 2 km, we obtain the
voltage signal shown in figure 7.
Figure 7: Voltage signal due to the opening of a 2 km line
portion.
Design of a Very Low Frequency Test Device for Faults Diagnosis in Underground Cable
199
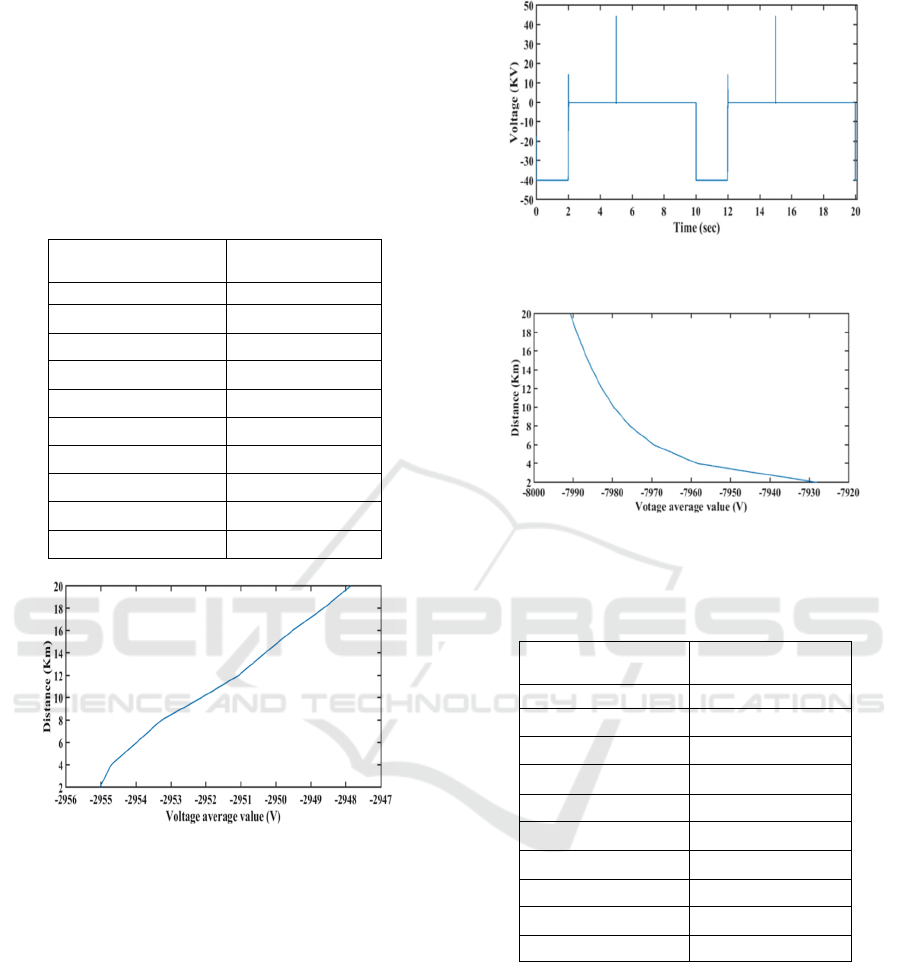
The table 4 shows the different average values of
each cable section with an open-circuit fault.
In order to determine the intermediate points, we
applied the Spline method. Thus, we brought out the
interpolation of the voltage curve corresponding to
the open-circuit of a cable portion, as shown in
figure 8.
Table 4: Simulation results due to an open-circuit fault in a
cable portion.
Cable portion Cutout
location (km)
Voltage average
value (V)
2 -2955.02
4 -2954.71
6 -2953.98
8 -2953.27
10 -2952.13
12 -2951.06
14 -2950.31
16 -2949.52
18 -2948.64
20 -2947.86
Figure 8: Interpolation curve of the opening fault of a 20
km cable.
3.2 Short-circuit Fault
The short circuit fault is achieved by applying a
signal equal to ‘1’ to the breaker, which is connected
in parallel with the rest of the cable. For a fault in 20
km cable length, the voltage signal is obtained as
shown in the figure 9.
Table 5 shows the different voltage average
values for each cable portion with a short-circuit
fault. In order to determine the intermediate points
of this fault type, we applied the Spline method.
Thus, we brought out the interpolation curve of the
short-circuit fault of cable, as shown in the figure 10.
Figure 9: Voltage signal for a short-circuit fault appearing
at the end of 20 km cable length.
Figure 10: Interpolation curve of the short-circuit fault of a
20 km cable.
Table 5: Simulation results of voltage signal with a short-
circuit fault in a cable portion.
Cable short circuit
location (km)
Voltage average
value (V)
2 -7927.95
4 -7958.36
6 -7969.45
8 -7975.53
10 -7979.60
12 -7982.65
14 -7985.1159
16 -7987.2172
18 -7989.0752
20 -7990.7630
3.3 Resistance Fault
The resistance fault in a cable is ensured by using a
priming resistance Rd = 100 Ω. For a fault located at
a distance of 2 km, the output voltage signal is
obtained as shown in the figure 11.
SMARTGREENS 2021 - 10th International Conference on Smart Cities and Green ICT Systems
200
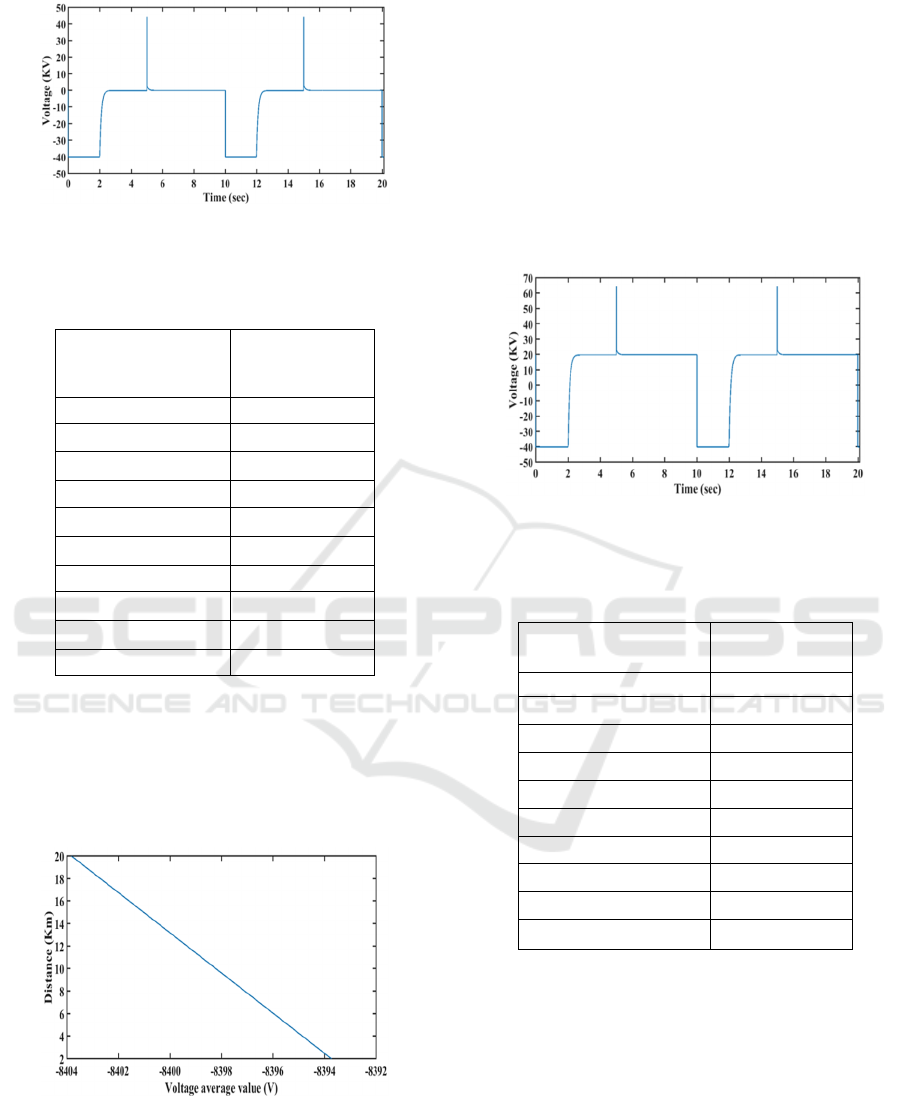
Figure 11: Voltage Signal due to a resistance fault
between portion 1 and 2 of a 20 km cable.
Table 6: Simulation results on a cable with resistance fault
of a section.
Cable Portion
Resistance fault
location (km)
Voltage average
value (V)
2 -8393.72
4 -8394.84
6 -8395.96
8 -8397.08
10 -8398.20
12 -8399.32
14 -8400.45
16 -8401.57
18 -8402.69
20 -8403.81
The table 6 shows the different average values for
each section with a resistance fault.
In order to determine the intermediate points, we
applied the Spline method. Thus, we brought out the
interpolation curve of the resistance fault of a cable
section, as shown in the figure 12.
Figure 12: Interpolation curve due to a resistance fault of a
20 km section.
3.4 Spark Gap Fault
We will apply a voltage signal for the cable spark
gap fault at the distance 20 km with a priming
resistance RE = 100 Ω and a priming voltage VE =
20 kV. For a spark gap fault located at a distance of
20 km, the output voltage signal is obtained as
shown in figure 13.
Table 7 shows the voltage average values of each
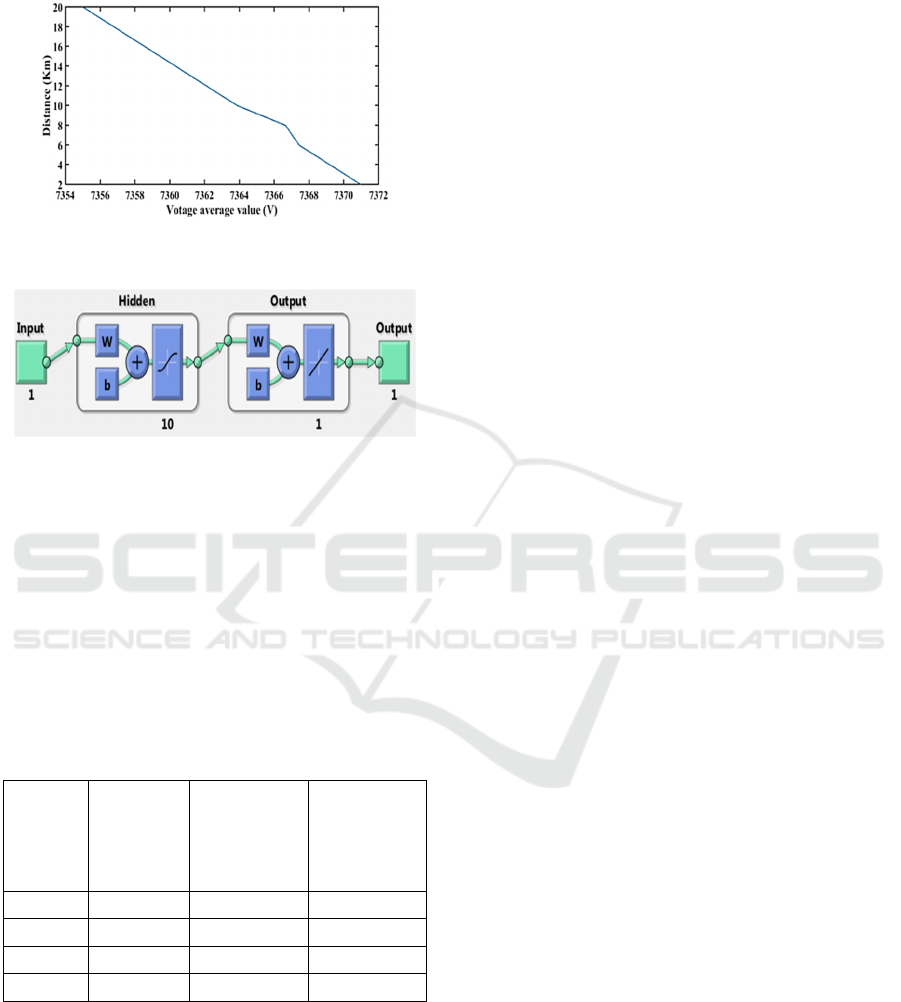
section with spark gap fault. Then, in order to locate
the fault more precisely, we applied the Spline
method. Thus, we brought out the interpolation
voltage curve corresponding to the spark gap fault of
a cable portion as shown in figure 14.
Figure 13: Signal of a spark gap fault at the end of 20 km
cable.
Table 7: Simulation results on a spark gap fault of a cable
section.
Cable Portion spark
gap fault position (km)
Voltage average
value (V)
2 7370.98
4 7369.20
6 7367.43
8 7366.66
10 7363.88
12 7362.11
14 7360.33
16 7358.56
18 7356.79
20 7355.01
3.5 Identification and Localization of
Fault
In order to identify and locate the different faults, we
will pursue the following steps:
Build databases for the different fault types;
Applies the Artificial Neural Network ANN (A.
Maheshwari et al., 2018) to determine the type of
fault. This is done by determining for each fault the
range of variation of the average voltage. In the
ANN technique, the output indices 1, 2, 3 and 4 can
be assigned for open-circuit fault, short-circuit fault,
Design of a Very Low Frequency Test Device for Faults Diagnosis in Underground Cable
201
resistance fault and spark gap fault. The ANN model
is shown in the figure 15.
Figure 14: Interpolation curve of the spark gap fault at the
end of 20 Km cable.
Figure 15: ANN model.
To test the performance and effectiveness of these
used methods, a test was performed for a four
random values of average voltage. The identification
technique gives the results shown in table 8. From
the identified defaults locations this table shows the
exact values of the voltages from the direct tests on
the cable and by using the used VLF generator. The
comparison between these voltages values proves
the high performance and efficiency of the proposed
method.
Table 8: Identification and localization of studied faults.
Voltage
average
value (V)
Fault
identification
Default
Localization
(km)
(from Neural
Network and
Spline)
Exact average
voltage (V)
corresponding
to the
identified
localization
-2950
Open-circuit 14.8293 -2950.6853
-7970
Short-circuit 6.1458 -7970.0029
-8400
Resistance 13.1980 -8400.1066
7365
Spark gap 9.6556 +7365.5748
4 CONCLUSION
An energy transmission network, even underground,
is exposed to electrical incidents causing the
shutdown of the electricity supply. Improving the
quality of service is essentially depending on the
speed and precision with which a fault is located. To
do this, we studied the VLF device to detect and
identify High Voltage of type A underground cable
faults. In this paper, the VLF method is investigated
since it has a wider detection range and less
aggressive for underground cables.
Subsequently, we gave a new electronic version
of the VLF device based on the operating steps of
power switches. Thus, we have modelled an
underground cable with real parameters, in order to
simulate the different types of faults most frequently
observed. A database by performing faults for
different distances and for each type of fault is
performed using the neural network. In order to
detect precisely these different types of faults, we
have proposed the Spline interpolation method.
Simulations were done using
MATLAB/Simulink. As conclusion, the results
obtained are very interesting and promising in terms
of detection, identification and localization of
distinct fault type in underground cables.
ACKNOWLEDGEMENTS
The authors extend their appreciation to the
Deputyship for Research & Innovation, Ministry of
Education in Saudi Arabia for funding this research
work through the project number 1212.
REFERENCES
A. Maheshwari, V. Agarwal, and S. K. Sharma.
"Transmission line fault classification using artificial
neural network based fault classifier," Int. J. Electr.
Eng. Technol.(IJEET), vol. 9, pp. 170-181, 2018.
B.V. Wong, Y. Tian, and T. Neier. “Practical experience
using VLF Tan Delta and partial discharge
measurement in medium voltage cable,” In 2016
China International Conference on Electricity
Distribution (CICED), pp. 1-5. IEEE, 2016.
C. Xie, Y. Wang, X. Shao, and Y. Jin. “The Application
Research of Very Low Frequency Diagnostic Methods
in Acceptance Tests on New Cable Systems of
Medium Voltage,” In 2018 China International
Conference on Electricity Distribution (CICED), pp.
47-53. IEEE, 2018.
H. KUZYK, “Défauts dans les câbles de transmission
d’énergie,” Technique de l’ingénieur, Reference :
D4541 V2, 2006.
H. KUZYK, “Diagnostic de câble,” Technique de
l’ingénieur, Reference : D4541 V2, 2006.
H. KUZYK, “Les types de câbles souterrains,” Technique
de l’ingénieur, Reference: D4541 V2, 2006.
SMARTGREENS 2021 - 10th International Conference on Smart Cities and Green ICT Systems
202

H. Oetjen, “Principals and field experience with the 0.1 Hz
VLF method regarding the test of medium voltage
distribution cables”, Conference Record of the 2004
IEEE International Symposium on Electrical
Insulation, pp. 376-379. IEEE, 2004.
L. Schumaker, “Spline functions: basic theory,”
Cambridge University Press, 2007.
M. A. Zdiri, B. Bouzidi and H. Hadj Abdallah,
“Performance investigation of an improved diagnostic
method for open IGBT faults in VSI fed IM drives,” In
Diagnosis, Fault Detection & Tolerant Control,
Springer, Singapore, pp. 155-171, 2020.
M. Baur, “Test des câbles, Nouvelles méthodes dans la
maintenance des câbles à hautes tension avec mesure
et diagnostic,” Baur Prif-Und Mess Technik GmbHA
6832 Sulz/Austria, 2008.
M. Pays, “Câbles de transport d’énergie - Technologies.
Caractéristiques,” Reference: D4520, 1994.
M.A. Zdiri, B. Bouzidi, and H. Hadj Abdallah,
“Performance investigation of an advanced diagnostic
method for SSTPI-fed IM drives under single and
multiple open IGBT faults,” COMPEL International
Journal of Computations and Mathematics in
Electrical and electronic engineering, vol. 38, no. 2,
pp. 616-641, 2019.
M.A. Zdiri, B. Bouzidi, and H. Hadj Abdallah, “Synthesis
of an improved diagnosis method for open IGBT
faults dedicated to FSTPI fed IM drives,” Journal of
Electrical Systems, vol. 15, no. 2, pp. 314-330, 2019.
Norme, DIN VDE 0276-1001, 1995.
S. Seesanga, W. Kongnun, A. Sangswang, and S. Chotigo.
“A new type of the VLF high voltage generator,”
In 2008 5th International Conf. on Electrical
Engineering/Electronics, Computer, Telecommunica-
tions and Information Technology, vol. 2, pp. 929-932.
IEEE, 2008.
X. Tan, J. Chen, C. Li, L. Hu, J. Cao, and X. Zeng. “A
New Type of VLF Sinusoidal Waveform Generator
Used for AC Withstand Voltage Testing of Power
Cables,” In 2019 IEEE Asia Power and Energy
Engineering Conference (APEEC), pp. 10-13. IEEE,
2019.
Design of a Very Low Frequency Test Device for Faults Diagnosis in Underground Cable
203
