
Population Mobility Patterns and Monitoring of COVID-19
Restriction Measures in Latvia
Irina Arhipova
1a
, Gundars Berzins
2
, Aldis Erglis
2
, Evija Ansonska
2
and Juris Binde
3
1
Latvia University of Life Sciences and Technologies, Liela iela 2, Jelgava, LV-3001, Latvia
2
University of Latvia, Aspazijas bulvaris 5, Riga, LV-1050, Latvia
3
Latvian Mobile Telephone, Ropazu iela 6, Riga, LV-1039, Latvia
Keywords: Mobile Data, Population Behaviour, Human Activity.
Abstract: Compared to the spring, when the Covid-19 pandemic started and people honestly followed the precautionary
measures, the behavior of the Latvian population has changed significantly. The majority of Latvians do not
exercise caution, and their activity has returned to pre-Covid-19 levels this autumn, negatively affecting the
epidemiological situation in the country, according to an analysis of population behavior. Within the research,
the epidemiological statistics of Center for Disease Prevention and Control and Latvian Mobile Telephone
(LMT) mobile network events were analyzed to determine the relationship between population activity and
epidemiological situation in Latvia as a whole, as well as in each region. According to the performed analysis,
it is possible to divide Latvia into two parts - municipalities that were active during the emergency situation
and places where the greatest activity is observed before and after the emergency situation. It was concluded
that mobile call activity during emergencies in both cities and counties is still high, it is 70% - 80% of the
precrisis period. Since the spring, people's behavior and habits have changed significantly, so a different
approach is needed.
1 INTRODUCTION
Compared with the spring when the Covid-19
pandemic started and people conscientiously
followed the precautionary measures, the behaviour
of the Latvian population has changed significantly.
Analysis of population behaviour suggests that during
the second wave of the pandemic at the end of 2020,
the majority of Latvians do not exercise caution, and
their activity has returned to pre-Covid-19 levels,
negatively affecting the epidemiological situation in
the country.
Already in the spring, when analysis of mobile
data before and after the declaration of the emergency
was performed (Arhipova, et al, 2019; Arhipova, et
al, 2020), we found that most people followed the
instructions to stay at home and it paid off – Latvia
was globally recognized as a positive example of
fighting the Covid-19 pandemic. This is probably one
of the main reasons why we were able to enjoy
summer holidays without restrictions. The autumn
season started as usual – with increasing activity of
a
https://orcid.org/0000-0003-1036-2024
the population. Unfortunately, the number of
Covid-19 patients also increased.
The same problem was mentioned in another
study (Ghanbari, 2020) suggesting that non-
compliance with the intruduced restrictions
contributed to the emergence of the second wave of
the pandemic. The analysis of the spread of
COVID-19 in ten biggest cities in the USA also
shows that the population’s inability to reduce their
mobility resulted in high risk of infection in their
respective locations and a model for detailed analysis
for reducing the COVID-19 risk is developed (Chang,
et al, 2020). Another study shows that the increase of
confirmed cases of COVID-19 in some countries is
critical and a new policy is needed to limit the spread
of the virus (Mahmoudi, et al, 2020).
In the case of four countries, the problem of
disease prediction in circumstances of incomplete or
nonexistent information is considered and analysed
using a fractal approach (Păcurar & Necula, 2020).
Different strategies for reducing the spread of the
virus have analysed various restrictive measures like
98
Arhipova, I., Berzins, G., Erglis, A., Ansonska, E. and Binde, J.
Population Mobility Patterns and Monitoring of COVID-19 Restriction Measures in Latvia.
DOI: 10.5220/0010467600980102
In Proceedings of the 3rd International Conference on Finance, Economics, Management and IT Business (FEMIB 2021), pages 98-102
ISBN: 978-989-758-507-4
Copyright
c
2021 by SCITEPRESS – Science and Technology Publications, Lda. All rights reserved

social distancing and local lockdowns and their
effectiveness in reducing the consequences of social
isolation (Block, et al, 2020). In the framework of the
research, the epidemiological statistics of Center for
Disease Prevention and Control (SPKC, 2020) and
Latvian Mobile Telephone (LMT) mobile network
events were analysed to determine the relationship
between population activity and epidemiological
situation in Latvia as a whole, as well as specifically
in various regions.
The purpose of the research is to assess the impact
of various national and local restrictions on the control
of Covid-19. The study has developed an approach to
the processing of automated real-time data, which
allows to take proactive actions and timely
implementnecessary measures by the responsible
authorities to control the spread of the virus.
The developed approach fully complies with the
requirements of the General Data Protection
Regulation (GDPR), at the same time allowing for an
accurate assessment of population behaviour, such as
the location, movement, and time of a specific activity.
2 POPULATION BEHAVIOUR ON
SOCIO-ECONOMIC OBJECT
LEVEL
The study analyses the aggregate statistics of LMT
mobile network events in the period from
October 2019 to December 2020, where network
event data were aggregated by mobile network
stations on a daily basis. It allows to use data on
different aggregation levels, for example, an
administrative region, city, town, or on a specific
socio-economic infrastructure level like a
supermarket.
Analysing the behaviour patterns of mobile
activity over a year, from October 2019 to December
2020, allows us to recognize the most effective
behavioural patterns of people responding to the
implemented restrictions and warnings. It can be
observed that the activity of the population at Riga's
largest shopping centres in the autumn of 2020 has
almost reached the level of 2019 in the respective
period, unfortunately contributing to the spread of the
disease and increasing the risk of Covid-19 for almost
everyone (Fig. 1). Therefore, considering the good
practices of several shopping centres and their
ambitious efforts to introduce e-services, the society
ought to rethink its “pre-pandemic” habits and
increasingly
use the opportunities to shop in the
digital environment offered by retailers.
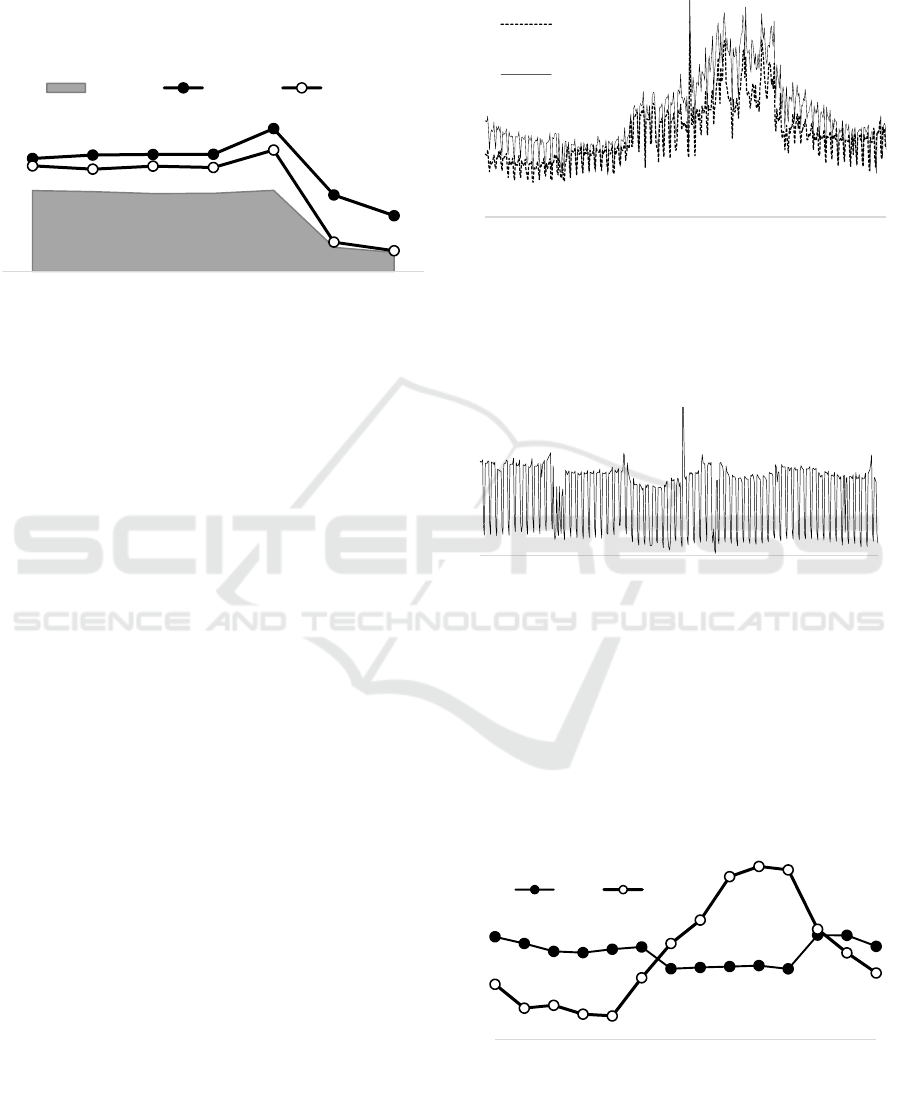
Figure 1: “Galeria Centrs” shopping centre average mobile
phone day activity in Riga.
Figure 2 shows the mobile data activity pattern at
one of Riga’s supermarkets, Spice, which
immediately and with great effect reacted to the
restrictions in March - April 2020. The same pattern
was observed at other socio-economic objects like
theatres, museums, and corporate offices.
average mobile phone activity during the 1
st
period from
25/11/2019 to 08/12/2019
average mobile phone activity during the 2
nd
period from
23/03/2020 to 05/04/2020
average mobile phone activity during the 3
rd
period from
23/11/2020 to 06/12/2020
Figure 2: Mobile data activity pattern at Riga’s
supermarket, Spice.
Therefore, to monitor the effectiveness of the
government decisions, restrictions and warnings,
three two-week periods in the spring were used as a
reference for behaviour patterns to understand the
change of behaviour in October - November 2020.
Two full weeks were selected in the following
periods: 1
st
period from 25/11/2019 to 08/12/2019
(corresponding period for the 3
rd
period), then 2
nd
period from 23/03/2020 to 05/04/2020 (the highest
discipline point in complying with the restrictions)
and 3
rd
period from 23/11/2020 to 06/12/2020 (after
restrictions of the 2
nd
wave).
When comparing the behaviour patterns between
the 3
rd
and the 2
nd
period, it was expected that mobile
activity would drop to the level or near to the level of
Oct-19
Nov-19
Dec-19
Jan-20
Feb-20
Mar-20
Apr-20
May-20
Jun-20
Jul-20
Aug-20
Sep-20
Oct-20
Nov-20
Dec-20
10/1/2019
11/1/2019
12/1/2019
1/1/2020
2/1/2020
3/1/2020
4/1/2020
5/1/2020
6/1/2020
7/1/2020
8/1/2020
9/1/2020
10/1/2020
11/1/2020
12/1/2020
Population Mobility Patterns and Monitoring of COVID-19 Restriction Measures in Latvia
99
the 2
nd
period. Instead, it remained on relatively high
level – similar to the level of same period last year
(1
st
period). The differences in mobile activity
between the periods are even more visible when
comparing the activity on weekdays for the periods
(Fig. 3).
Figure 3: Mobile phone activity in the shopping centre,
Spice, during weekdays.
The overall activity for the 3
rd
period is higher by
35 per cent on working days and by 16 per cent on
weekends compared with the same weekdays in the
2
nd
period (spring lockdown). Due to specific
restrictions effective on weekends, the activity on
Saturdays and Sundays almost reaches the level of
March - April 2020, but is higher on Fridays.
Therefore, on micro (socio-economic object) level,
the strategy of restriction implementation was more
effective in the spring than in October - November
2020.
3 COMPARISON OF THE
POPULATION MOBILITY IN
MUNICIPALITIES BEFORE
AND AFTER LOCKDOWN
According to the performed analysis, it is possible to
divide Latvia into two parts – regions that were active
during the emergency situation (Fig. 4.) and areas
where the greatest activity was observed before and
after the emergency situation (Fig. 5).
When comparing the situation in the capital city
Riga with Engure and Saulkrasti regions, significant
changes can be observed in the activity of the
population. On 24 March 2020 (Tuesday) when the
state of emergency was already in force in Latvia, the
mobile call activity in Riga had decreased, returning
to the previous level in September (Fig. 5), whereas
in Engure and Saulkrasti municipalities, the
population activity significantly increased after
March and decreased in September (Fig. 4).
Figure 4: In Engure and Saulkrasti municipalities, mobile
phone activities were higher during the emergency situation
declared in March 2020.
Figure 5: The city of Riga mobile phone activity before and
after the emergency situation declared in March 2020.
Latvia’s 119 municipalities were grouped
according to the data of mobile phone activity and the
Principal Component Analysis (PCA) was applied to
evaluate mobility patterns. The first two principal
components account for 46.6 % and 42.5 %
respectively of the total variation. (Fig. 6).
Figure 6: Principal components average values depending
on months in 2019 - 2020.
Monday
Tuesday
Wednesday
Thursday
Friday
Saturday
Sunday
Mar-20 Nov-19 Nov-20
10/1/2019
11/1/2019
12/1/2019
1/1/2020
2/1/2020
3/1/2020
4/1/2020
5/1/2020
6/1/2020
7/1/2020
8/1/2020
9/1/2020
10/1/2020
11/1/2020
12/1/2020
Engure
municipality
Saulkrasti
municipality
10/1/2019
11/1/2019
12/1/2019
1/1/2020
2/1/2020
3/1/2020
4/1/2020
5/1/2020
6/1/2020
7/1/2020
8/1/2020
9/1/2020
10/1/2020
11/1/2020
12/1/2020
10.2019.
11.2019.
12.2019.
01.2020.
02.2020.
03.2020.
04.2020.
05.2020.
06.2020.
07.2020.
08.2020.
09.2020.
10.2020.
11.2020.
PC1 PC2
FEMIB 2021 - 3rd International Conference on Finance, Economics, Management and IT Business
100
The first principal component (PC) represents all
municipalities with high mobile call activity until
February 2020, low from March to August, and high
from September to December 2020. The second PC
represents other municipalities with high mobile
activity patterns active during the lockdown time.
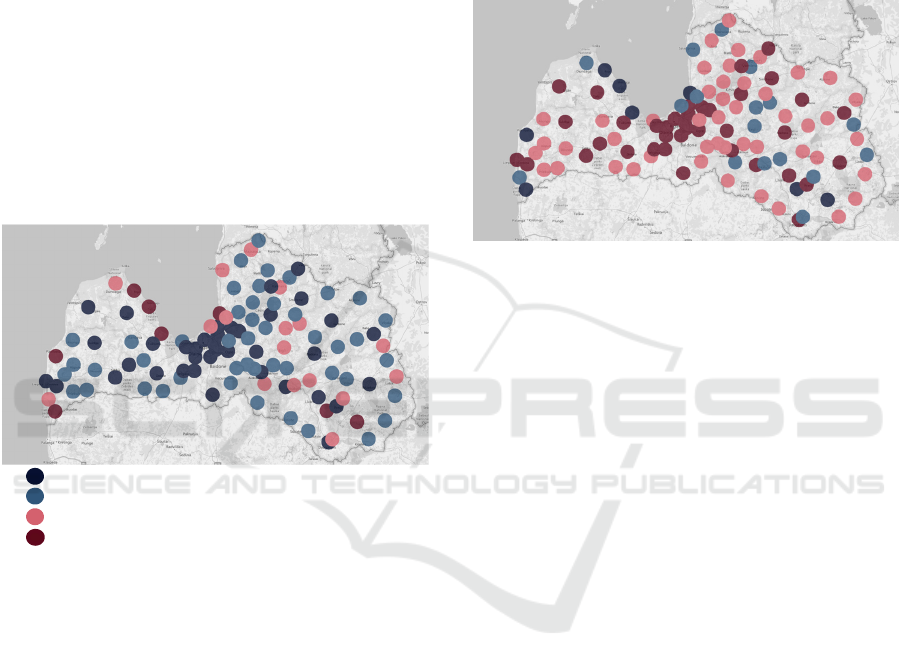
4 POPULATION FLOW
MOBILITY ANALYSIS
Analysis of the information from mobile base stations
helps identify the behavioural changes of the
population from the beginning of lockdown, and
monitor them later. The map shows the mobile phone
activity on municipal level, with areas where the
mobile activity is concentrated before lockdown
(Fig. 7) and during lockdown (Fig. 8).
high mobile phone activity;
moderately high mobile phone activity;
moderately low mobile phone activity;
low mobile phone activity.
Figure 7: Mobile phone activity in Latvia municipalities
before lockdown in January – March, 2020.
Before lockdown, normal business activity and,
respectively, mobile phone activity is concentrated in
the main areas of the economic activity like Riga city
(in the centre of the map) and other larger cities.
People from the neighbouring municipalities daily
commute to Riga for work.
Following the introduction of lockdown in
March 2020, people switched to remote work, and
many employers provided the possibility to work
from home. This affected the daily commuting
patterns of people – the activity moved from large
economic cantres to municipalities where people
reside diminishing the need for daily commuting
between different municipalities (Fig. 8).
Consequently, all mobile phone activity moved
from city centres and business districts to residential
areas. The changes in daily commuting patterns can
be directly linked to the diminishing numbers of new
Covid-19 cases in the respective period. In Latvia,
commuting between municipalities is an important
part of the economic activity pattern, especially for
Riga city and its surrounding territories in the range
of 100 km. Analysis of mobile phone activity allows
monitoring daily commuting patterns related to on-
site work and remote work. The maps (Fig. 7 and
Fig. 8) show how population density in economically
active areas is changing over time.
Figure 8: Mobile phone activity in Latvia municipalities
during lockdown in March – June, 2020.
The data confirm that there is a direct link
between the economic activity of the population and
the prevalence of Covid-19, namely, the more active
the population is, the higher the number of Covid-19
patients. The increase in the economic activity with a
lag of about one month is reflected in the current
Covid-19 statistics – the number of Covid-19 patients
is growing rapidly.
Human contact is the major risk factor for the
spread of Covid-19. The more physical contact there
is among people, the greater the risk that neither
social distancing nor facial masks and hand hygiene
would help, as these principles are not always
followed. It would be important to work remotely,
reduce the movement of people, and avoid public
gatherings and crowded places like sports, cultural,
and entertainment events, as well as to optimise
shopping for a certain period of time.
These research results show that a segment of the
Latvian population has not yet understood the
severity of the situation and continues to behave as in
the summer when the spread of the virus was
insignificant. It will be possible to control the
pandemic only when the majority of the population
follows the principles of social and physical
distancing. Currently, the most effective way to
reduce the spread of the virus is to practice social
distancing and stay at home – to study and to work
remotely.
Population Mobility Patterns and Monitoring of COVID-19 Restriction Measures in Latvia
101

5 CONCLUSIONS
Mobile phone activity during the spring and autumn
emergencies still has been high in both cities and
country, reaching 70 % to 80 %of the pre-crisis
period. Since the spring, the behaviour and habits of
the population have changed significantly, so a
different approach is needed.
Residents' shopping habits have changed
significantly – on weekends, the number of visitors in
shopping centres has dropped significantly as people
choose to shop on weekdays instead. Human activity
at household goods stores has remained high since
spring.
People's activity decreases on weekends, while
activity on weekdays even increases slightly. At
present, introducing the same restrictions as in the
spring has failed to achieve an equivalent behavioural
change and the level of discipline.
Restrictions on weekends have increased
shopping activity on weekdays, where activity was
already much higher than on weekends. Authorities
ought to examine the possibility of applying
restrictions to all days of the week, not just holidays,
to compensate for the uneven workload of the
shopping infrastructure.
Restrictions that balance the day-to-day shopping
load should be considered to limit the number of
people who visit the store at the same time, creating
peak visits.
It is necessary to create and communicate positive
alternatives to spending weekends and holidays in
shopping centres, because restrictions alone do not
achieve the desired effect and provoke negative
reactions.
ACKNOWLEDGEMENTS
This work was supported by the University of Latvia
and LMT Ltd. [grant number 7-3/151/2].
REFERENCES
Arhipova, I., Berzins, G., Brekis, E., Opmanis, M.,
Binde, J., Steinbuka, I., Kravcova, J., 2019. Pattern
Identification by Factor Analysis for Regions with
Similar Economic Activity Based on Mobile
Communication Data. Advances in Intelligent Systems
and Computing, 886, pp.561–569.
Arhipova, I., Berzins, G., Brekis, E., Binde, J.,
Opmanis, M., Erglis, A., Ansonska, E., 2020. Mobile
phone data statistics as a dynamic proxy indicator in
assessing regional economic activity and human
commuting patterns. Expert Systems, 37(50), e12530.
Block, P., Hoffman, M., Raabe, I.J., Dowd, J. B., Rahal, C.,
Kashyap, R., 2020. Social network-based distancing
strategies to flatten the COVID-19 curve in a post-
lockdown world. Nature Human Behaviour, 4, pp.588–
596.
Chang, S., Pierson, E., Koh, P.W., Gerardin, J., Redbird, B.,
Grusky, D., Leskovec, J., 2020. Mobility network
models of COVID-19 explain inequities and inform
reopening. Nature (2020).
Ghanbari, B., 2020. On forecasting the spread of the
COVID-19 in Iran: The second wave, Chaos, Solitons
& Fractals, 140, 110176.
Mahmoudi, M. R., Baleanu, D., Mansor, Z., Tuan, B. A.,
Pho, K.-H., 2020. Fuzzy clustering method to compare
the spread rate of Covid-19 in the high risks countries.
Chaos, Solitons & Fractals, 140, 110230.
Păcurar, C.-M., Necula, B.-R., 2020. An analysis of
COVID-19 spread based on fractal interpolation and
fractal dimension, Chaos, Solitons & Fractals, 139,
110073.
SPKC. Center for Disease Prevention and Control in Latvia,
https://www.spkc.gov.lv/lv
FEMIB 2021 - 3rd International Conference on Finance, Economics, Management and IT Business
102
