
Derivation of Urban Planning Indicators (UPIs) using Worldview-3
Imagery and GEOBIA Method for Split Settlement, Croatia
Rina Milošević
a
, Silvija Šiljeg
b
and Ivan Marić
c
University of Zadar, Department of Geography, Trg kneza Višeslava 9, 23 000 Zadar, Croatia
Keywords: Urban Planning Indicators (UPIs), Worldview-3 (WV3), GEOBIA, Split.
Abstract: In most urban environments, loss of natural vegetation, the reduction of open spaces, and the rapid invasive
transformation of the natural environment into impervious has happened. These changes can lead to a decline
in life quality and in an increase of various economic, social, ecological, and infrastructural problems and
risks. The complexity of the urban environment at various scales requires the application of high spatial and
temporal resolution data in the process of urban planning. In this paper, specific urban planning indicators
(UPIs), divided into two groups, have been derived for statistical circles (SC) of Split settlement in Croatia.
Vegetation indicators (TCR - tree cover ratio, LCR - lawn cover ratio, GCR - green cover ratio) and
indicators of urbanization (SCR - street cover ratio, BCR - building cover ratio, IMR - impervious surface
ratio) were derived from the derived land cover model. It was generated from WorldView-3 (WV3) imagery
with the GEOBIA method. A supervised machine learning technique support vector machine (SVM) was
used. A significant spatial variability between UPIs at SCs was observed. The UPIs values at the studied level
are the reflection of the historical spatial-functional development of the Split settlement. These type of UPIs
can be used at the neighborhood level of urban planning and analysis of different issues in an urban
environment.
1 INTRODUCTION
Urbanization is one of the most striking features of
our history, especially since the industrial era. It is
characterized by constant, rapid growth. Based on the
UN-projections by the year 2050, more than 80% of
the world population will live in urban areas. In
European countries, the level of urbanization is
around 74% (Duffin, 2019).
Urbanization has led to the replacement of natural
vegetation-dominated surfaces by various impervious
materials. This had a significant impact on the
environment. Some of the observed consequences are
reduction of the open spaces (Liu, 2009), increased risk
of pluvial floods (Du et al., 2015), endangerment of the
drinking water quality (Wang et al, 2020), the
appearance of the urban heat islands (UHI) (Petralli et
al., 2014), various environmental pollution problems
(Sleavin et al., 2000) and ultimately a decline in life
quality (Sinha, 2019). Therefore, efficient urban
planning has become a central tool of governance,
a
https://orcid.org/0000-0002-5473-2579
b
https://orcid.org/0000-0002-2302-7738
c
https://orcid.org/0000-0002-9723-6778
through which these major issues of urban
development will have to be addressed (Watson, 2009,
pp.3). This challenge requires new analytic approaches
and new sources of data and information (Miller and
Small, 2003) in urban planning.
There are numerous definitions of urban planning
(Hall, 2002; Davidson 1996; Anguluri, and
Narayanan, 2017). It is regarded as a complex,
technical, and political process that includes land use
control, urban environment design, and
environmental protection. Its primary purpose is to
improve the decision-making process (Levy, 2016).
In the context of urban planning, there is a notion of
the urban environment (Sénécal, 2007, Blaschke et al.
2011) which is defined as a physical place that
includes different land use patterns, built
infrastructure, and transportation system (Brownson
et al., 2009; Gong et al., 2016). The increasing
availability of geospatial data in combination with
traditional data sources could facilitate the
development of new tools in understanding urban
Miloševi
´
c, R., Šiljeg, S. and Mari
´
c, I.
Derivation of Urban Planning Indicators (UPIs) using Worldview-3 Imagery and GEOBIA Method for Split Settlement, Croatia.
DOI: 10.5220/0010465102670273
In Proceedings of the 7th International Conference on Geographical Information Systems Theory, Applications and Management (GISTAM 2021), pages 267-273
ISBN: 978-989-758-503-6
Copyright
c
2021 by SCITEPRESS – Science and Technology Publications, Lda. All rights reserved
267
environment complexity (Blaschke et al. 2011).
Urban environment planning requires a
multidisciplinary approach and the application of
modern research methods (Abbate et al. 2003,
Blaschke et al., 2011, Tenedório et al., 2016) through
the application of various geospatial technologies
(GST) (Herold et al., 2003, Lo, 2007; Bodzin, 2009,
Blaschke et al. 2011). GST is defined as a set of
methods, techniques, and procedures used in
modeling of complex processes and features in
different levels of detail (LoD) depending on the
research purpose (Marić, et al., 2019). GST includes
GIS, elements of remote sensing (RS), a global
positioning system (GPS), and other related
geospatial technologies (Dibiase et al., 2006, LeGates
et al., 2009). The application of various GST enables
the derivation of various urban planning indicators
(UPIs) (Zhao et al., 2011, Rosales, 2011, Petralli et
al., 2014, Chrysoulakis et al., 2014, Chatzipoulka et
al., 2016) which serves decision-makers, with
measuring performance role, in the planning of urban
environment (Zhao et al., 2011). The UPIs are usually
determined at the very beginning of planning and
serve as a basis for the entire planning and process
design. UPIs are crucial in the monitoring of urban
morphology and urban development intensity. They
are derived for different purposes, among which
stands out research about urban thermal islands (Zhao
et al., 2011, Lin et al., 2017), the building of
sustainable cities, and sustainable urban development
(Rosales, 2011, Shen et al., 2011, La Rosa, 2014,
Chrysoulakis et al., 2014), and achieving sustainable
urban governance (Chrysoulakis et al., 2014). The
LoD and spatial resolution of data used to derived
specific UPIs depends on the level (eg. local,
neighborhoods, metropolitan, regions) (Bryant, 2006)
or scale (macro - micro) (Elshater, 2017) at which the
urban planning process is performed. In this research,
we use high-resolution WorldView-3 imagery to
derive specific UPIs for the city of Split, Croatia. The
research was performed within the INTERREG Italy-
Croatia PEPSEA (Protecting the Enclosed Parts of
the Sea in Adriatic from pollution) project. UPIs were
calculated from a land cover model which was
derived using geographic object-based image
analysis (GEOBIA) (Hay and Castilla, 2008).
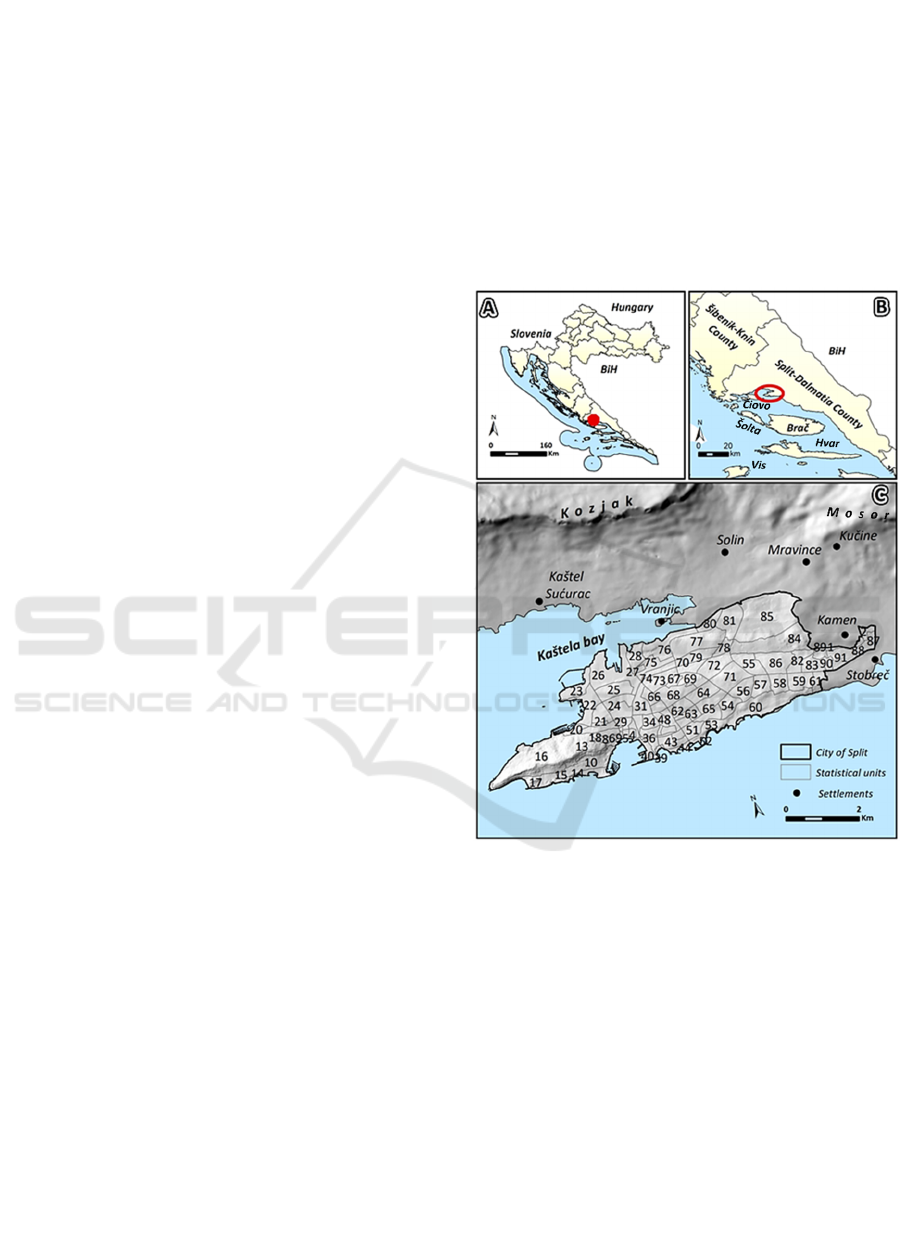
2 STUDY AREA
Split is the administrative center of Split-Dalmatia
County. It is the largest city in the Dalmatia region
and the second-largest city in the Republic of Croatia
(HR) (Fig. 1B). At the latest census (2011), the total
population of Split was 178 102. Split is located on
the peninsula and surrounded by hills. Mosor hill is
located on the northeast side of the city (Fig. 1C).
Kozjak hill is located on the northwest side. Split is
surrounded by the islands of Brač, Hvar, Šolta, and
Čiovo (Fig. 1B). The city of Split consists of 92
statistical circles (SC) (Fig. 1C). A statistical circle is
one of the smallest statistical spatial units in the HR.
They were established in 1959 and revised in each
previous census. They represent a permanent network
of spatial units, covering the entire mainland of the
HR (Šiljeg et al., 2018).
Figure 1: A) Split settlement in the HR; B) location of Split
peninsula in Split-Dalmatia Country and B) statistical
circles (IDs of Split settlement.
ID (Figure 1) - Name of statistical circle
1-SK0049298, 2-SK0049301, 3-SK0049310, 4-SK0109819, 5-SK0109827, 6-
SK0109835, 7-SK0109843, 8-SK0109851, 9-SK0109860, 10-SK0109878, 11-
SK0109886, 12-SK0109894, 13-SK0109908, 14-SK0109916, 15-SK0109924,
16-SK0109932, 17-SK0109959, 18-SK0109967, 19-SK0109975, 20-SK0109983,
21-SK0109991, 22-SK0110019, 23-SK0110027, 24-SK0110035, 25-SK0110043,
26-SK0110051, 27-SK0110060, 28-SK0110078, 29-SK0110086, 30-SK0110094,
31-SK0110108, 32-SK0110116, 33-SK0110124, 34-SK0110132, 35-SK0110159,
36-SK0110167, 37-SK0110175, 38-SK0110183, 39-SK0110191, 40-SK0110205,
41-SK0110213, 42-SK0110221, 43-SK0110230, 44-SK0110248, 45-SK0110256,
46-SK0110264, 47-SK0110272, 48-SK0110299, 49-SK0110302, 50-SK0110329,
51-SK0110337, 52-SK0110345, 53-SK0110353, 54-SK0110361, 55-SK0110370,
56-SK0110388, 57-SK0110396, 58-SK0110400, 59-SK0110418, 60-SK0110426,
61-SK0110434, 62-SK0110442, 63-SK0110469, 64-SK0110477, 65-SK0110485,
66-SK0110493, 67-SK0110507, 68-SK0110515, 69-SK0110523, 70-SK0110531,
71-SK0110540, 72-SK0110558, 73-SK0110566, 74-SK0110574, 75-SK0110582,
76-SK0110604, 77-SK0110612, 78-SK0110639, 79-SK0110647, 80-SK0110655,
81-SK0110663, 82-SK0110671, 83-SK0110680, 84-SK0110698, 85-SK0110701,
86-SK0110710, 87-SK0113034, 88-SK0113069, 89-SK0113107, 90-SK0113115,
91-SK0113123, 92-SK0148652
GISTAM 2021 - 7th International Conference on Geographical Information Systems Theory, Applications and Management
268
3 MATERIAL AND METHODS
3.1 GEOBIA Extraction of Land Use
Model using Worldview-3 (WV-3)
Imagery
The land cover model of the Split settlement was
derived from WorldView-3 (WV-3) satellite imagery.
WV-3 was launched on 13 August 2014 by Digital
Globe (Ye et al., 2017). WV-3 is one of the most
advanced commercial satellites. It provides one of the
highest spatial resolutions for multispectral data (0.31
m for panchromatic data and up to 1.24 m for
multispectral bands) (Maxar Technologies, 2019).
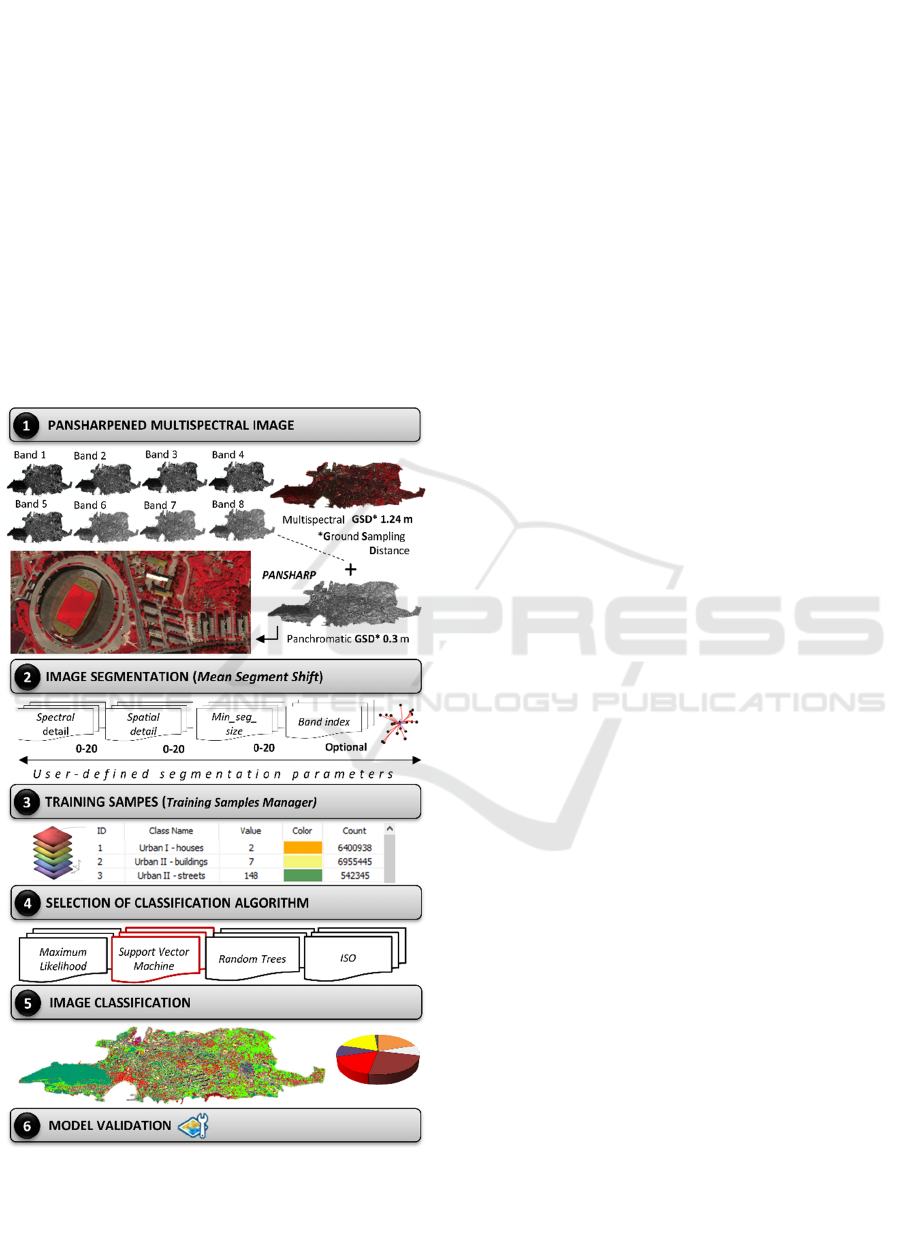
The derivation of land cover was done through
several steps (Fig. 2).
Figure 2: Scheme of WV-3 image processing using
GEOBIA method.
The first step involved creation of a multispectral
image (MS) using the Composite bands tool. Then
spatial resolution of the MS was enhanced using a
panchromatic image (Choi et al., 2019). This was
done in the Geomatica Banff 2018 Trial with
PANSHARP tool. The product of this process was
pansharpened MS.
Then segmentation of pansharpened image was
done. The Segment Mean Shift tool in ArcGIS
software was used. Quality of land cover is highly
determined by the selection of user-defined
parameters: Spectral Detail, Spatial Detail,
Min_Segment_Size, and Band Indexes.
The Spectral Detail sets the level of importance
given to the spectral differences of features in the
imagery (ESRI, 2020).
The Spatial Detail sets the level of importance
given to the proximity between features. In both cases,
values range from 1 to 20.
The Min_Segment_Size parameter identifies
blocks of pixels that are too small (in relation to
defined value) to be considered as a fragment (ESRI,
2020). All segments that are smaller than the
specified value will be merged with their best fitting
neighbor segment.
Band_Indexes parameters refer to the selection of
the bands used in multispectral image segmentation.
It is necessary to choose bands that offer the most
noticeable differences between features. However,
there is no clearly defined rule about the optimal
segmentation parameters values (Benarchid and
Raissouni, 2014).
To define the best combination for UPIs
extraction, we have tested different parameter values
using (Fig. 3) the visual interpretation method (trial-
and-error) (Benarchid and Raissouni, 2014).
Three segmented images were generated using
different parameter values (Fig. 3). The visual
interpretation showed that the third segmented model
gave the best result (Fig. 3). In it, the values of
spectral and spatial detail are high enough to separate
features of similar spectral characteristics and to
create not too spatialy smooth classes. On this model
training samples are taken for identification of the
land cover classes. About fifty training samples were
marked for each defined class (n=8).
In the next step, train Esri classifier definition
(.ecd) file using the Support Vector Machine (SVM)
was created. Some researches have shown that SVM
in urban environments (Kranjčić et al., 2019) is
achieving higher classification accuracy than
traditional methods (Chen et al., 2019). In the final
step, the land cover model for Split settlement was
generated (Fig. 2). In future research, the accuracy
Derivation of Urban Planning Indicators (UPIs) using Worldview-3 Imagery and GEOBIA Method for Split Settlement, Croatia
269
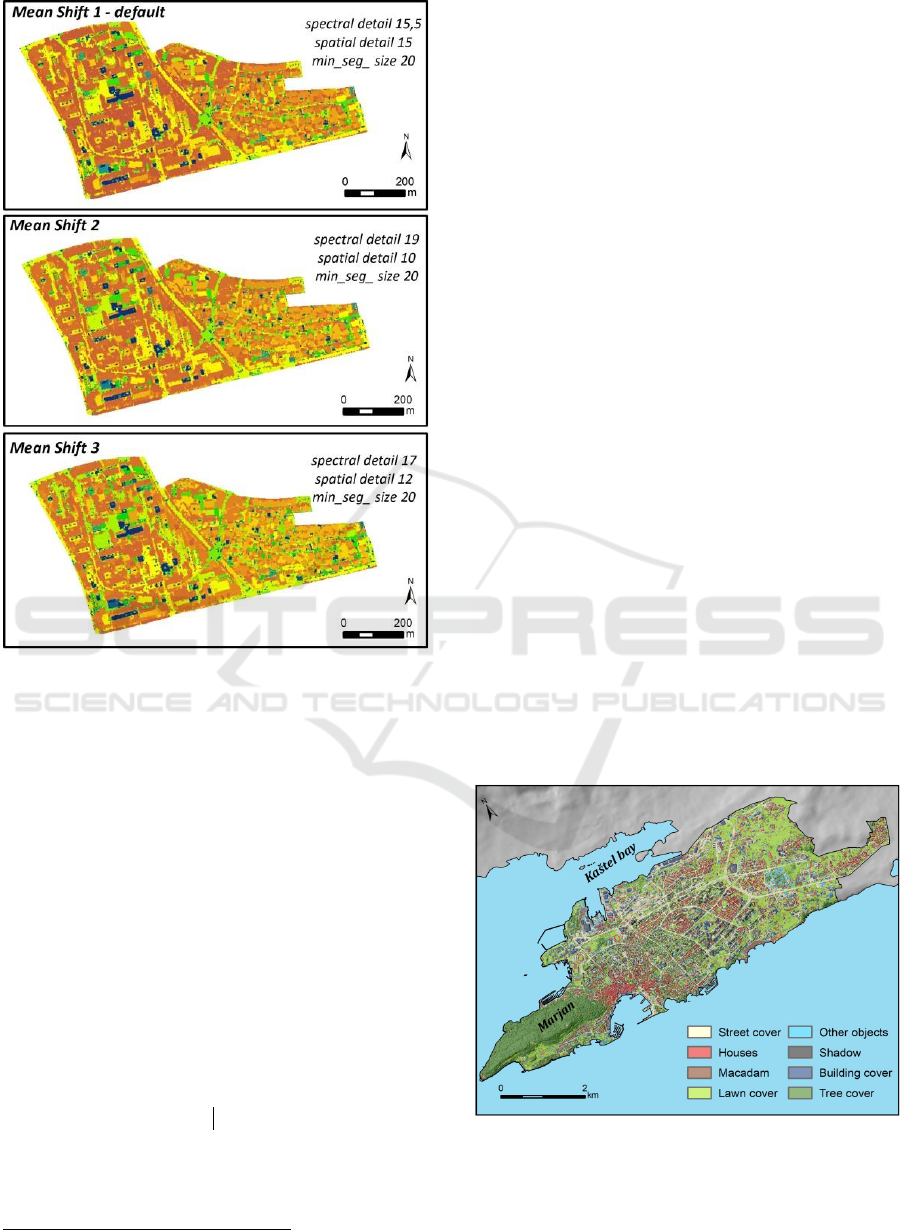
Figure 3: Tested segmentation parameter values.
assessment of land cover (overall accuracy and class
by class) will be performed using the very high-
resolution multispectral model generated with Mica
Sense RedEdge-MX mounted on Matrix 600 Pro.
3.2 Derivation of Urban Planning
Indicators (UPIs)
The UPIs for each statistical circle were derived from
the generated land cover. UPIs used in this study
were:
1. Lawn Cover Ratio (LCR): percentage of the
study area that is covered by low vegetation (%);
2. Tree Cover Ratio (TCR): percentage of the
study area that is covered by trees (%);
3. Green Cover Ratio (GCR): percentage of the
study area that is covered by any kind of vegetation
(%) (GCR = LCR + TCR) ;
4. Street Cover Ratio (SCR): percentage of the
study area that is covered by concrete surfaces (%);
4
Macadam is broken stone of even size used for surfacing roads.
5. Building Cover Ratio (BCR): percentage of the
study area that is covered by buildings (%)
6. Impervious Surfaces Ratio (ISR): percentage of
the study area that is covered by impervious surfaces
(buildings + concrete surfaces, houses) (%).
The first three UPIs are recognized as vegetation
indicators of urban planning. They are important
because the spatio-temporal distribution of vegetation
is regarded as a fundamental variable in some aspects
of urban planning. The use of such vegetation
indicators is a common approach in vegetation
monitoring. The other three UPIs (SCR, BCR, and
ISR) are indicators of urbanization and major
contributors to the environmental impact of
urbanization.
4 RESULTS AND DISCUSSION
4.1 Land Cover Model
Total eight land use classes have been identified and
extracted; tree cover, lawn cover, street cover,
buildings, houses, macadam
4
, shadows, and other
objects (Fig. 4). Shadows are observed as a deficiency
in this MS imagery. This has become especially
notable in the urban environment modeling where
they are potentially the main source of
misclassification (Zhan et al, 2005). This problem is
particularly pronounced when using advanced
sensors with very high resolution (Shahi et al., 2014).
Therefore, in this research shadows are detected and
classified as a separate category (Zhang et al., 2018).
Figure 4: Land cover model of Split settlement.
GISTAM 2021 - 7th International Conference on Geographical Information Systems Theory, Applications and Management
270
In this case study, most of them are detected on the
northern side of the objects due to sun position during
the satellite recording and are caused by a pronounced
height of specific objects. The percentage of shadow
class in the total area of SK varies significantly The
highest percentages (around 15%) are found in
smaller statistical circles (SK0110485, SK0110361)
in which tall, residential buildings predominate.
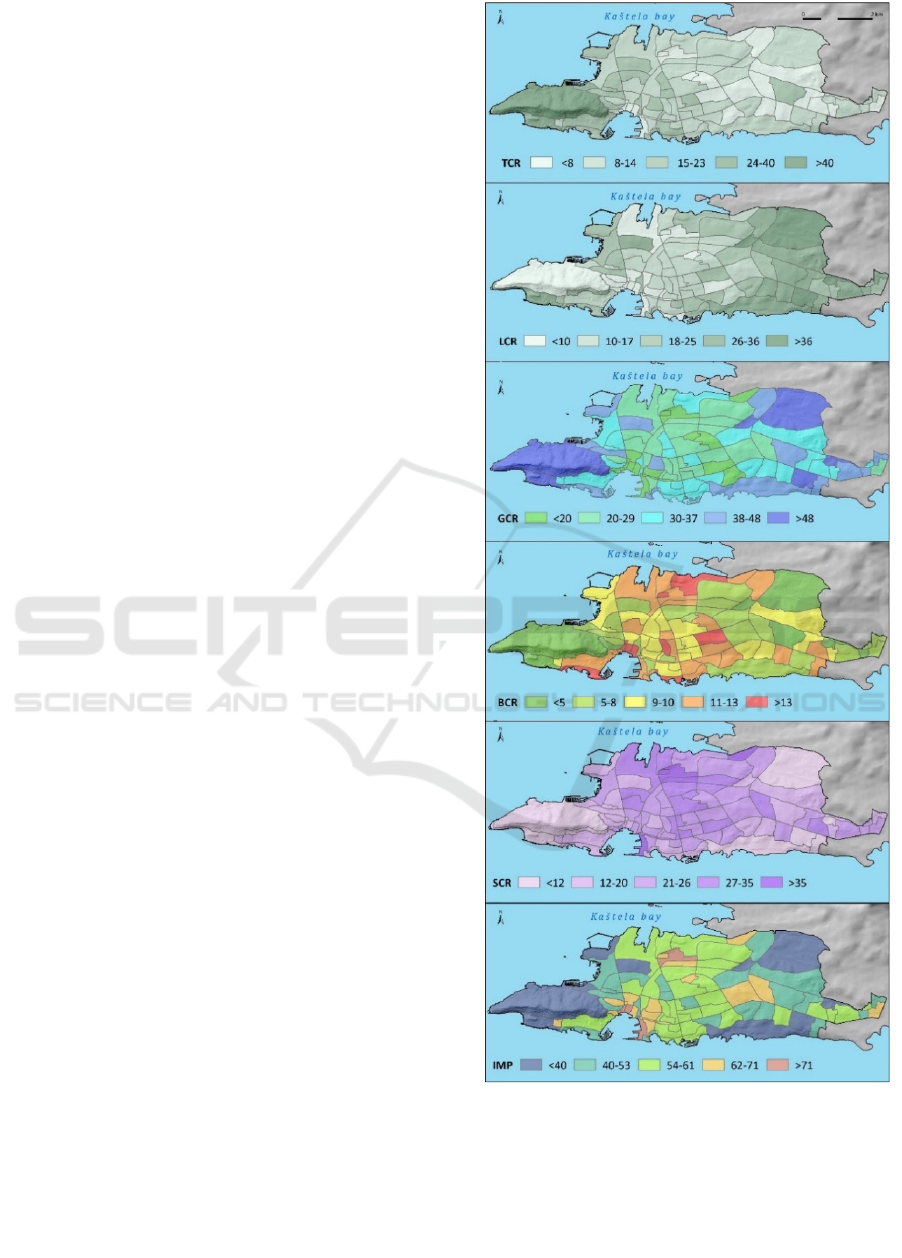
4.2 Urban Planning Indicators (UPIs)
The main results of this study are derived UPIs (Fig.
5). Vegetation indicators have a higher percentage in
the outskirts of the city, with the exception of the
SK0109932 located in the western part of the city,
dominated by the Marjan Forest Park which has the
highest GCR among all circles (92.38%). Forest-Park
is one of eleven nature protection categories in
Croatia. Tree cover is making 85.72% of the
SK0109932. The high GCR is also noticed in adjacent
units south (SK0109959, SK0109908) of Marjan and
in the eastern part (SK0110701) where GCR mostly
consists of lawn cover (Fig. 5). This SK includes the
Mejaši, a relatively young neighborhood that was
merged with the city in the 2000s. In recent times new
residential buildings have been constructed in this
area. As expected, these statistical circles have the
lowest ratio of impervious surfaces.
The old city center along with the wider city
center area stands out as the most built-up part,. These
units (SK0109827, SK0109860, SK0109843,
SK0110205, SK0109894, etc.) are characterized by a
prevalence of impervious surfaces (67-82%) and the
lack of green areas. The most dominant type of
impervious surfaces in this area are streets and
buildings. These are older residential neighborhoods
(Klempić, 2004). The northern outskirts (SK
0110582, SK 0110655) of the city are also
characterized by a high presence of impervious
surfaces (Figure 5). However, this part of the city is
highly industrialized. Statistical circles characterized
with the highest values of SCR (SK 0110205, SK
0110582, SK 0110060, SK 0110574, SK 0110655,
SK 0110647) are located nearby industrial zone,
central bus station, and passenger port.
A large percentage of the IMP (buildings, roads,
houses) in statistical circles is not surprising given the
history of spatial-functional development of the Split
settlement. Namely, in the period from the Second
World War to the 1990s, housing construction in Split
was marked by socially-oriented collective
construction with the objective to build as many
residential buildings as possible on the smallest area
possible. After the intensified industrialization
Figure 5: Derived UPIs for Split settlement.
process on the outskirts of the city, due to cheaper
land, the construction of individual, mostly illegal
housing units is taking place, which in the 1990s
became the dominant form of housing construction
(Klempić, 2004).
Derivation of Urban Planning Indicators (UPIs) using Worldview-3 Imagery and GEOBIA Method for Split Settlement, Croatia
271

To our knowledge, there are not many papers in
which WV3 imagery was used to generate specific
UPIs. In this study, it was demonstrated that WV3
imagery provides a good background to generate
spatially detailed and up-to-date land cover data for a
large urban area. This data is invaluable input for
many activities within urban planning and
development.
5 CONCLUSION
In this paper, we have demonstrated the use of WV-3
imagery and the GEOBIA method in the derivation of
UPIs for the Split settlement. These types of UPIs can
be used at the neighborhood level of urban planning
and analysis of different issues in an urban
environment. UPIs provided in this study, can form a
basis for future planning and spatial organization of
Split settlement. Significant spatial variability
between UPIs is observed at the level of the statistical
circles. The UPIs values at the studied level are the
reflection of the historical spatial-functional
development of the Split settlement. Urban expansion
of the Split city is limited by its geographical location
and orographic features of the surrounding area.
Therefore, further development of the city is
envisaged within the existing boundaries. In that
context, the importance of knowing the exact, up-to-
date UPIs cannot be overemphasized.
In future research, we are planning to analyze the
UPIs within the specific SK using MS images of very-
high resolution (<5 cm). Such detailed data would
enable the accurate assessment of the UPIs generated
from WV3 imagery. Also, it could help in
establishing a system of indicators for urban
management and in providing the assistance in
monitoring of urban development at micro-level of
research.
ACKNOWLEDGEMENTS
This work has been supported by INTERREG Italy-
Croatia PEPSEA (Protecting the Enclosed Parts of the
Sea in Adriatic from pollution) and Croatian Science
Foundation under the project UIP-2017-05-2694.
REFERENCES
Abbate, G., Fiumi, L., De Lorenzo, C., & Vintila, R. (2003).
Evaluation of remote sensing data for urban planning.
Applicative examples by means of multispectral and
hyperspectral data. 2003 Remote Sensing and Data
Fusion over Urban Areas. 2nd GRSS/ISPRS Joint
Workshop On.
Anguluri, R., Narayanan, P. (2017). Role of green space in
urban planning: Outlook towards smart cities. Urban
Forestry & Urban Greening, 25, 58-65.
Benarchid, O., Raissouni, N. (2014, April). Mean-shift
Segmentation Parameters Estimator (MSPE): A new
tool for Very High Spatial Resolution satellite images.
In 2014 International Conference on Multimedia
Computing and Systems (ICMCS) (pp. 357-361). IEEE.
Blaschke, T., Hay, G. J., Weng, Q., & Resch, B. (2011).
Collective Sensing: Integrating Geospatial
Technologies to Understand Urban Systems—An
Overview. Remote Sensing, 3(8), 1743–1776
Bodzin, A. M., Cirucci, L. (2009). Integrating geospatial
technologies to examine urban land use change: A
design partnership. Journal of Geography, 108(4-5),
186-197.
Brownson, R. C., Hoehner, C. M., Day, K., Forsyth, A., &
Sallis, J. F. (2009). Measuring the built environment for
physical activity: state of the science. American journal
of preventive medicine, 36(4), S99-S123.
Bryant, M. M. (2006). Urban landscape conservation and
the role of ecological greenways at local and
metropolitan scales. Landscape and urban planning,
76(1-4), 23-44.
Chatzipoulka, C., Compagnon, R., & Nikolopoulou, M.
(2016). Urban geometry and solar availability on
façades and ground of real urban forms: using London
as a case study. Solar Energy, 138, 53-66.
Chen, W., Li, X., & Wang, L. (2019). Fine Land Cover
Classification in an Open Pit Mining Area Using
Optimized Support Vector Machine and WorldView-3
Imagery. Remote Sensing, 12(1), 82.
Choi, J., Park, H., Seo, D. (2019). Pansharpening Using
Guided Filtering to Improve the Spatial Clarity of VHR
Satellite Imagery. Remote Sensing, 11(6), 633.
Chrysoulakis, N., Feigenwinter, C., Triantakonstantis, D.,
Penyevskiy, I., Tal, A., Parlow, E., Marconcini, M.
(2014). A conceptual list of indicators for urban
planning and management based on earth observation.
ISPRS International Journal of Geo-Information, 3(3),
980-1002.
Davidson, F. (1996). Planning for performance:
requirements for sustainable development. Habitat
international, 20(3), 445-462.
Dibiase, D., Demers, M., Johnson, A., Kemp, K., Luck, A.
T., Plewe, B., Wentz, E. (2006). Geographic
Information Science & Technology: Body of
Knowledge. USGIS, Association of American
Geographers, Washington, DC. Dimoudi, A., &
Nikolopoulou, M. (2003). Vegetation in the urban
environment: microclimatic analysis and benefits.
Energy and Buildings, 35(1), 69–76.
Du, S., Shi, P., Van Rompaey, A., & Wen, J. (2015).
Quantifying the impact of impervious surface location
on flood peak discharge in urban areas. Natural Hazards,
76(3), 1457
Duffin, (2019) Degree of urbanization,
https://www.statista.com/statistics/270860/urbanizatio
n-by-continent/, 10 December, 2020.
GISTAM 2021 - 7th International Conference on Geographical Information Systems Theory, Applications and Management
272

Elshater, A. (2017). Widen the Scale of Urban Design to the
Level of City Planning: Argument beyond a Case of
Two Cities. UPLanD-Journal of Urban Planning,
Landscape & environmental Design, 2(2), 207-221.
ESRI, (2020). Segment Mean Shift, https://desktop.
arcgis.com/en/arcmap/10.3/tools/spatial-analyst-
toolbox/segment-mean-shift.htm, 8 December, 2020,
Gong, Y., Palmer, S., Gallacher, J., Marsden, T., & Fone,
D. (2016). A systematic review of the relationship
between objective measurements of the urban
environment and psychological distress. Environment
international, 96, 48-57.
Hall, P. G. (2002) Urban and regional planning 4Ed.,
Routledge.
Hay, G. J., Castilla, G. (2008). Geographic Object-Based
Image Analysis (GEOBIA): A new name for a new
discipline. In Object-based image analysis (pp. 75-89).
Springer, Berlin, Heidelberg.
Herold, M, Goldstein, N. C. Clarke K. C. (2003). The
spatio-temporal form of urban growth: measurement,
analysis and modeling, Remote Sensing of the
Environment, 86, 286-302.
Klempić, S. (2004). Razvoj stambenih naselja Splita nakon
Drugog svjetskog rata. Hrvatski geografski glasnik,
66(2.), 95-119.
Kranjčić, N., Medak, D., Župan, R., Rezo, M. (2019).
Machine learning methods for classification of the
green infrastructure in city areas. ISPRS International
Journal of Geo-Information, 8(10), 463.
La Rosa, D. (2014). Accessibility to greenspaces: GIS
based indicators for sustainable planning in a dense
urban context. Ecological Indicators, 42, 122-134.
LeGates, R., Tate, N. J., Kingston, R. (2009). Spatial
thinking and scientific urban planning. Environment
and Planning B: Planning and Design, 36(5), 763–768.
Levy, J. M. (2016). Contemporary urban planning. Taylor
& Francis.
Lin, P., Lau, S. S. Y., Qin, H., Gou, Z. (2017). Effects of
urban planning indicators on urban heat island: a case
study of pocket parks in high-rise high-density
environment. Landscape and Urban Planning, 168, 48-
60.
Liu, Y. (2009). Modelling Urban Development with
Geographical Information Systems and Cellular
Automata, CRC Press.
Lo, C. P. (2007). The application of geospatial technology
to urban morphological research. Urban Morphology,
11(2), 81.
Marić, I., Šiljeg, A., Domazetović, F. (2019) Geoprostorne
tehnologije u 3D dokumentaciji i promociji kulturne
baštine–primjer utvrde Fortica na otoku Pagu,
Geodetski glasnik, 50, 19-44.
Maxar Technologies (2019). Stereo Imagery datasheet.
Retrieved from https://www.digitalglobe.com/
resources (Accessed on 03 December 2020).
Miller, R. B., & Small, C. (2003). Cities from space:
potential applications of remote sensing in urban
environmental research and policy. Environmental
Science & Policy, 6(2), 129–137.
Petralli, M., Massetti, L., Brandani, G., & Orlandini, S.
(2014). Urban planning indicators: useful tools to
measure the effect of urbanization and vegetation on
summer air temperatures. International Journal of
Climatology, 34(4), 1236-1244.
Rosales, N. (2011). Towards the modeling of sustainability
into urban planning: Using indicators to build
sustainable cities. Procedia Engineering, 21, 641-647.
Sénécal, G. (2007). Urban environment: mapping a concept.
Introductory note. Environnement Urbain/Urban
Environment, (Volume 1).
Shahi, K., Shafri, H. Z., Taherzadeh, E., Mansor, S., &
Muniandy, R. (2015). A novel spectral index to
automatically extract road networks from WorldView-
2 satellite imagery. The Egyptian Journal of Remote
Sensing and Space Science, 18(1), 27-33.
Shen, L. Y., Ochoa, J. J., Shah, M. N., Zhang, X. (2011).
The application of urban sustainability indicators–A
comparison between various practices. Habitat
international, 35(1), 17-29.
Sinha, B. R. K. (Ed.). (2019). Multidimensional Approach
to Quality of Life Issues.
Sleavin, W. J., Civco, D. L., Prisloe, S., Giannotti, L. (2000,
May). Measuring impervious surfaces for non-point
source pollution modeling. In Proceedings of the
ASPRS 2000 Annual Conference (pp. 22-26).
Šiljeg, S., Marić, I., Nikolić, G., Šiljeg, A. (2018).
Accessibility analysis of urban green spaces in the
settlement of Zadar in Croatia. Šumarski list, 142(9-10),
487-496.
Tenedório, J. A., Rebelo, C., Estanqueiro, R., Henriques, C.
D., Marques, L., & Gonçalves, J. A. (2016). New
developments in geographical information technology
for urban and spatial planning. In Geospatial research:
Concepts, methodologies, tools, and applications (pp.
1965-1997). IGI Global.
Wang, Z., Zhang, S., Peng, Y., Wu, C., Lv, Y., Xiao, K.,
Qian, G. (2020). Impact of rapid urbanization on the
threshold effect in the relationship between impervious
surfaces and water quality in Shanghai, China.
Environmental Pollution, 115569.
Watson, V. (2009). ‘The planned city sweeps the poor
away…’: Urban planning and 21st century urbanisation.
Progress in planning, 72(3), 151-193.
Ye, B., Tian, S., Ge, J., Sun, Y. (2017). Assessment of
WorldView-3 data for lithological mapping. Remote
Sensing, 9(11), 1132.
Zhan, Q., Shi, W., Xiao, Y. (2005). Quantitative analysis of
shadow effects in high-resolution images of urban areas.
In International Archives of Photogrammetry and
Remote Sensing 36, no. 8/W27
Zhang, P., Ke, Y., Zhang, Z., Wang, M., Li, P., & Zhang, S.
(2018). Urban land use and land cover classification
using novel deep learning models based on high spatial
resolution satellite imagery. Sensors, 18(11), 3717.
Zhao C, Fu G, Liu X, Fu F. 2011. Urban planning indicators,
morphology and climate indicators: A case study for a
north–south transect of Beijing, China. Building and
Environment 46: 1174– 1183.
Derivation of Urban Planning Indicators (UPIs) using Worldview-3 Imagery and GEOBIA Method for Split Settlement, Croatia
273
