
Image-based Plant Disease Diagnosis with Unsupervised Anomaly
Detection based on Reconstructability of Colors
Ryoya Katafuchi and Terumasa Tokunaga
Kyushu Institute of Technology, 680 Kawazu, Iizuka, Fukuoka, Japan
Keywords:
Anomaly Detection, Plant Disease Diagnosis, Deep Learning, Generative Adversarial Network, Pix2pix.
Abstract:
This paper proposes an unsupervised anomaly detection technique for image-based plant disease diagnosis.
The construction of large and publicly available datasets containing labeled images of healthy and diseased
crop plants led to growing interest in computer vision techniques for automatic plant disease diagnosis. Al-
though supervised image classifiers based on deep learning can be a powerful tool for plant disease diagnosis,
they require a huge amount of labeled data. The data mining technique of anomaly detection includes un-
supervised approaches that do not require rare samples for training classifiers. We propose an unsupervised
anomaly detection technique for image-based plant disease diagnosis that is based on the reconstructability of
colors; a deep encoder-decoder network trained to reconstruct the colors of healthy plant images should fail to
reconstruct colors of symptomatic regions. Our proposed method includes a new image-based framework for
plant disease detection that utilizes a conditional adversarial network called pix2pix and a new anomaly score
based on CIEDE2000 color difference. Experiments with PlantVillage dataset demonstrated the superiority of
our proposed method compared to an existing anomaly detector at identifying diseased crop images in terms
of accuracy, interpretability and computational efficiency.
1 INTRODUCTION
Plant disease diagnosis is an important task for food
safety and security. The PlantVillage project (Hughes
and Salathe, 2016) was started to develop accurate im-
age classifiers for plant disease diagnosis. This is a
publicly available image dataset for developing auto-
matic diagnostic techniques to identify plant diseases.
It provides thousands of labeled images of healthy and
diseased crop plants collected under controlled condi-
tions. Such a large dataset has been used to establish
deep learning challenges for developing an accurate
image classifier for plant disease diagnosis.
In a comprehensive experiment using color crop
images, AlexNet and GoogleNet achieved average ac-
curacies of over 90% at identifying 26 diseases in
14 crop species (Mohanty et al., 2016). Similarly,
LeNet accurately classified diseased banana leaves
under severe conditions (Amara et al., 2017). Ferenti-
nos (2018) (Ferentinos, 2018) compared the perfor-
mances of five convolutional neural network (CNN)
models using leaf images obtained under both labo-
ratory and real conditions. The VGG model achieved
the best performance with a success rate of 99.53%.
Another study using the PlantVillege dataset showed
that deep learning provided outstanding performance
compared with conventional machine learning tech-
niques (Radovanovic and Ðukanovic, 2020).
The results of the previous studies warrant further
developments of image-based plant disease diagno-
sis techniques for more practical applications. Super-
vised image classifiers based on deep learning require
a huge amount of labeled data for training. Correct-
ing samples with rare diseases often imposes a severe
burden on human annotators, which can be a severe
bottleneck for practical application. To address this
issue, further studies are needed to develop an image-
based diagnosis technique that is free of annotation
costs for rare samples.
Anomaly detection is a data mining technique for
identifying irregular or unusual patterns in datasets.
This technique exhibits a wide range of applications,
such as fraud detection for financial services, in-
trusion detection for networks, identification of dis-
ease markers for medical diagnosis, and failure detec-
tion for engineering systems. Typical approaches to
anomaly detection are based on conventional machine
learning. Simple clustering approaches are often used
for unlabeled data (Xiong et al., 2011) (Zimek et al.,
2012). In cases where normal and anomalous labels
112
Katafuchi, R. and Tokunaga, T.
Image-based Plant Disease Diagnosis with Unsupervised Anomaly Detection based on Reconstructability of Colors.
DOI: 10.5220/0010463201120120
In Proceedings of the International Conference on Image Processing and Vision Engineer ing (IMPROVE 2021), pages 112-120
ISBN: 978-989-758-511-1
Copyright
c
2021 by SCITEPRESS – Science and Technology Publications, Lda. All rights reserved

are available, simple classification approaches such as
support vector machines are used (Chen et al., 2001).
Recently, many anomaly detection techniques
based on deep neural networks have been proposed
in the fields of machine learning and computer vision.
Deep anomaly detection can be categorized into three
groups based on the type of machine learning: super-
vised approaches (Chalapathy and Menon, 2017), un-
supervised approaches (Patterson and Gibson, 2017),
(Tuor et al., 2017), (Sutskever et al., 2008), (Vin-
cent et al., 2008), (Rodriguez et al., 1999), (Lample
et al., 2016), and semi-supervised approaches (Ed-
munds and Feinstein, 2017), (Racah et al., 2017),
(Perera and Patel, 2019). (Chalapathy, 2019) provides
a comprehensive review of these approaches.
Generative adversarial networks (GANs) (Good-
fellow et al., 2014) demonstrated a great deal of
success with image generation tasks (Radford et al.,
2016) (Chen et al., 2016) (Salimans et al., 2016)
(Gulrajani et al., 2017) (Mao et al., 2017) (Isola
et al., 2017). The excellent expressive power of
GANs led to growing interest in utilizing them for
real-world data analysis, including anomaly detec-
tion. GANs are typically applied to adversarial fea-
ture learning (Donahue et al., 2017) of normal data
and measuring anomaly scores for a given query
image. AnoGAN (Schlegl et al., 2017) provides
an unsupervised approache to detecting real-world
anomalies, including the discovery of novel anoma-
lies in medical imaging data. Recently, some ex-
tensions of AnoGAN have been proposed to over-
come performance issues (Zenati et al., 2018) (Ak-
cay et al., 2018) or improve the computational effi-
ciency (Schlegl et al., 2019).
AnoGAN computes the anomaly score based on
the reconstructability of normal samples. Because
AnoGAN does not require anomalous data for train-
ing neural networks, it is applicable to diverse prob-
lems, including those within the natural sciences.
However, this approach does not explicitly focus on
colors in imaging data. In many real-world problems,
color information is essential to discovering anoma-
lies in datasets. For example, discoloration of leaves
can be crucial information for detecting symptoms
(Riley et al., 2002).
To the best of our knowledge, there have been no
extensions of AnoGAN focused on detecting color
anomalies. Moreover, AnoGAN exhibits two draw-
backs for real-time applications: it requires a huge
amount of normal data to learn a manifold of normal
variability, and it requires an iterative procedure for
calculating anomaly scores, which reduces computa-
tional efficiency.
In this paper, We propose a new anomaly detec-
tion method for detecting plant diseases at the image
level and visualizing symptomatic regions at the pixel
level. The proposed method uses a conditional adver-
sarial network called pix2pix (Isola et al., 2017) for
learning inverse mapping from converted grayscale
images to original color images. The simplicity of
this strategy means that the proposed method should
work well even in cases where a large amount of nor-
mal data is unavailable, unlike AnoGAN. We applied
the proposed method to the PlantVillage dataset to
explore its utility. Also, we propose a simple, and
easy-to-interpret anomaly score that is based on the
CIEDE2000 color difference. Because the proposed
method does not require any iterative procedure for
calculating the anomaly score, the computational ef-
ficiency is expected to be sufficient for real-time dis-
ease detection.
2 RELATED WORK
The present work was motivated by
AnoGAN (Schlegl et al., 2017) and its ex-
tensions (Zenati et al., 2018) (Akcay et al.,
2018) (Schlegl et al., 2019). AnoGAN relies on
the concept of reconstructing normal data from latent
variables. This framework is applicable to diverse
problems, but its effectiveness at detecting color
anomalies has not been demonstrated in previous
studies. Our proposed method relies on the recon-
struct colors. Specifically, we hypothesized that a
rich generative model trained to reconstruct colors
of normal data will fail to color anomalous regions
in images. Unlike AnoGAN and its extensions,
our focused was on detecting color anomalies, such
as discolored parts on plants. Thus, the proposed
method can be viewed as an extension of AnoGAN
but in a different direction from previous studies.
3 METHOD
Outline of the Proposed Method. Fig. 1 shows a
schematic of the proposed method. It consists of five
steps for image-level detection and pixel-level visual-
ization of plant diseases:
1. Preparation: Anomalies in color images
are detected in terms of the reconstructability
of colors at the pixel level with a conditional
adversarial network. Consider a set of M pairs
of color images and grayscale images. Let
I
c
(x
i
) ∈ R
3
+
(i = 1, 2, . . . , 256 × 256) be a pixel
Image-based Plant Disease Diagnosis with Unsupervised Anomaly Detection based on Reconstructability of Colors
113

value representing a color at the pixel position x
i
.
Similarly, let I
g
(x
i
) ∈ R
+
(i = 1, 2, . . . , 256 × 256)
be a pixel value representing the intensity at the
pixel position x
i
. For notational simplicity, color
and grayscale images are expressed as I
c
and I
g
,
respectively. Pairs of images, I
c
and I
g
are used to
train the GAN so that the DCED network learns
the inverse mapping G : I
g
7→ I
c
. These training
images are selected only from normal data, while
the test data include both normal and anomalous
data. For evaluation purposes, we use a set of N
color images with an array of binary image-wise
ground-truth labels l
n
∈ {1, −1} (n = 1, 2, . . . , N).
2. Training: The left half of Fig. 1 illustrates con-
current training on generator and discriminator
networks. Pairs of images I
g
and I
c
are used as
the input and output respectively of G. Pairs of
I
c
and G(I
g
) are used as fake pairs to train the
discriminator network D.
3. Color Reconstruction: For the test data, the
reconstructed color image
ˆ
I
0
c
is obtained from
a query color image I
0
c
by using the trained
generator network.
4. Calculation of Color Anomaly Score: The
anomaly score is calculated for a given query
color image
˜
I
c
based on color differences be-
tween the reconstructed color image G(I
0
c
)
and the original color image I
0
c
. The color
difference d
i
is calculated from I
0
c
(x
i
) and
ˆ
I
0
c
(x
i
)
for all i. The anomaly score based on color dif-
ference is obtained simply by summing d
i
for all i.
5. Anomaly detection: Finally, a query image is
classified as normal or anomalous by a simple
thresholding of the anomaly score.
Color Reconstruction by Pix2pix. We used
pix2pix (Isola et al., 2017) for color reconstruction.
Pix2pix is a general framework for image-to-image
translation based on a deep convolutional GANs
(DCGANs). The generator network is U-Net, which
is a DCED network with skip structures. Skip struc-
tures enable a DCED network to learn both global
and local features efficiently. The discriminator is the
convolutional PatchGAN, which only penalizes the
structure at the patch scale.
Let the input and output variables for pix2pix be x
and y, respectively. Now, the loss function for training
pix2pix can be expressed as follows:
L
cGAN
(G, D) =
E
x,y
[logD(x, y)] + E
x,z
[log(1 − D(x, G(x, z))] (1)
where E[·] indicates the expected value, and z is a ran-
dom noise vector. During training, pix2pix seeks to
minimize L
cGAN
with respect to G while maximizing
it with respect to D according to L
1
-regularization:
G∗ = arg min
G
max
D
E
x,y
[logD(x, y)]
+E
x,z
[log(1 − D(x, G(x, z))]
+λE
x,y,z
[ky − G(x, z)k
1
] (2)
where k· k
1
indicates the L
1
-norm and λ is a hyperpa-
rameter which controls the strength of the regulariza-
tion term. See (Isola et al., 2017) for more details.
CIEDE2000 Color Anomaly Score. For a given
query color image, the anomaly score is calculated
for each pixel. We propose a new anomaly score
based on CIEDE2000, which reflects differences as
perceived by humans. This should align the pro-
vides anomaly score with visual inspection by human.
The CIEDE2000 color difference d
i
is calculated from
I
0
c
(x
i
) and
ˆ
I
0
c
(x
i
). Then, the anomaly score is ob-
tained simply by summing d
i
for all i. We briefly de-
scribe the concept of CIEDE2000 in the Appendix.
For more details, see (Sharma et al., 2005).
4 EXPERIMENT
Dataset. To evaluate the performance of the pro-
posed method, we used a dataset that is publicly
available through the PlantVillage project (Hughes
and Salathe, 2016). The dataset contains 54, 306
images of healthy and diseased plants covering 14
crops: apples, blueberries, cherries, corns, grapes,
oranges, peaches, bell peppers, potatoes, raspberries,
soybeans, squash, strawberreis, and tomatoes. Each
image exhibits three different versions: RGB color,
grayscale, and segmented.
Fig. 2 shows examples of segmented images in
the PlantVillage dataset for (a) healthy and (b) dis-
eased leaves. In the experiments, we used segmented
potato plant images comprising 152 healthy leaves
and 1,000 leaves with early blight, which is caused
by the fungus Alternaria solani. Symptoms appear
on older leaves as small brown spots. As the disease
progresses, it spreads throughout the leaf surface and
eventually makes it turn yellow and then wither.
We divided these images into training and test sets
for pix2pix, as given in Table 1. Half of the healthy-
leaf images were allocated to the training set, and half
IMPROVE 2021 - International Conference on Image Processing and Vision Engineering
114
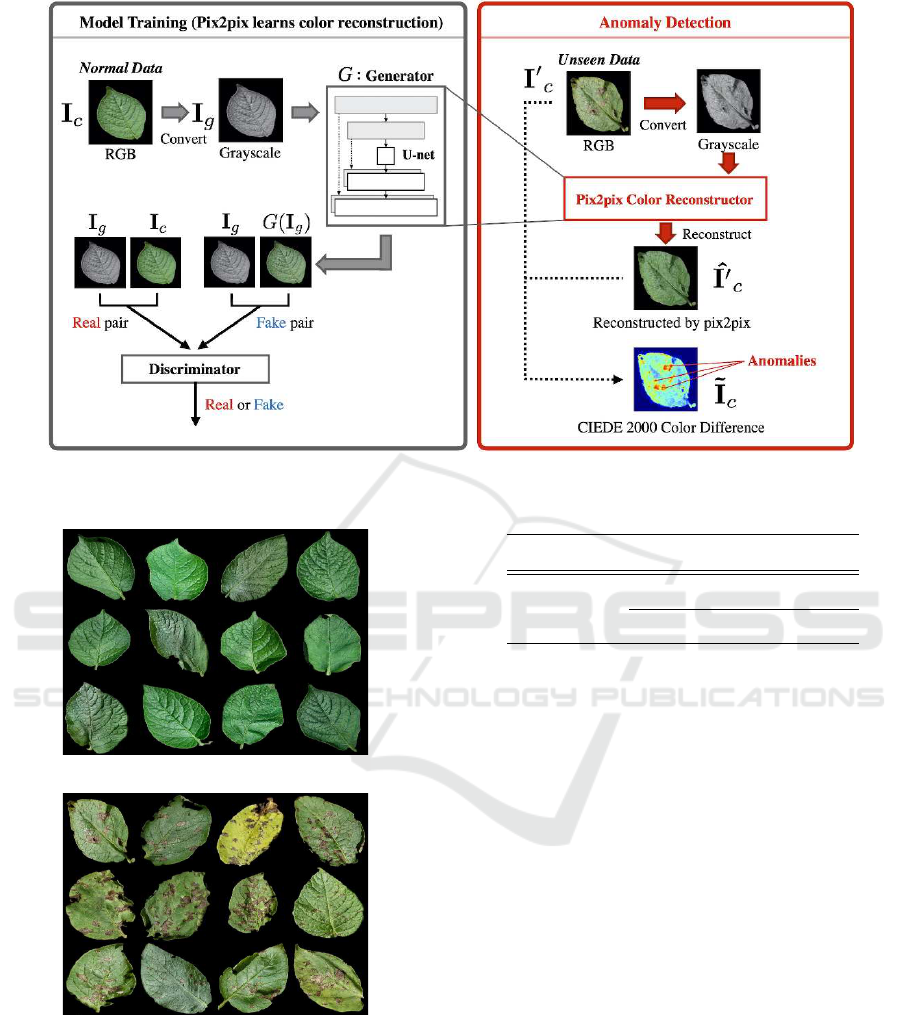
Figure 1: Outline of the proposed method.
(a) Healthy leaf data
(b) Disease leaf data
Figure 2: Examples of potato plant segmented images in
the PlantVillage dataset. (a) Healthy leaf Data, (b) Diseased
leaf Data.
were allocated to the test set. We randomly chose
100 diseased-leaf images for the test set. All images
demonstrated a resolution of 256 × 256 pixels.
Experimental Setup. Here, we briefly describe the
experimental setup for training the GANs. The opti-
Table 1: Number of images used in the experiment.
Training data Healthy leaf images 76
Test data
Healthy leaf images 76
Diseased leaf images 100
mization problem described in Eq. 2 was solved with
the Adam optimizer at a learning rate of 0.00015. The
momentums were set to β
1
= 0.5, and β
2
= 0.999.
The discriminator has a PatchGAN architecture with
a patch size of 64 × 64. Training was terminated after
150 epochs. The hyperparameter for L
1
regularization
was set to λ = 10.
For comparison, we use AnoGAN and the con-
ventional unsupervised anomaly detection methods:
Convolutional Autoencoders (CAEs) with L2 and
SSIM (Paul et al., 2018), One-Class SVM (OC-
SVM) (Bernhard et al., 2002) as baseline methods for
evaluating the performance of our proposed method.
AnoGAN was also trained with the Adam op-
timizer at a learning rate was 0.0001. Momen-
tums were set to be the same as those for pix2pix.
AnoGAN training was terminated after 2, 000 epochs.
The latent variable dimension in AnoGAN was set to
30. To calculate the anomaly scores, the weight coef-
ficients for the residual loss and discrimination score
were set to 0.9 and 0.1, respectively. Also, we calcu-
lated simple color histogram similarity to measure the
color differences aiming at highlighting a characteris-
tic of CIEDE2000.
We used Pytorch (version 1.3.0)
code for pix2pix which is available at
Image-based Plant Disease Diagnosis with Unsupervised Anomaly Detection based on Reconstructability of Colors
115

https://github.com/phillipi/pix2pix. We modified
the Keras (version 2.2.4) code for AnoGAN which is
available at https://github.com/tkwoo/anogan-keras.
All computations were performed on a GeForce RTX
2028 Ti GPU based on a system running Python 3.6.9
and CUDA 10.0.130.
Color Differences at the Pixel Level. Fig. 3 shows
example results for the pixel-level visualization of test
data. The top row (Healthy) shows the results for
healthy potato leaves. The middle and lower rows
(Disease (1) and Disease (2), respectively)) show the
results for two diseased leaf examples. Fig. 3(a)
shows the original color images, and Fig. 3(b) shows
the grayscale conversion. Fig. 3(c) shows the color
images reconstructed by pix2pix. Fig. 3(d) shows
heat maps visualizing the CIEDE2000 color differ-
ence between the original and reconstructed color im-
ages. Warm colors indicate a large color difference.
As shown in Figs. 3(c), and (d), the healthy-
leaf images were successfully reconstructed. How-
ever, the symptomatic brown spots and yellow discol-
oration in the diseased-leaf images were not recon-
structed. These results aligned with our expectations
;because we trained pix2pix only with heathy-leaf im-
ages, the generator network could not reconstruct col-
ors in symptomatic regions. Consequently, symp-
tomatic regions exhibited large CIEDE2000 color dif-
ferences. In contrast, healthy leaves exhibited no sig-
nificant color differences.
For comparison, Fig. 3(e) shows the images re-
constructed by AnoGAN. The generator network was
trained with healthly-leaf images just like pix2pix.
Fig. 3(f) presents heat maps visualizing the residuals
for each pixel between the original and reconstructed
color images using the same format as in Fig. 3(d).
The leaves were clearly reconstructed ,incom-
pletely, which strongly affected the pixel-level resid-
uals. In particular, artificially highlighted regions
can be observed around the edges of leaves in both
the healthy and diseased cases. In contrast, the Dis-
ease (2) images indicate that most symptomatic re-
gions, with yellow discoloration were not highlighted
in the heat map. These results suggest the limitations
of AnoGAN for visualizing symptomatic regions of
plant leaves at the pixel level.
The incomplete reconstruction was most likely
caused by a lack of training data. Accordingly, the
reconstruction would be improved by adding healthy
leaf images to the training data. However, this should
cause the generator network, to fail to reconstruct
diseased-leaf images, which may generate substan-
tive artifacts. Thus, our proposed method provides
a more efficient pixel-level visualization of anomalies
in images in comparison with AnoGAN. In addition,
our proposed method works well even though only 76
healthy-leaf images were used for training.
Fig. 4 shows additional examples of pixel-level vi-
sualization of grape and strawberry leaf images with
the proposed method. Similar to the previous re-
sults with potatoes, the symptomatic regions on these
leaves were successfully highlighted. Thus, the pro-
posed method works well at detecting symptomatic
regions of various plants.
Performance Evaluation of Image-level Disease
Detection. Fig. 5 presents histograms for three
anomaly scores: (a) the CIEDE2000 anomaly score
(i.e., proposed method), (b) color histogram similar-
ity, and (c) AnoGAN anomaly score. The anomaly
scores for healthy and disease-leaf images are indi-
cated in red and blue, respectively. The results indi-
cate that the CIEDE2000 anomaly score is more intu-
itive for distinguishing healthy and diseased samples
at the image level.
To demonstrate the utility of the CIEDE2000
anomaly score in a more objective manner, Fig. 6,
shows receiver operating characteristic (ROC) curves
for image-level disease detection with the three types
of anomaly scores: CIEDE2000 (red), color his-
togram similarity (blue), and ANoGAN (green). The
corresponding area under the ROC curves (AUC)
is specified in parentheses in the figure legend.
The shapes of the ROC curves indicate that the
CIEDE2000 anomaly score demonstrates several use-
ful properties: a high true positive rate and low
false positive rate superior to those of the other two
anomaly scores.
Table 2 presents the statistical performance of the
proposed method at image-level disease detection in
terms of the precision, recall, and F
1
-score. These in-
dices were calculated the top-100 test images sorted
in decreasing order with respect to anomaly score.
The best performance for each index is bolded. The
CIEDE2000 anomaly score demonstrated a superior
performance compared to the two baseline anomaly
scores for all indices.
Computational Efficiency for the Anomaly Score.
During detection, AnoGAN needs to determine the la-
tent space location for a given query image based on
iterative backpropagation, which leads to the anomaly
score (Schlegl et al., 2017)(Schlegl et al., 2019).
This process reduces the computational efficiency of
AnoGAN. In contrast, our proposed method does not
require an iterative procedure during detection. Ta-
ble 3 presents the mean computation times in mil-
liseconds with standard deviations for calculating the
IMPROVE 2021 - International Conference on Image Processing and Vision Engineering
116
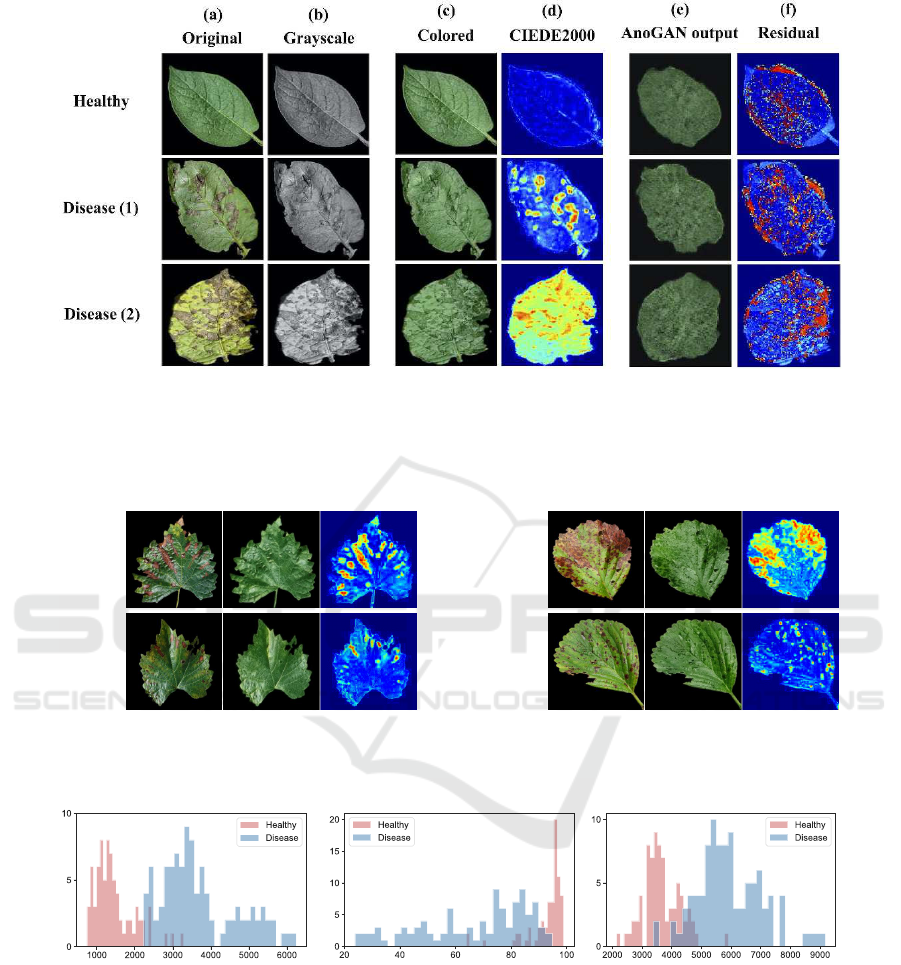
Figure 3: Examples of pixel-level disease visualization of plants: (a) original color images, (b) grayscale conversion, and (c)
color images reconstructed by pix2pix. (d) CIEDE2000 color differences between the original color images and reconstructed
color images. (e) Images reconstructed by AnoGAN. (f) Residuals between the original color images and images reconstructed
by AnoGAN.
(a)
Original
(b)
Colored
(c)
CIEDE2000
Grape 1
Grape 2
(a)
Original
(b)
Colored
(c)
CIEDE2000
Strawberry 1
Strawberry 2
Figure 4: Other examples of pixel-level disease visualization for grapes (first and second rows) and strawberries (third and
fourth rows): (a) original color images, (b) reconstructed color images, and (c) CIEDE2000 color differences.
(c) AnoGAN anomaly score(b) Color histogram similarity(a) CIEDE2000 anomaly score
Figure 5: Histograms of three anomaly scores.
CIEDE2000 anomaly score and AnoGAN anomaly
score of a given query image. The results suggest that
our approach offers superior computational efficiency
compared to AnoGAN, which is clearly an important
consideration for the practical application of real-time
disease detection in plantations.
5 CONCLUSIONS
We proposed a novel method for detecting plant dis-
eases from images that relies on color reconstructabil-
ity. Similar to AnoGAN, the proposed method detects
anomalies in test data based on unsupervised train-
ing of a generator and discriminator by normal data.
Unlike AnoGAN, however, the proposed method pre-
dominantly focuses on color anomalies in images.
Image-based Plant Disease Diagnosis with Unsupervised Anomaly Detection based on Reconstructability of Colors
117
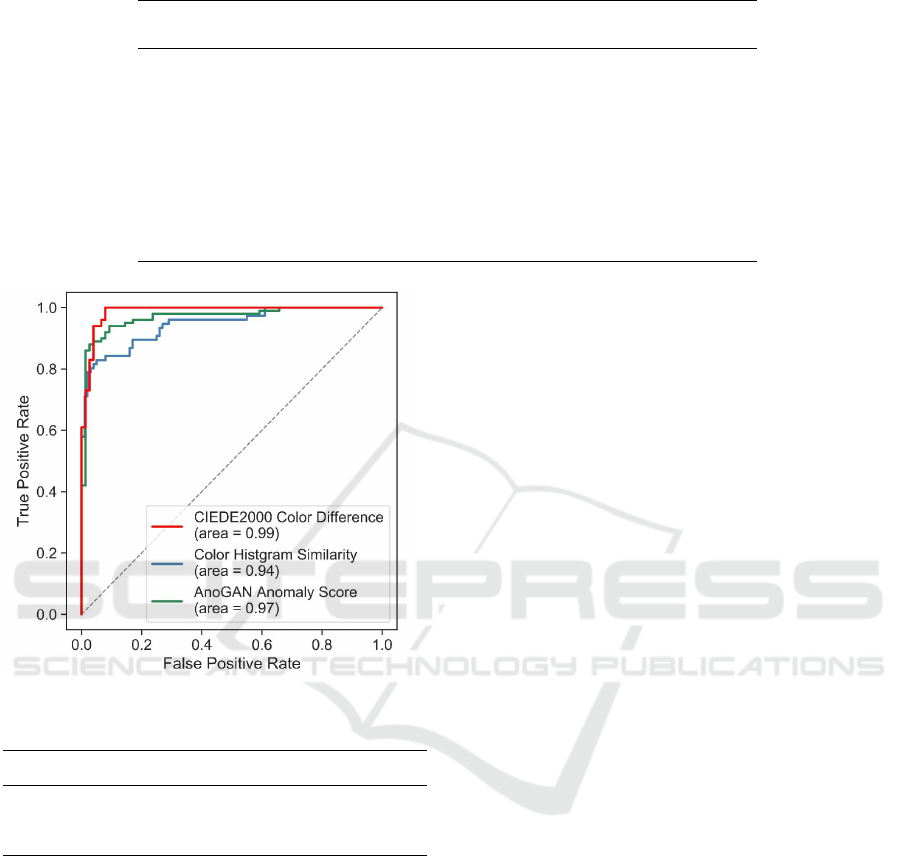
Table 2: Comparison of image-level disease detection performances with the PlantVillage dataset.
Method Precision Recall F
1
-Score AUC
CIEDE2000 Anomaly Score 0.94 0.94 0.94 0.99
color Histogram Similarity 0.86 0.86 0.86 0.94
AnoGAN Anomaly Score 0.92 0.92 0.92 0.97
AutoEncoder L2 Loss 0.67 0.68 0.69 0.67
AutoEncoder SSIM Loss 0.89 0.90 0.90 0.94
OneClass SVM 0.91 0.92 0.92 0.95
Figure 6: ROC curves based on three anomaly scores.
Table 3: Computation times for anomaly scores.
Healthy Diseased
Our method 61.24 ± 17.21 ms 62.09 ± 18.33 ms
AnoGAN 3884 ± 1138 ms 4574 ± 1538 ms
We compared the performance of the proposed
method with baseline methods including AnoGAN
in terms of accuracy, interpretability, and computa-
tional efficiency. Experiments with the PlantVillage
dataset showed that the proposed method performed
better than AnoGAN at image-level anomaly detec-
tion. Because the CIEDE2000 anomaly score is sim-
ple and aligns with human visual inspection, it can be
intuitively visualized as a heat map at the pixel level.
In representative examples, symptomatic regions on
leaves such as brown spots and yellow discoloration
were efficiently highlighted. No serious artifacts were
observed in either healthy- or diseased-leaf images, in
contrast to the residual maps based on AnoGAN.
Because the proposed method does not require
any iterative computation for calculating anomaly
scores, the mean computation time is significantly
less than that of AnoGAN. The computational effi-
ciency means that the proposed method could be prac-
tical for application to real-time image-based plant
disease detection. Future studies are warranted to ex-
plore the practicality of automatic diagnosis systems
for detecting plant diseases on a global scale based on
the idea of color reconstructability.
ACKNOWLEDGMENTS
This work was supported by JST, PRESTO Grant
Number JPMJPR1875, Japan. The authors would like
to thank Enago (www.enago.jp) for the English lan-
guage review.
REFERENCES
Akcay et al., 2018.Akcay, S., Atapour-Abarghouei, A., and
Breckon, T. P. (2018). Ganomaly: semi-supervised
anomaly detection via adversarial training.
Amara et al., 2017.Amara, J., Bouaziz, B., and Algergawy,
A. (2017). A deep learning-based approach for ba-
nana leaf diseases classification. In Lecture Notes in
Informatics2017.
Bergmann et al., 2019.Bergmann, P., Fauser, M., Sattlegger,
D., and Steger, C. (2019). Mvtec ad — a comprehen-
sive real-world dataset for unsupervised anomaly de-
tection. In 2019 IEEE/CVF Conference on Computer
Vision and Pattern Recognition (CVPR).
Bernhard et al., 2002.Bernhard, S., J, S. A., Francis, B.,
et al. (2002). Learning with kernels: support vector
machines, regularization, optimization, and beyond.
MIT press.
Chalapathy, 2019.Chalapathy, R. (2019). Generative adver-
sarial networks.
IMPROVE 2021 - International Conference on Image Processing and Vision Engineering
118

Chalapathy and Menon, 2017.Chalapathy, R. and Menon,
A. K. (2017). Robust, deep and inductive anomaly
detection. In Proceedings of ECML PKDD 2017.
Chen et al., 2016.Chen, X., Duan, Y., Houthooft, R., Schul-
man, J., Sutskever, I., and Abbeel, P. (2016). Infogan:
Interpretable representation learning by information
maximizing generative adversarial nets. In NIPS2016.
Chen et al., 2001.Chen, Y., Zhou, X., and Huang, T. S.
(2001). One-class svm for leaning in image retrieval.
In Proceedings IEEE International Conference on Im-
age Processing 2001.
Donahue et al., 2017.Donahue, J., Krahenbuhl, P., and Dar-
rell, T. (2017). Adversarial feature learning. In The In-
ternational Conference on Learning Representations
(ICLR).
Edmunds and Feinstein, 2017.Edmunds, R. and Feinstein,
E. (2017). Deep semi-supervised embeddings for dy-
namic targeted anomaly detection.
Ferentinos, 2018.Ferentinos, K. P. (2018). Deep learn-
ing models for plant disease detection and diagnosis.
Computers and Electronics in Agriculture, 145:311–
318.
Goodfellow et al., 2014.Goodfellow, I. J., Pouget-Abadie,
J., Mirza, M., Xu, B., Warde-Farley, D., Ozair, S.,
Courville, A., and Bengio, Y. (2014). Deep learning
for anomaly detection: A survey.
Gulrajani et al., 2017.Gulrajani, I., Ahmed, F., Arjovsky,
M., Dumoulin, V., and Courville, A. (2017). Improved
training of wasserstein gans. In NIPS2017.
Hughes and Salathe, 2016.Hughes, D. P. and Salathe, M.
(2016). An open access repository of images on plant
health to enable the development of mobile disease di-
agnostics.
Isola et al., 2017.Isola, P., Zhu, J.-Y., Zhou, T., and Efros,
A. A. (2017). Image-to-image translation with condi-
tional adversarial networks. In 2017 IEEE Conference
on Computer Vision and Pattern Recognition (CVPR).
Lample et al., 2016.Lample, G., Ballesteros, M., Subrama-
nian, S., Kawakami, K., and Dyer, C. (2016). Neu-
ral architectures for named entity recognition. In
Proceedings of the 2016 Conference of the North
American Chapter of the Association for Computa-
tional Linguistics: Human Language Technologies,
pages 260–270, San Diego, California. Association
for Computational Linguistics.
Mao et al., 2017.Mao, X., Li, Q., Xie, H., Lau, R. Y., Wang,
Z., and Smolley, S. P. (2017). Least squares genera-
tive adversarial networks. In 2017 IEEE International
Conference on Computer Vision (ICCV).
Mohanty et al., 2016.Mohanty, S. P., Hughes, D. P., and
Salathe, M. (2016). Using deep learning for image-
based plant disease detection. Frontiers in Plant Sci-
ence, 22.
Patterson and Gibson, 2017.Patterson, J. and Gibson, A.
(2017). Deep Learning: A Practitioner’s Approach.
O’Reilly Media, Inc.
Paul et al., 2018.Paul, B., Sindy, L., Michael, F., David, S.,
and Carsten, S. (2018). Improving unsupervised de-
fect segmentation by applying structural similarity to
autoencoders. arXiv preprint arXiv:1807.02011.
Perera and Patel, 2019.Perera, P. and Patel, V. M. (2019).
Learning deep features for one-class classifica-
tion. IEEE Transactions on Image Processing,
28(11):5450–5463.
Racah et al., 2017.Racah, E., Beckham, C., Maharaj, T.,
Kahou, S. E., Prabhat, and Pal, C. (2017). Ex-
tremeweather: A large-scale climate dataset for semi-
supervised detection, localization, and understanding
of extreme weather events. In Advances in Neural In-
formation Processing Systems, pages 3402–3413.
Radford et al., 2016.Radford, A., Metz, L., and Chintala,
S. (2016). Unsupervised representation learning with
deep convolutional generative adversarial networks.
In ICLR2016.
Radovanovic and Ðukanovic, 2020.Radovanovic, D. and
Ðukanovic, S. (2020). Image-based plant disease de-
tection: A comparison of deep learning and classical
machine learning algorithms. In 24th International
Conference on Information Technology (IT).
Riley et al., 2002.Riley, M. B., Williamson, M. R., and
Maloy, O. (2002). Plant disease diagnosis.
Rodriguez et al., 1999.Rodriguez, P., Wiles, J., and Elman,
J. L. (1999). A recurrent neural network that learns to
count. Connection Science, 11(1):5–40.
Salimans et al., 2016.Salimans, T., Goodfellow, I.,
Zaremba, W., Cheung, V., Radford, A., and Chen, X.
(2016). Improved techniques for training gans.
Schlegl et al., 2019.Schlegl, T., Seebock, P., Waldstein,
S. M., Langs, G., and Schmidt-Erfurth, U. (2019).
f-anogan: Fast unsupervised anomaly detection with
generative adversarial networks. Medical Image Anal-
ysis, 54:30–44.
Schlegl et al., 2017.Schlegl, T., Seebock, P., Waldstein,
S. M., Schmidt-Erfurth, U., and Langs, G. (2017).
Unsupervised anomaly detection with generative ad-
versarial networks to guide marker discovery. In In-
ternational Conference on Information Processing in
Medical Imaging, pages 146–157.
Sharma et al., 2005.Sharma, G., Wu, W., and Dalal, E. N.
(2005). The ciede2000 color-difference rormula:
implementation notes, supplementary test data, and
mathematical observations. Color Research and Ap-
plication, 30(1).
Sutskever et al., 2008.Sutskever, I., Hinton, G., and Taylor,
G. (2008). The recurrent temporal restricted boltz-
mann machine. In Advances in Neural Information
Processing Systems 21 (NIPS 2008), pages 1601–
1608.
Tuor et al., 2017.Tuor, A., Kaplan, S., Hutchinson, B.,
Nichols, N., and Robinson, S. (2017). Deep learn-
ing for unsupervised insider threat detection in struc-
tured cybersecurity data streams. In Workshops at
the Thirty-First AAAI Conference on Artificial Intel-
ligence.
Vincent et al., 2008.Vincent, P., Larochelle, H., Bengio, Y.,
and Manzagol, P.-A. (2008). Extracting and compos-
ing robust features with denoising autoencoders. In
Proceedings of the 25th international conference on
Machine learning, pages 1096–1103.
Image-based Plant Disease Diagnosis with Unsupervised Anomaly Detection based on Reconstructability of Colors
119
Xiong et al., 2011.Xiong, L., Poczos, B., and Schneider,
J. G. (2011). Group anomaly detection using flexible
genre models. In NIPS2011, pages 1071–1079.
Zenati et al., 2018.Zenati, H., Foo, C.-S., Lecouat, B.,
Manek, G., and Chandrasekhar, V. R. (2018). Efficient
gan-based anomaly detection. In 6th International
Conference on Learning Representations (ICLR2018).
Zimek et al., 2012.Zimek, A., Schubert, E., and Kriegel, H.
(2012). A survey on unsupervised outlier detection in
high-dimensional numerical data. Statistical Analysis
and Data Mining, 5(5).
APPENDIX
CIEDE2000 Color Difference. The CIEDE2000
color difference is calculated by using the color space
L
∗
a
∗
b
∗
, which is suitable for expressing colors based
on human perception. The color difference is based
on three parameters: the lightness difference (∆L
0
),
chroma difference (∆C
0
) and hue difference (∆H
0
).
These are weighted by the functions (S
L
, S
C
, S
H
),
parametric weighting factors (k
L
, k
C
, k
H
), and rota-
tion term (R
T
). All parametric weighting factors were
set to k
L
= k
C
= k
H
= 1.
The CIEDE2000 color difference between two
points in the L
∗
a
∗
b
∗
color space (L
∗
1
, a
∗
1
, b
∗
1
) and
(L
∗
2
, a
∗
2
, b
∗
2
) is calculated as follows:
∆E
00
(L
∗
1
, a
∗
1
, b
∗
1
, L
∗
2
, a
∗
2
, b
∗
2
) =
r
∆L
0
k
L
S
L
2
+
∆C
0
k
C
S
C
2
+
∆H
0
k
H
S
H
2
+
R
T
∆C
0
k
C
S
C
∆H
0
k
H
S
H
(3)
The Python code used for implementing this for-
mula is available at https://github.com/scikit-image.
Further details and a derivation of the CIEDE2000
color difference equation are provided by (Sharma
et al., 2005).
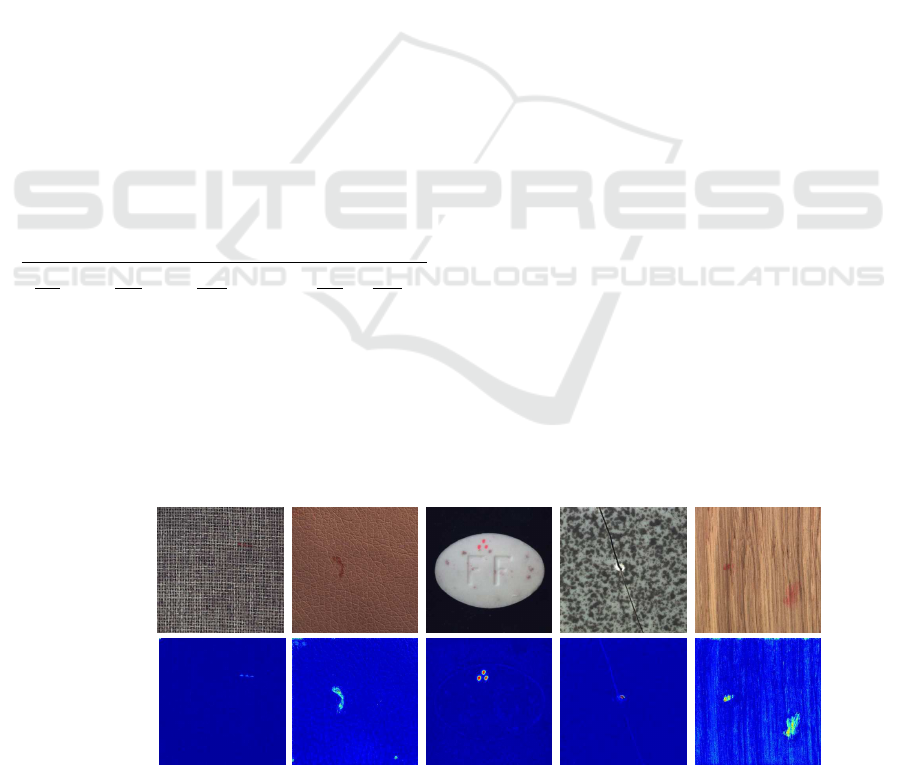
Application for MVTec Anomaly Detection
Dataset. We validated the effectiveness of our
anomaly detection method for industrial problems
by using the MVTec Anomaly Detection Dataset
(MVTec AD) (Bergmann et al., 2019). This is a
comprehensive dataset for benchmarking anomaly
detection methods with a focus on industrial ap-
plications. It contains 5,354 high resolution color
images of different object and texture categories
with annotated pixel-level ground-truth regions for
all anomalies. Fig. 7 shows examples of pixel-level
anomaly visualizations with the proposed method.
The top row shows the input images. We selected
five categories from MVTec AD whose anomalies
affect the color. The proposed method effectively
highlighted anomalies on industrial products.
Carpet Leather Pill Tile Wood
Input
Output
Carpet
Leather
Pill
Tile
Wood
Figure 7: Examples of pixel-level anomaly visualization with MVTec AD.
IMPROVE 2021 - International Conference on Image Processing and Vision Engineering
120
