
Integrating Population Surveys using Spatial Visual Analytics:
A Case Study on Nutrition and Health Indicators of Children under Five
in India
Harshitha Ravindra
1,2
and Jaya Sreevalsan-Nair
1,2 a
1
Graphics-Visualization-Computing Lab, International Institute of Information Technology Bangalore, Bangalore, India
2
E-health Research Center, International Institute of Information Technology Bangalore, Bangalore, India
Keywords:
Large-scale Surveys, Spatial Analysis, Visualization, Stunting, Wasting, Underweight, Anemia, Micronutrient
Deficiency, Immunization, Socioeconomic Factors.
Abstract:
Large-scale population surveys are beneficial in gathering information on the performance indicators of public
well-being, including health and socio-economic standing. However, conducting national population surveys
for low and middle-income countries (LMIC) with high population density becomes challenging. Economiz-
ing this activity, multiple surveys with different goals are decentralized and implemented by various agencies.
Some of the surveys tend to overlap in outcomes with spatial/temporal or both scopes. Mining data jointly from
surveys with significant overlap gives new insights while preserving their autonomy. We propose a three-step
workflow for integrating surveys using spatial analytic workflow supported by visualizations. We implement
the workflow on a case study using two recent population health surveys in India to study malnutrition in
children under five. Our case study focuses on finding hotspots and coldspots for malnutrition, specifically
undernutrition, by integrating both surveys’ outcomes. Malnutrition in children under five is a pertinent global
public health problem prevalent in India. Our work shows that such an integrated analysis is beneficial along
with preliminary analyses of existing national surveys to find new insights while maintaining their autonomy.
1 INTRODUCTION
Large-scale surveys are implemented to gather in-
formation about specific issues on the population.
Survey analysis provides time-tested mechanisms for
monitoring multi-dimensional indicators of political
units, such as countries, geographies, etc. In the
public health domain, health surveys are used for
public health outcome surveillance (Nsubuga et al.,
2006). Such surveillance involves quantitative anal-
ysis of total population health and indicators (Jacob-
son and Teutsch, 2012). However, despite the cen-
tral role surveys play in monitoring population trends,
implementing surveys is a complex problem owing to
the demographic and socio-economic variations in the
population, survey design for a multifaceted focus, di-
versity in handling data, decentralization of survey
administration in the field, decisions on publishing
data and outcomes, and finally, the economic and time
cost of implementing surveys. Hence, we increas-
ingly see that surveys are owned by various compe-
a
https://orcid.org/0000-0001-6333-4161
tent organizations who undertake them for specific re-
quirements. This leads us to the case of overlapping
surveys, as multiple surveys are implemented, with
a focus on different metrics but considerable simi-
larities (Berk et al., 2007). Integrating such overlap-
ping surveys is beneficial for gaining new knowledge,
e.g., multiple health surveys can be used to jointly es-
timate household wealth and expenditures while still
maintaining the length of the questionnaires by inte-
grating them (Morris et al., 2000).
Even though big data is gathered and analyzed
in surveys, the scope of reaping integrated benefits
from overlapping surveys becomes limited. It re-
quires centralized planning efforts before conducting
them. Such centralized activities reduce the degree of
the desired autonomy in survey implementation for
economic reasons in practice. There are primarily
two issues with integrating surveys during its design
and administration (Berk et al., 2007). Firstly, there
is a requirement of concerted effort to determine the
scope and extent of overlap between multiple surveys
to check the feasibility and benefit of such an inte-
Ravindra, H. and Sreevalsan-Nair, J.
Integrating Population Surveys using Spatial Visual Analytics: A Case Study on Nutrition and Health Indicators of Children under Five in India.
DOI: 10.5220/0010462102030213
In Proceedings of the 7th International Conference on Geographical Information Systems Theory, Applications and Management (GISTAM 2021), pages 203-213
ISBN: 978-989-758-503-6
Copyright
c
2021 by SCITEPRESS – Science and Technology Publications, Lda. All rights reserved
203

gration. Secondly, there is a requirement of efficient
government, which fosters such an integration, from
planning a survey to publishing its outcomes.
That said, integrating multiple surveys at the data
level is more promising, and integrating disparate data
sources has been widely practiced. For example, var-
ious sources of data, such as geographic information,
can be integrated with surveys (Cooper, 2020). One
can also link spatial data from surveys and databases
for the integration, e.g., health surveys and health
facility databases (Dotse-Gborgbortsi et al., 2020).
Since spatial and temporal information are essential
to population survey data, they are used for testing
the feasibility of direct integration of surveys. They
further provide the mappings between the surveys for
the implementation of the integration.
It is recommended that the data collection and
the reporting systems enable data sharing to improve
the adaptation of integrated surveys (Jacobson and
Teutsch, 2012). As an example, in India, the avail-
ability of raw data and reports of the National Family
Health Survey (NFHS) in the public domain, has im-
proved the uptake of several researchers working with
the data, compared to similar national surveys (Dan-
dona et al., 2016). The NFHS is favorably imple-
mented at the national scale at a higher frequency,
i.e., roughly once in 5 years, aligned with the world-
wide data collection efforts. The NFHS data can
be strategically used with other national and local
surveys to infer health and related socio-economic
factors, even though its focus is on maternal-child
health indicators. Hence, we choose to integrate
the NFHS-4 during 2015-16, the fourth edition of
NFHS (IIPS and MoHFW, 2016), and the Compre-
hensive National Nutrition Survey (CNNS) during
2016-18 (MoHFW, UNICEF and Population Council,
2019). These surveys are conducted by the Ministry
of Health and Family Welfare (MoHFW), Govern-
ment of India (GoI), and implemented by the Ministry
of Statistics and Programme Implementation (Mo-
SPI), GoI. MoSPI provides access to the demographic
survey outcomes. However, studies using the open
data have examined these surveys in a silo, based on
their specific individual goals. There is also prior
work on comparing these surveys, specifically (Rathi
et al., 2018), but not integrating them. An integrated
analysis of pertinent surveys can effectively reduce
the burden of conducting numerous surveys in a pop-
ulous middle-income country like India. Hence, our
goal is to demonstrate a proof-of-concept of a cross-
analysis. Our challenge here lies in the difference in
the granularity of the open data available in the two
chosen surveys, limiting our scope of directly inte-
grating them at the data level. We address this by us-
ing spatial statistics and visualizations.
We focus on mining information on various as-
pects of malnutrition for children under five, in In-
dia, through this integrated study. Under-five stud-
ies are concluding spatial heterogeneity in various
health indicators on malnutrition (Khan and Mohanty,
2018; Puri et al., 2020; Sharma et al., 2020), which
can be exploited. The interest in under-five stud-
ies is due to the persistence of childhood morbid-
ity and mortality in India, as per NFHS-4 (Dhirar
et al., 2018). Wasting has not reduced as much
between NFHS-3 and NFHS-4 findings as stunting.
In the weighted sample taken in CNNS, the preva-
lence of anemia is 40.5% amongst children under five,
with iron-deficiency anemia being the most preva-
lent type (Sarna et al., 2020). The nutritional de-
ficiency affects all age groups, but children under
five, particularly those with severe acute malnutrition
(SAM), have a higher mortality risk from common
childhood illnesses such as diarrhea, pneumonia, and
malaria (UNICEF, 2019). While the infant mortal-
ity rate (IMR) is at 41 per thousand live births, the
under-5-mortality rate (U5MR) is at 50. Childhood
undernutrition accounts for 45% of U5MR alone and
is a crucial public health issue in India. Dietary di-
versification is an additional solution apart from the
focus on infrastructure for food distribution and de-
livery by the government (Dhirar et al., 2018). There
is an emphatic call for more frequent health surveys
to be conducted to continuously monitor the progress
due to such nutrition programs and infrastructural im-
provement, motivating our integrated study.
A fine-grained analysis has been done on the oc-
currence of anemia, stunting, and incomplete immu-
nization in children aged 12-59 months, at district
and individual levels, using NFHS-4 data (Puri et al.,
2020). This study also showed the influence of mater-
nal education on the aforementioned outcomes at the
district level. There is also evidence that there is spa-
tial influence on poor sanitation, which is one of the
causes of stunting in India, where the extreme tem-
perature is a contextual correlate (Bharti et al., 2019).
We use these analyses of the concerned surveys for
identifying contextual factors of malnutrition.
Our novel contribution is in using visual analytics
with spatial context for integrating surveys, namely
NFHS-4 and CNNS in India, for under-five child
malnutrition study. Visual analytics is a data anal-
ysis workflow where one uses visualization to pro-
vide the feedback loop along with other data mining
methods (Keim et al., 2008). We propose a three-
step workflow of (i) using state-wise differences for
determining the feasibility of survey integration, (ii)
a region-based study to identify variables for inte-
GISTAM 2021 - 7th International Conference on Geographical Information Systems Theory, Applications and Management
204

gration, and (iii) finding spatial clusters for survey
integration outcomes. For (i), we use descriptive
statistics, in addition to map-based visualizations of
state-wise counts of affected children U5, distribution
counts, and distribution distances between surveys.
Once the feasibility of integrating surveys is estab-
lished, we identify appropriate variables and factors
for the integration. Thus, for (ii), we use circular radar
plots to investigate the region-wise trends of variables
that are not common in both surveys. We also iden-
tify the contextual factors, e.g., sanitation facilities,
maternal literacy, using literature surveys. We take
care that the variable and contextual factors are from
different surveys for the sake of integration of the two
surveys. Using these selected variables and factors,
we achieve (iii) through spatial statistical analysis us-
ing global Moran’s I and bivariate LISA (Local In-
dicators of Spatial Association) using local Moran’s
I. The results of the integrated study are the spatial
clusters based on the significance of selected indica-
tors and contextual factors from both surveys.
2 METHODOLOGY
Spatio-temporal metadata is familiar to our selected
surveys, and appropriate aggregation can alleviate the
differences in the spatial granularity of open data
and minor overlap of its time-periods in the surveys.
Hence, our integration method is driven predomi-
nantly by spatial analysis. Our proposed workflow be-
gins with determining integration feasibility and then
follows up with determining variables and spatial sta-
tistical methods for integration. Given the complex-
ity of the data in such large-scale surveys, visualiza-
tions enable a qualitative understanding of the spatial
trends. Thus, we propose a spatial visual analytic ap-
proach for survey integration for identifying high-risk
regions in India for under-five child malnutrition in
our case study.
Data: NFHS-4, 2015-16 provides information on
population, health, and nutrition for women, men, and
children under five for all districts in all states and
union territories in India. The International Institute
for Population Sciences (IIPS), Mumbai, is the nodal
agency for conducting different rounds of the survey.
CNNS, 2016-18 is the largest exhaustive nutri-
tion survey including micro-nutrients conducted for
the first time in India, led by UNICEF and Population
Council, New Delhi. This survey is focused on all
children, i.e., population under 18 years of age.
Both surveys overlap in the coverage of nutrition
indicators of children under five. The summary anal-
Table 1: Metadata and overall descriptive statistics (mean
µ and standard deviation σ within the corresponding re-
spondents) of selected indicators and contextual factors,
and available distribution data on severity with given labels,
from NFHS-4 and CNNS, for children under five (U5).
NFHS-4 CNNS
#Respondents 601,509 112,100
(total) households children
#Children (U5) 259,628 40,700
Survey Time 2015-16 2016-18
Granularity Household State
of available data
Indicators for children (U5): Undernutrition in µ(σ)
Stunted 32.23 (7.40) 30.27 (6.80)
Wasted 18.30 (5.40) 14.56 (5.43)
Underweight 28.00 (9.90) 26.50 (9.13)
Anemic 42.36 (10.61) 34.06 (10.94)
Micronutrient Deficiency
Folate 7 24.98 (21.21)
Low Serum 7 32.27 (16.64)
Ferritin
Vitamin A 7 17.03 (9.83)
Vitamin B12 7 10.93 (6.74)
Vitamin D 7 15.78 (13.49)
Zinc 7 18.39 (7.81)
Indicators for Children (U5): Distribution Data
Stunted —— [“not severe”, “severe”] —–
Wasted —— [“not severe”, “severe”] ——
Underweight —— [“not severe”, “severe”] ——
Anemic - [“mild”, “moderate”, “severe”] -
Indicators for Children (U5): Immunization in µ(σ)
No/Partial 35.94 (14.00) 7
Immunization
BCG 90.93 (08.08) 7
DPT 79.17 (11.59) 7
Fully 64.06 (13.90) 7
Immunized
Hepatitis B 64.64 (13.80) 7
Measles 80.66 (11.51) 7
Polio 74.05 (11.06) 7
Contextual Factors in Mean (SD)
Maternal 27.06 (12.03) 7
Illiteracy
Sanitation 43.77 (20.15) 7
(Unimproved)
ysis reports have been published for both surveys, and
the raw anonymized household-level data is available
for the NFHS-4. The data and indicators that we use
for our case study using NFHS-4 and CNNS surveys
are listed in Table 1. While the relevant indicators
for undernutrition are present in both surveys owing
to their respective scope and goals, certain variables
are covered in only one of the two. Our goal is to
correlate variables across the two surveys spatially.
Scope of Our Study: The focus of our case study
is on under-five child malnutrition as recorded in
the NFHS-4 and CNNS. We find potential indicators
and contextual factors for identifying high-risk re-
Integrating Population Surveys using Spatial Visual Analytics: A Case Study on Nutrition and Health Indicators of Children under Five in
India
205

gions of under-five child malnutrition using integrated
data mining from both surveys. The integration is at
the state-level, given the coarsest granularity of data
available in both surveys. Since the indicators for un-
dernutrition conditions, except anemia, are available
for sub-groups (Table 1) based on gender and urban-
ization, we use this additional information to study
distributions of specific populations. Our proposed
spatial analysis, inclusive of visualizations, validates
the choice of variables used in the integrated study.
Method: Our three-step workflow consists of feasi-
bility check, choosing variables for integration, and
integration using spatial correlation and clustering.
Given the difference in the scope and goals, imple-
mentation, and time-frame of the surveys, we first
check the feasibility of integrating them. The time-
frame difference is not highly significant here, given
that population surveys in consecutive years will not
yield considerable differences. However, since there
is a difference in the survey implementation, includ-
ing population sampling, and differences in publish-
ing data, we undertake the feasibility test.
For the feasibility test, we first visually check if
the state-wise sample distributions for both surveys
are equivalent and check them against the state-wise
population distribution latest official census taken in
2011 in the states. The region-wise grouping of the
thirty states and distribution of sample population
covered in the surveys are shown in Figure 1, (A)
and (B), respectively. We use visualization in addi-
tion to quantitative analysis, as visualizing state-wise
discrepancies provides a look-up to explain the differ-
ences we see in the indicators given in both surveys.
Step-1: To complete the feasibility test, we identify
the common indicators from both surveys. In addition
to their absolute count, both the surveys have data of
the discrete probability distributions of the severity
of each of the malnutrition conditions, namely,
stunting, underweight, wasting, and anemia. Except
for anemia, we also have data available in the gender-
and urbanization-based sampled groups, in addition
to the total population. Hence, we find distribution
distances for each group using Hellinger distance
(HD) to quantify the similarity between the indicators
across the two surveys. The HD between two discrete
distributions P and Q, D
HD
(P, Q), is given as:
D
HD
(P, Q) =
1
√
2
.||
√
P −
√
Q||
2
.
We choose HD owing to its properties of symme-
try and being a bounded metric with the support [0.0,
1.0], where D
HD
= 0 means highly similar distribu-
tions, and D
HD
= 1, highly dissimilar. These prop-
erties enable comparisons of the HD distances across
states, where the HD is computed per state between
distributions across surveys.
Another important HD property is that it follows
the triangle inequality property, which implies that the
HD between the two empirical discrete probability
density distributions is not greater than the HD be-
tween each of the discrete distribution and the actual
parameterized distribution. Thus, the use of HD en-
sures the comparison of the lower bound of distances
here. We compute the HD distances between distribu-
tions of [non-severe, severe, absence] for each malnu-
trition condition in the two surveys. We compute dis-
tances for selected group (female, male, urban, rural),
wherever applicable, as well as the for the total pop-
ulation, e.g., we find the HD of distribution of [non-
severe, severe, absence] of stunting for female chil-
dren under five, given in percentages, between NFHS
and CNNS data (Figure 2, first row, (a)).
Unlike other undernutrition conditions, the data
for anemia in the CNNS report is both sparse and at
the coarser level. Hence, we use pie-chart glyphs in
maps to visualize the relative distribution of the sever-
ity of anemia in different states and compare the sur-
veys’ distributions.
Step-2: The second step in our workflow is the vari-
able selection for the integrated analysis of surveys.
Given the spatial local heterogeneity in undernutri-
tion (Khan and Mohanty, 2018; Sharma et al., 2020)
in India, we study the region-based trends in vari-
ables exclusive to each of the surveys. We use the
immunization status from NFHS-4 and micronutrient
deficiency from CNNS. The immunization status in-
cludes the percentage of children under five complet-
ing [BCG, DPT, Hepatitis B, Measles, Polio] vaccina-
tions and achieving fully immunized status. The mi-
cronutrient deficiency includes the percentage of chil-
dren under five with deficiencies in [folate, low serum
ferritin, vitamin A, vitamin B12, vitamin D, Zinc].
Higher percentages for immunization status and lower
percentages for micronutrient deficiencies imply bet-
ter health indicators for children under five in the re-
gion. Since the variable analysis is for choosing a
variable for integrating surveys, we use visualizations
using a circular radar plot for qualitative comparisons.
We choose a circular plot to visually represent per-
centage data. The choice of radar plot is owing to its
compactness, where a region-wise radar plot has each
spoke or axis representing a state in the region.
Step-3: The third step in our workflow is the inte-
grated analysis using spatial correlation using global
Moran’s I and localized cluster maps using bivariate
LISA (Local Indicators of Spatial Association)
computed using local Moran’s I (Anselin, 1995).
GISTAM 2021 - 7th International Conference on Geographical Information Systems Theory, Applications and Management
206
Stun�ng
Was�ng
Underweight
0.0 7.1 14.3 21.4 28.5 35.7 48.1
0.0 16.2 18.8 21.4 24.0 26.6 29.2
0.0 7.1 14.3 21.4 28.5 35.7 47.4
Jammu
& Kashmir
Himachal
Pradesh
Punjab
Uttarakhand
Haryana
Rajasthan
Gujarat
Madhya
Pradesh
Delhi
Uttar
Pradesh
Bihar
Jharkh-
and
West
Bengal
Odisha
Andhra
Pradesh
Telangana
Tripura
Karnataka
Maharashtra
Chhatti
s
garh
Goa
Kerala
Arunachal
Pradesh
Assam
Meghalaya
Manipur
Nagaland
Mizoram
Sikkim
Tamil
Nadu
Andaman & Nicobar
(A)
(C)
NFHS-4
CNNS
(%)
Occurrence Low Medium High
Low Medium High
Low Medium High
(B)
NFHS-4, 2015-16
CNNS, 2016-18
Census, 2011
Ra�o (in %age) of state-wise
samples/popula�on to
na�onal samples/popula�on
2
4
6
8
10
12
14
16
18
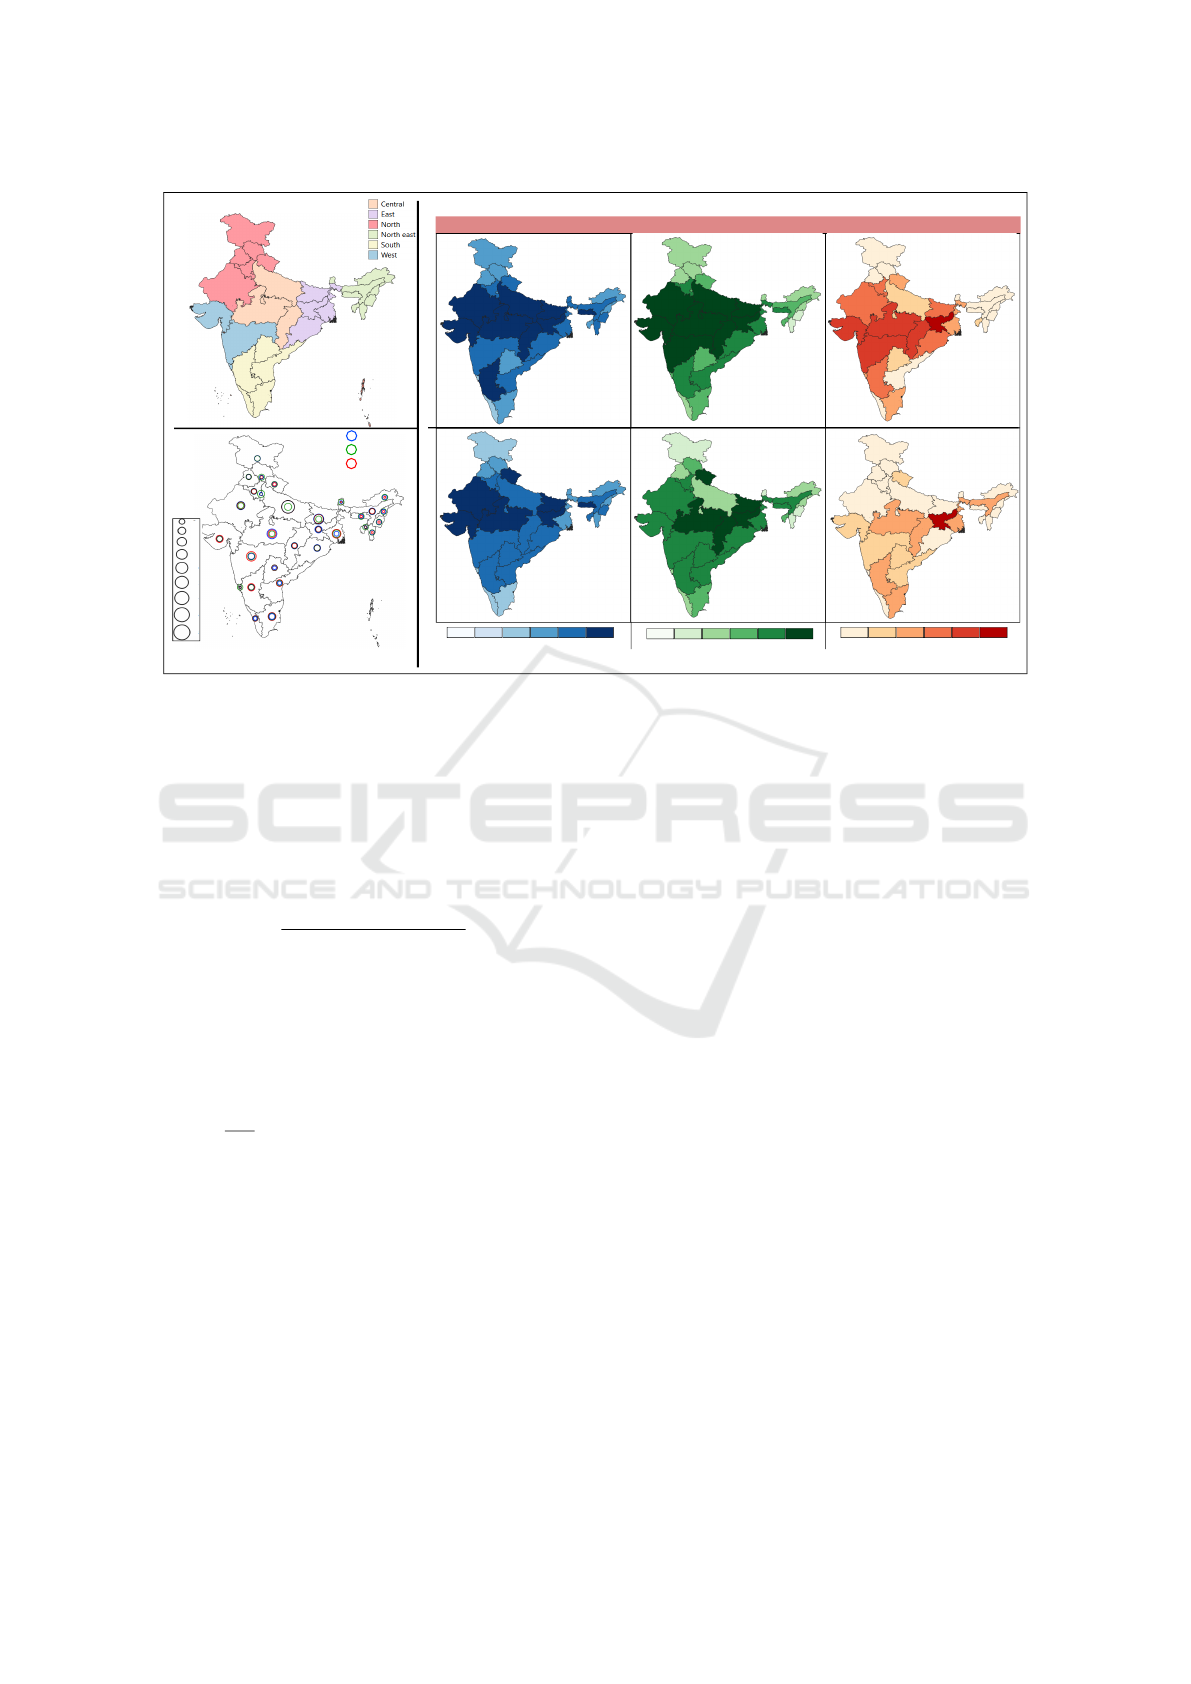
Figure 1: Data from the selected surveys. (A) Region-wise grouping of states in the political map of India. (B) Comparison of
sampled population distribution for NFHS-4 and CNNS using ratios of state-wise count with respect to the that of the country,
against baseline ratios using the population size from Census 2011, using percentage format. (C) Percentage of children under
five who are stunted, wasted and underweight across all states in India, as reported by the surveys.
We perform the spatial correlation analysis of the
indicators common to both surveys and the variables
identified in Step-2. Moran’s I is a weighted corre-
lation coefficient, where the weights are provided
based on spatial locations of the entities, given by:
I =
N
∑
N
i=1
∑
N
j=1
w
i j
.(x
i
−¯x)(x
j
−¯x)
∑
N
i=1
∑
N
j=1
w
i j
.
∑
N
i=1
(x
i
−¯x)
2
.
where N is the number of observations, ¯x is the mean
of the variable x, x
i
and x
j
are the values of x at loca-
tions i and j, respectively, and w
i j
is a weight index-
ing location i with respect to location j. We com-
pute the Moran’s I for each common indicator be-
tween its values from both the surveys, using states
as observations. Moran’s I values significantly less
than τ =
−1
N−1
imply negative spatial autocorrelation,
and significantly higher than τ imply positive spa-
tial autocorrelation. Moran’s I values transformed to
z-scores, and its p-value provides information about
spatial clustering and statistical significance, respec-
tively. (p-value < 0.05) implies the variable is sta-
tistically significant in rejecting the null hypothesis
that the spatial distribution of features is an outcome
of random spatial processes. A positive z-score indi-
cates more spatially clustered patterns, and a negative
z-score indicates more spatially dispersed patterns.
We use bivariate LISA to identify the high-risk
(hotspots) and the low-risk (coldspot) regions. These
values are computed between each of the common
undernutrition indicators in both surveys, identified
in Step-1. We then identify high-risk and low-risk
regions with the indicator selected from Step-2 and
corresponding contextual factors determined from the
literature survey. We ensure that the indicator and
its corresponding contextual factor are not from the
same survey. We make inferences from these identi-
fied hotspots and coldspots.
3 RESULTS
We have used Python 3.0 implementation with the
Scipy package for computing HD. The map-based vi-
sualizations have been generated using QGIS version
3.8.3, the circular radar charts using R, and the spatial
autocorrelation and cluster maps using GeoDa 1.14.
Step-1: Implementing our proposed workflow in our
case study of integrated analysis of NFHS-4 and
CNNS for malnutrition in children under five in India,
we first evaluate the feasibility of such a study. We
observe that the statistical descriptors of stunting, un-
derweight, and wasting are comparable (Table 1), but
there are state-level variations across surveys for the
percentage of occurrence of these malnutrition con-
ditions (Figure 1,(C)). We observe that NFHS-4 cap-
tures more regions for the high-occurrence of each of
these conditions than CNNS, especially in the west
Integrating Population Surveys using Spatial Visual Analytics: A Case Study on Nutrition and Health Indicators of Children under Five in
India
207
Female
Male
Urban
Rural
Total
a.
b.
c.
d.
e.
0.000
0.016
0.032
0.048
0.064
0.080
0.122
Stun�ng
Hellinger Distance
0.000
0.030
0.060
0.090
0.120
0.149
0.179
a.
b.
c.
d.
e.
Underweight
Female
Male
Urban
Rural
Total
Hellinger Distance
Was�ng
0.000
0.031
0.061
0.092
0.123
0.154
0.184
Female
Male
Urban
Rural
Total
a.
b.
c.
d.
e.
Hellinger Distance
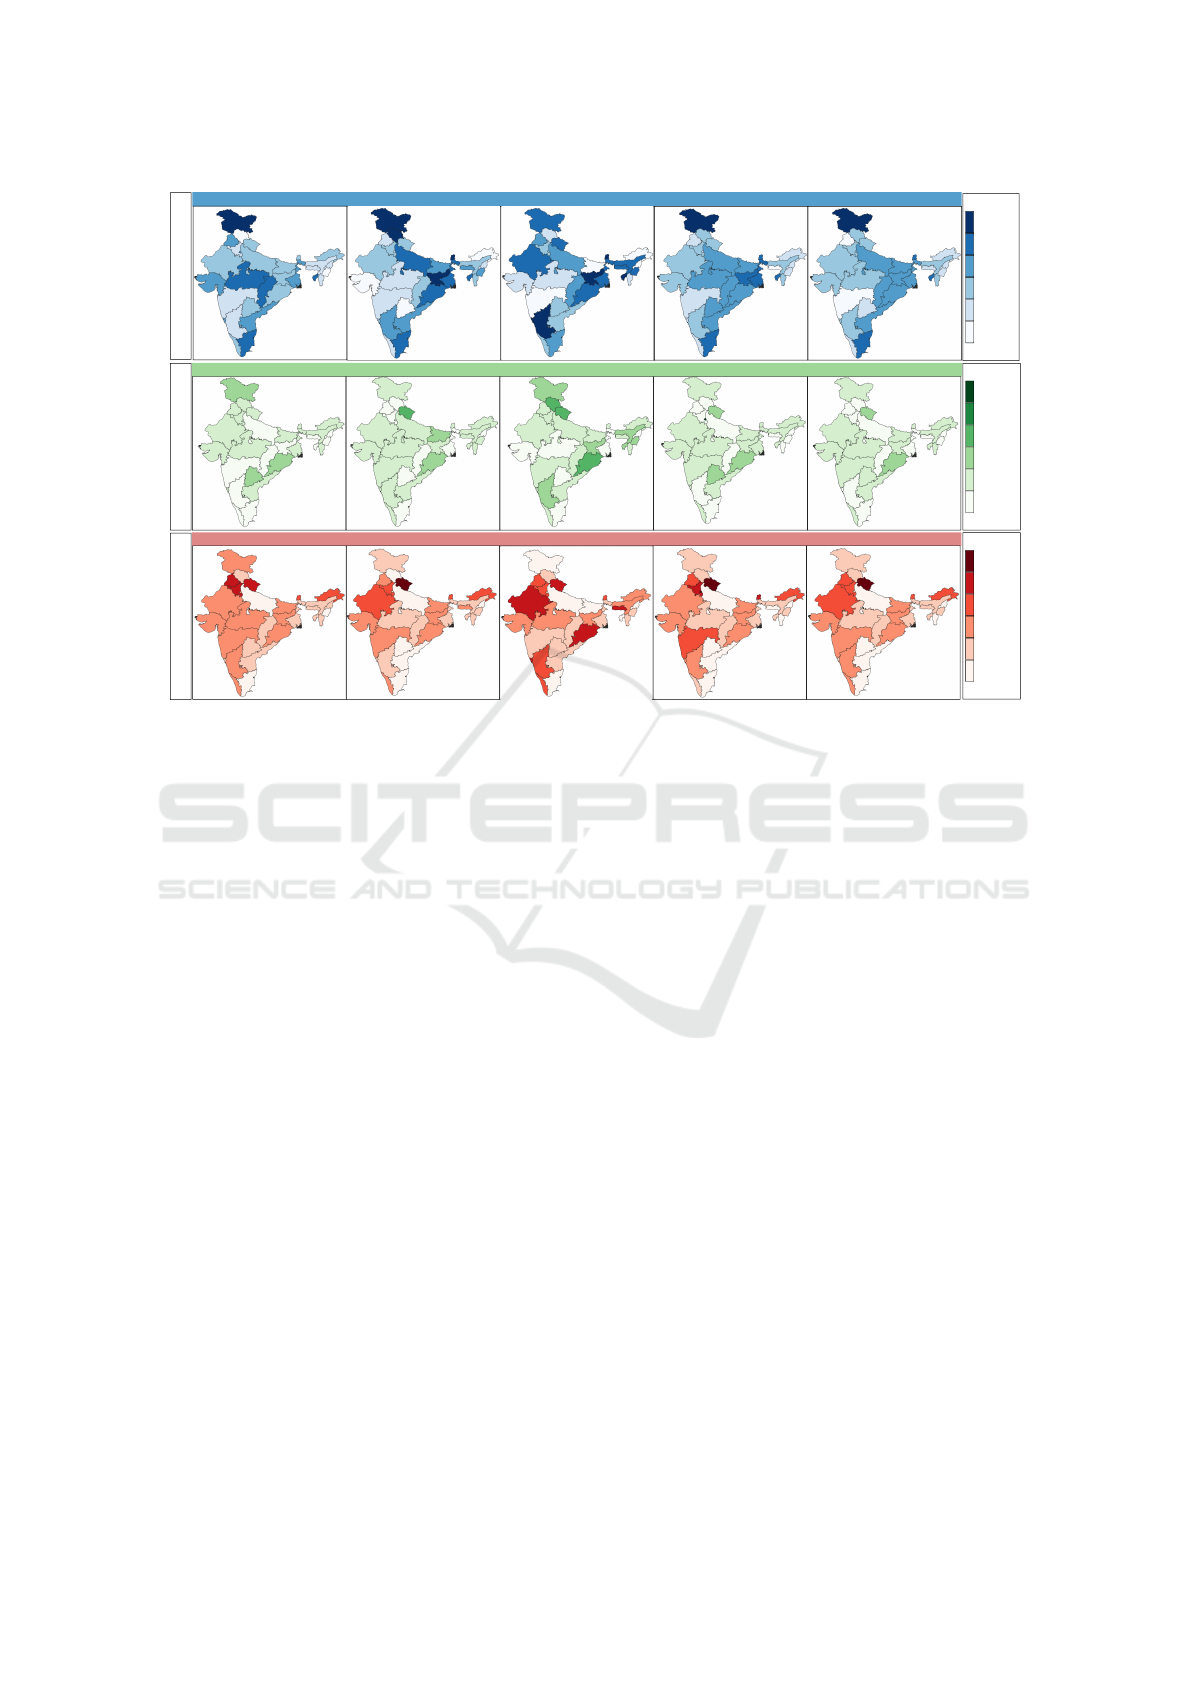
Figure 2: Hellinger distance between discrete probability distribution of different levels of severity [non-severe, severe,
absence] of different undernutrition conditions, namely, stunting, underweight and wasting in children under five in the states
of India. The distances are computed for different populations of the children, namely, female, male, urban, rural and total.
and central regions. The low-occurrence states are
captured more accurately across both surveys. These
variations in medium- and high-occurrence states can
be attributed to the differences in sampling, survey ad-
ministration, data processing, reporting, and sampling
(Figure 1,(B)) across the states. But still, we need a
fine-grained analysis to improve the feasibility of our
study. Hence, we use the distribution of different lev-
els of severity of stunting, underweight, and wasting
occurring in sub-populations of children under five.
This additional information is used for computing
state-wise Hellinger distances (HD) between the in-
dicators from the surveys, which are visualized using
choropleth maps in Figure 2. Here, we observe that
the state-wise variations are low, as the HDs are lower
than 0.184 overall, much lower than the upper bound,
1.0. We observe that isolated states show relatively
higher HDs, namely Jammu & Kashmir for stunting
and Uttarakhand for wasting, across all five popula-
tion groups. This could also be attributed to the lesser
number of samples from these regions.
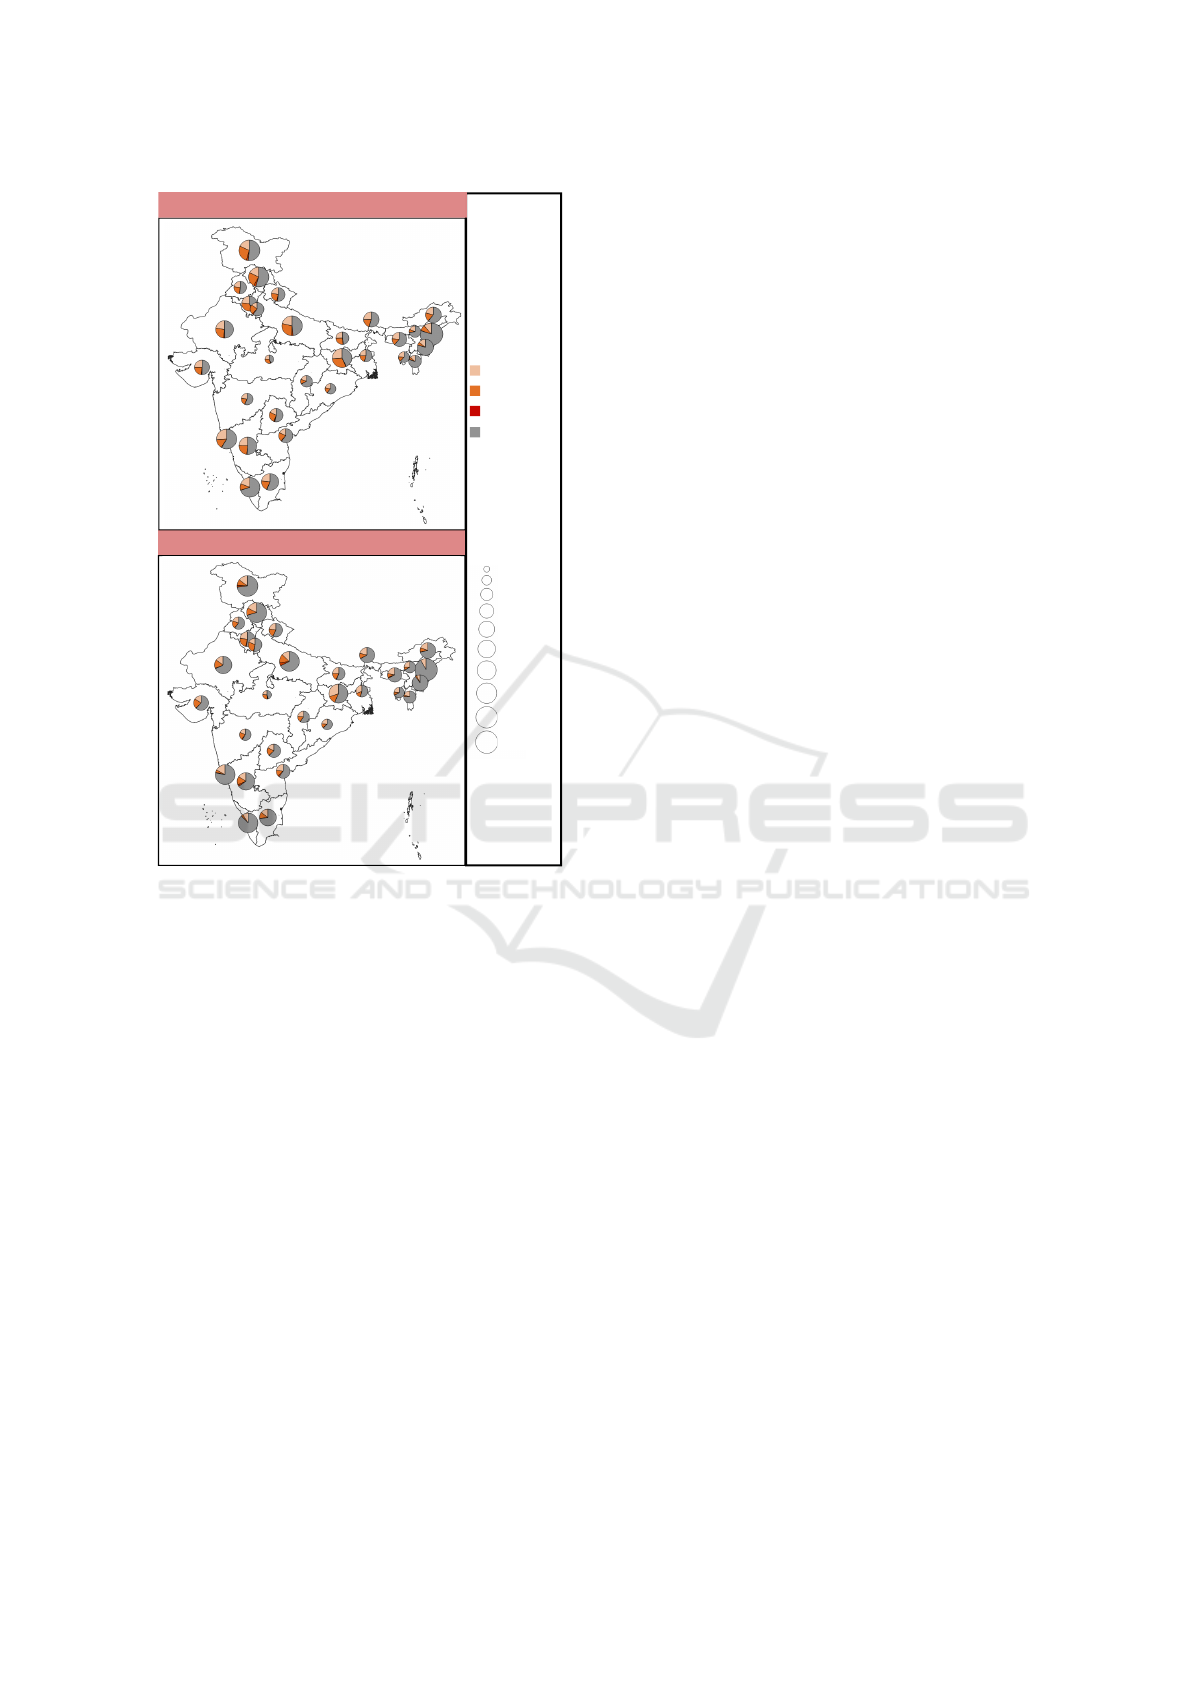
When we consider the data for anemia in Figure 3,
we observe from the pie-chart glyph sizes that the oc-
currence of anemia in each state is similar across the
surveys. However, we also observe differences in the
distribution of severity of anemia occurring in differ-
ent states, as seen in the pie-chart glyphs themselves.
We do not see salient differences in counts for oc-
currence of severe-anemia owing to its lesser preva-
lence. The differences in the prevalence of mild- and
moderate-anemia across surveys could be attributed
to the lack of information on the population size on
which percentages have been computed in the CNNS.
Overall, we now conclude that the distribution of
the indicators has strong similarities across NFHS-4
and CNNS, thus, making our study feasible.
Step-2: In order to identify indicators and contex-
tual factors across surveys for integrated analysis, we
choose immunization record and micronutrient de-
ficiency for indicators of children under five, and
maternal illiteracy and poor sanitation facilities for
contextual factors (Bharti et al., 2019; Puri et al.,
2020). The circular radar plots of region-wise val-
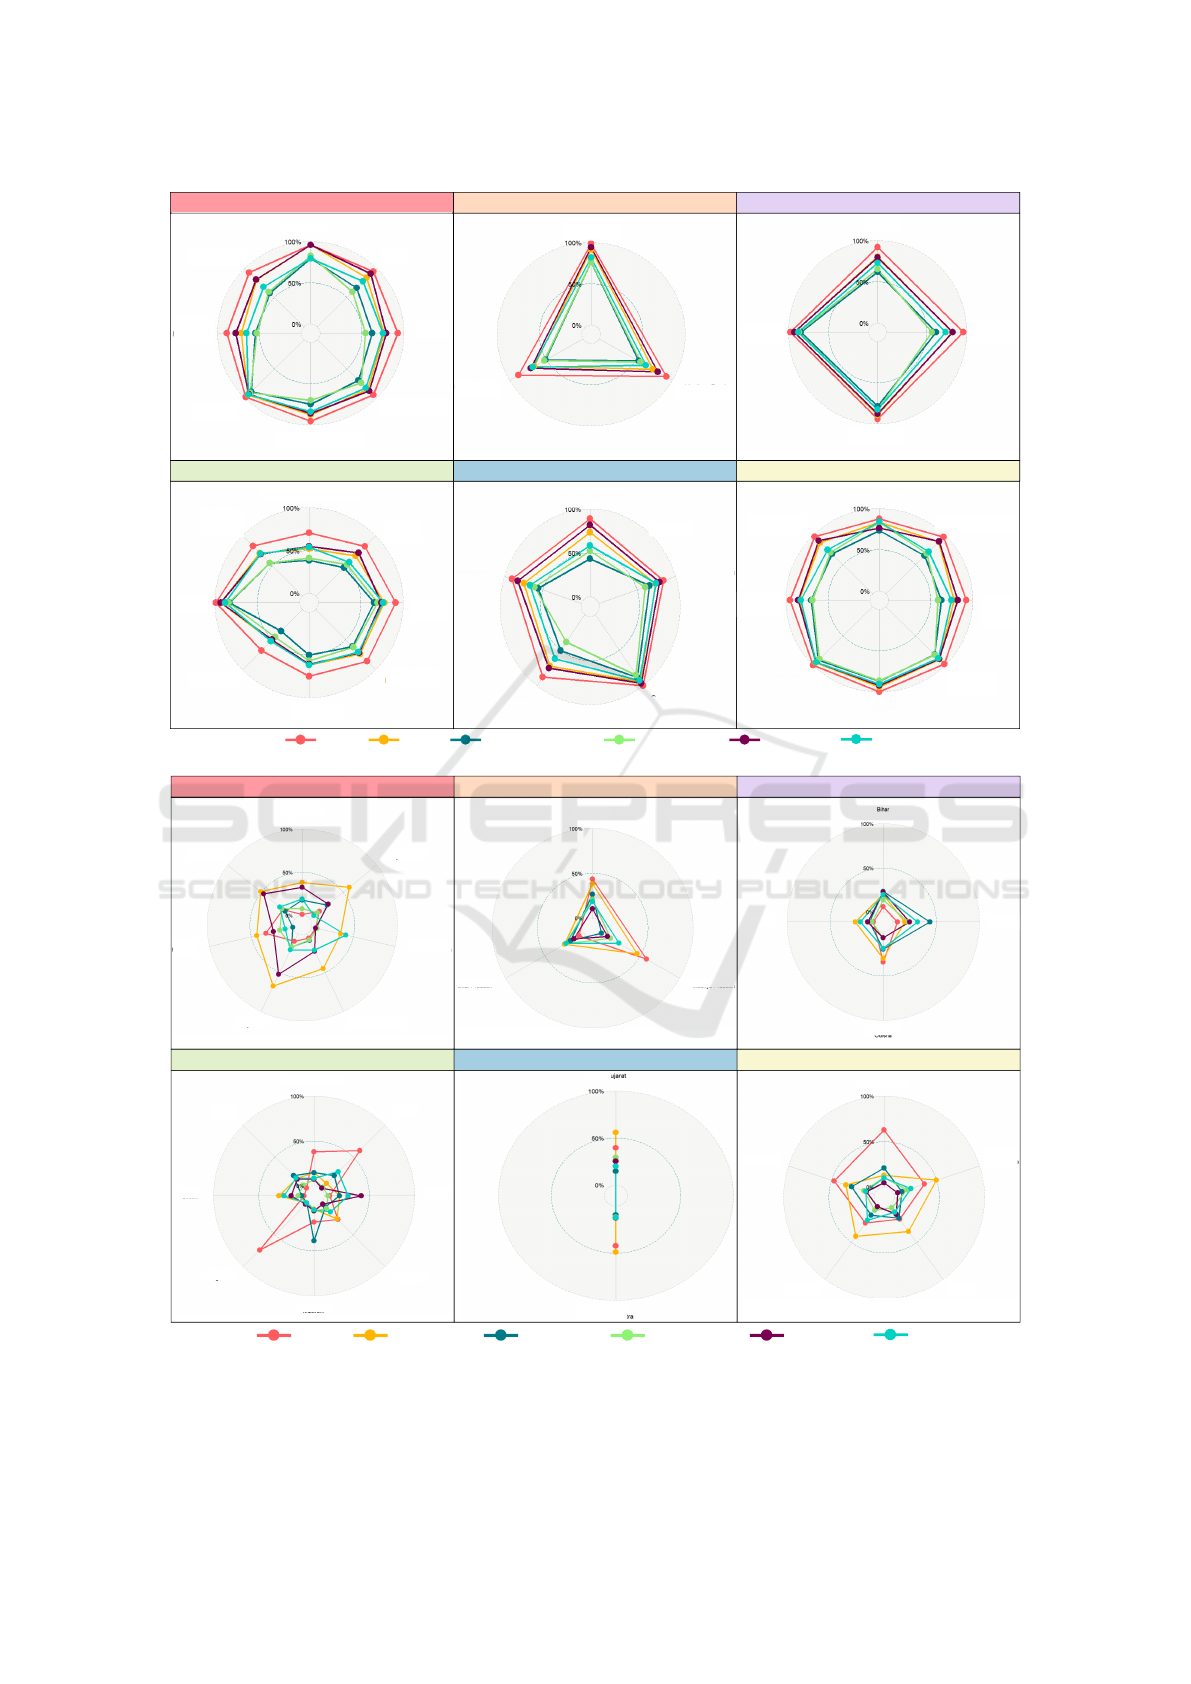
ues of the indicators (Figure 4 demonstrate that there
is predominantly uniform coverage of immunization
in states in each region, whereas micronutrient defi-
ciency shows spatial local heterogeneity even within
regions. We observe spatial local heterogeneity from
the non-uniform patterns in each region, e.g., there is
pronounced deficiency in folate in Assam and Naga-
land in the north-east, in Andhra Pradesh in the south,
and Madhya Pradesh in the central regions. A sig-
nificant deficiency in low serum ferritin, which is a
primary cause of iron-deficient anemia, is observed in
Haryana and Punjab in the north and Karnataka in the
southern regions.
GISTAM 2021 - 7th International Conference on Geographical Information Systems Theory, Applications and Management
208
NFHS-4
CNNS
Mild
Moderate
Severe
Not-
Anemic
0.213
0.20
0.18
0.16
0.14
0.12
0.10
0.08
0.06
0.04
Ra�o of state-wise
samples/popula�on
to na�onal samples/
popula�on
Figure 3: Pie-chart glyphs in map visualization of discrete
probability distribution of different levels of severity [mild,
moderate, severe, absence] of anemia in children under five
in the states of India, where the glyph size is proportional to
the fraction of children suffering from anemia relatively in
each state of the country.
Overall, we observe high inter-region but low
intra-region heterogeneity in immunization for chil-
dren under five, as per NFHS-4, and high inter- and
intra-region heterogeneity in micronutrient deficiency
for children under five, as per CNNS. Hence, we use
micronutrient deficiencies for indicators in our inte-
grated study. Maternal illiteracy is a contextual fac-
tor for malnutrition, in general, and poor sanitation is
commonly cited for stunting. The data for both con-
textual factors are available in the NFHS-4 (Table 1).
Step-3: Our integrated analysis of surveys is based
on spatial statistics. The global Moran’s I statis-
tics for spatial autocorrelation between common in-
dicators in both surveys for stunting, underweight,
wasting, and anemia are given along with the bi-
variate LISA cluster maps in Figure 5. For N=30
(states), we get τ = −0.034. Thus, we see here that
there is low spatial heterogeneity, which is statisti-
cally significant, for stunting, underweight, and wast-
ing. The low spatial heterogeneity validates the sim-
ilarity of indicators for the indicators corresponding
to these conditions across the surveys, seen in the
Hellinger distance maps (Figure 1,(C)). The spatial
auto-correlation results for anemia show more spa-
tial outliers (Figure 5,d.) than the other undernutri-
tion conditions. This result validates the higher dif-
ferences observed in anemia indicators between the
surveys (Figure 3), compared to the other conditions
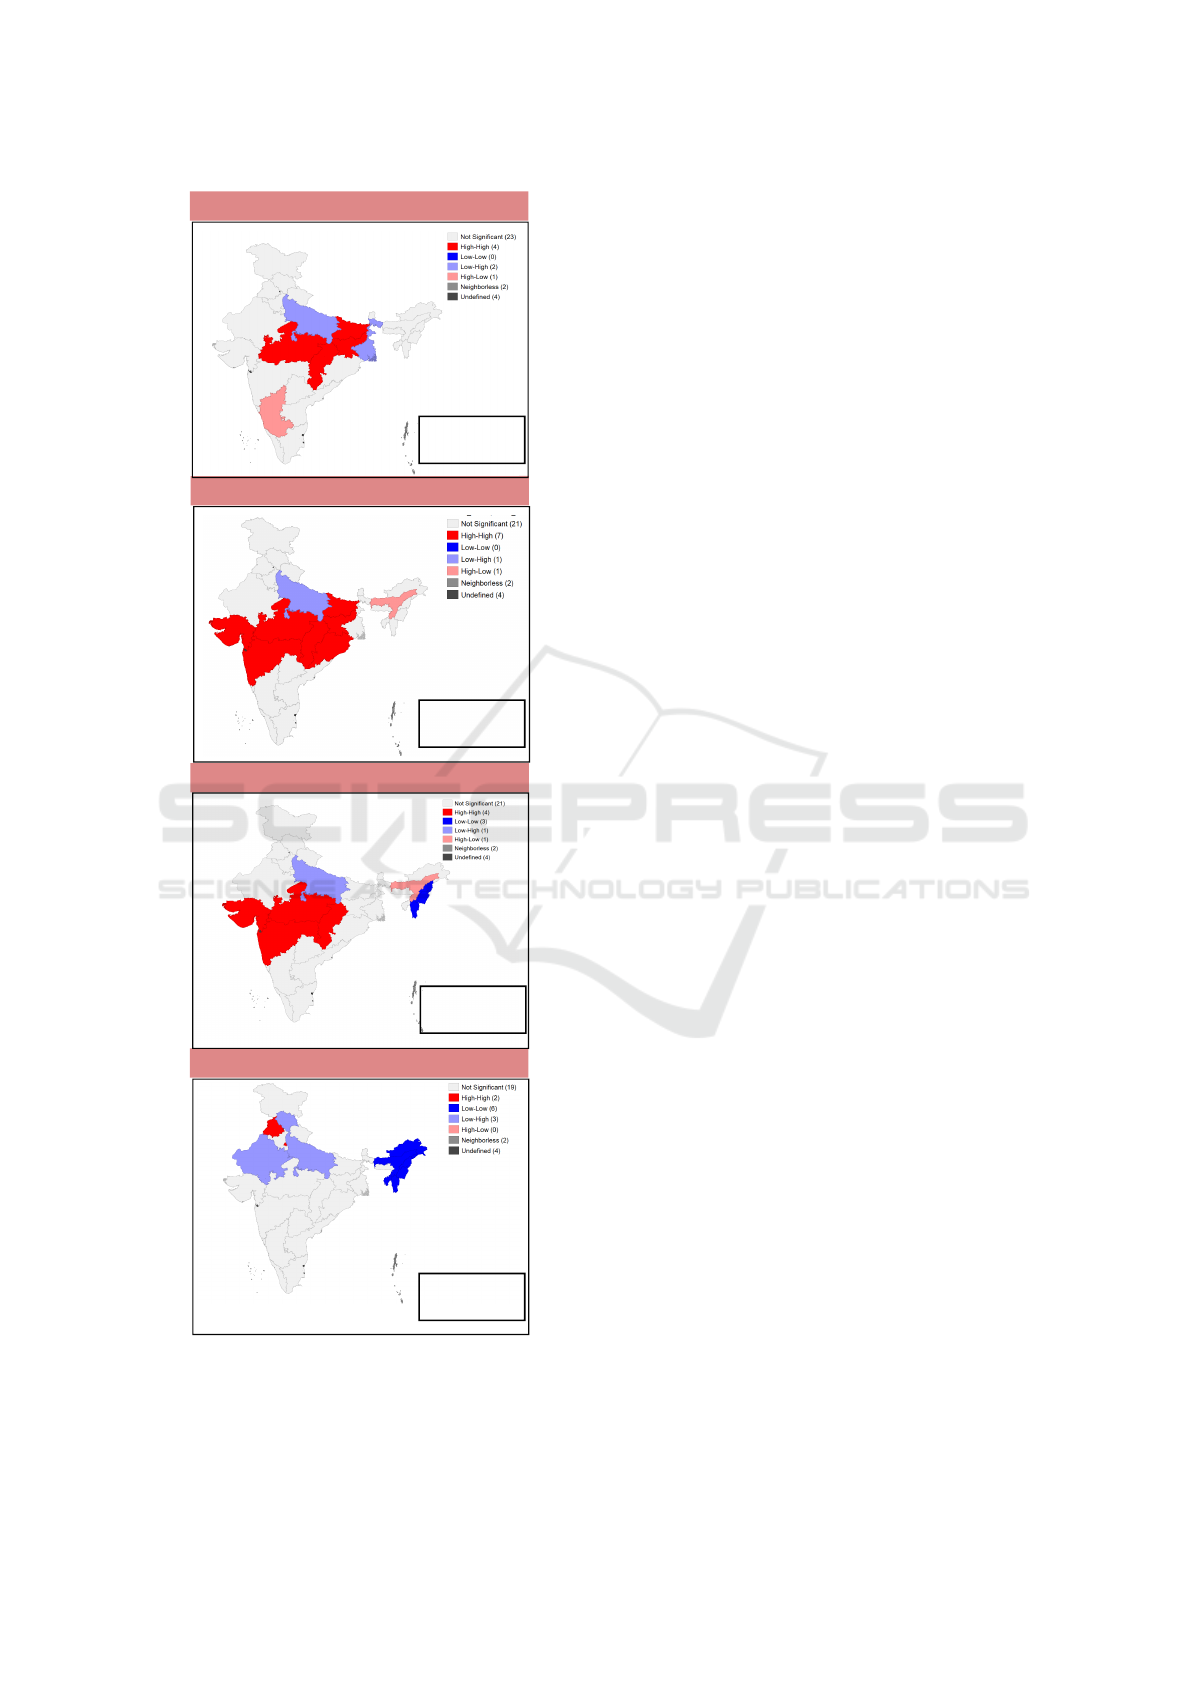
(Figure 2). We observe high-high clusters in central
and western regions (Figure 5, a.-c.), which may be
attributed to the disparity in sampling (Figure 1,(B)).
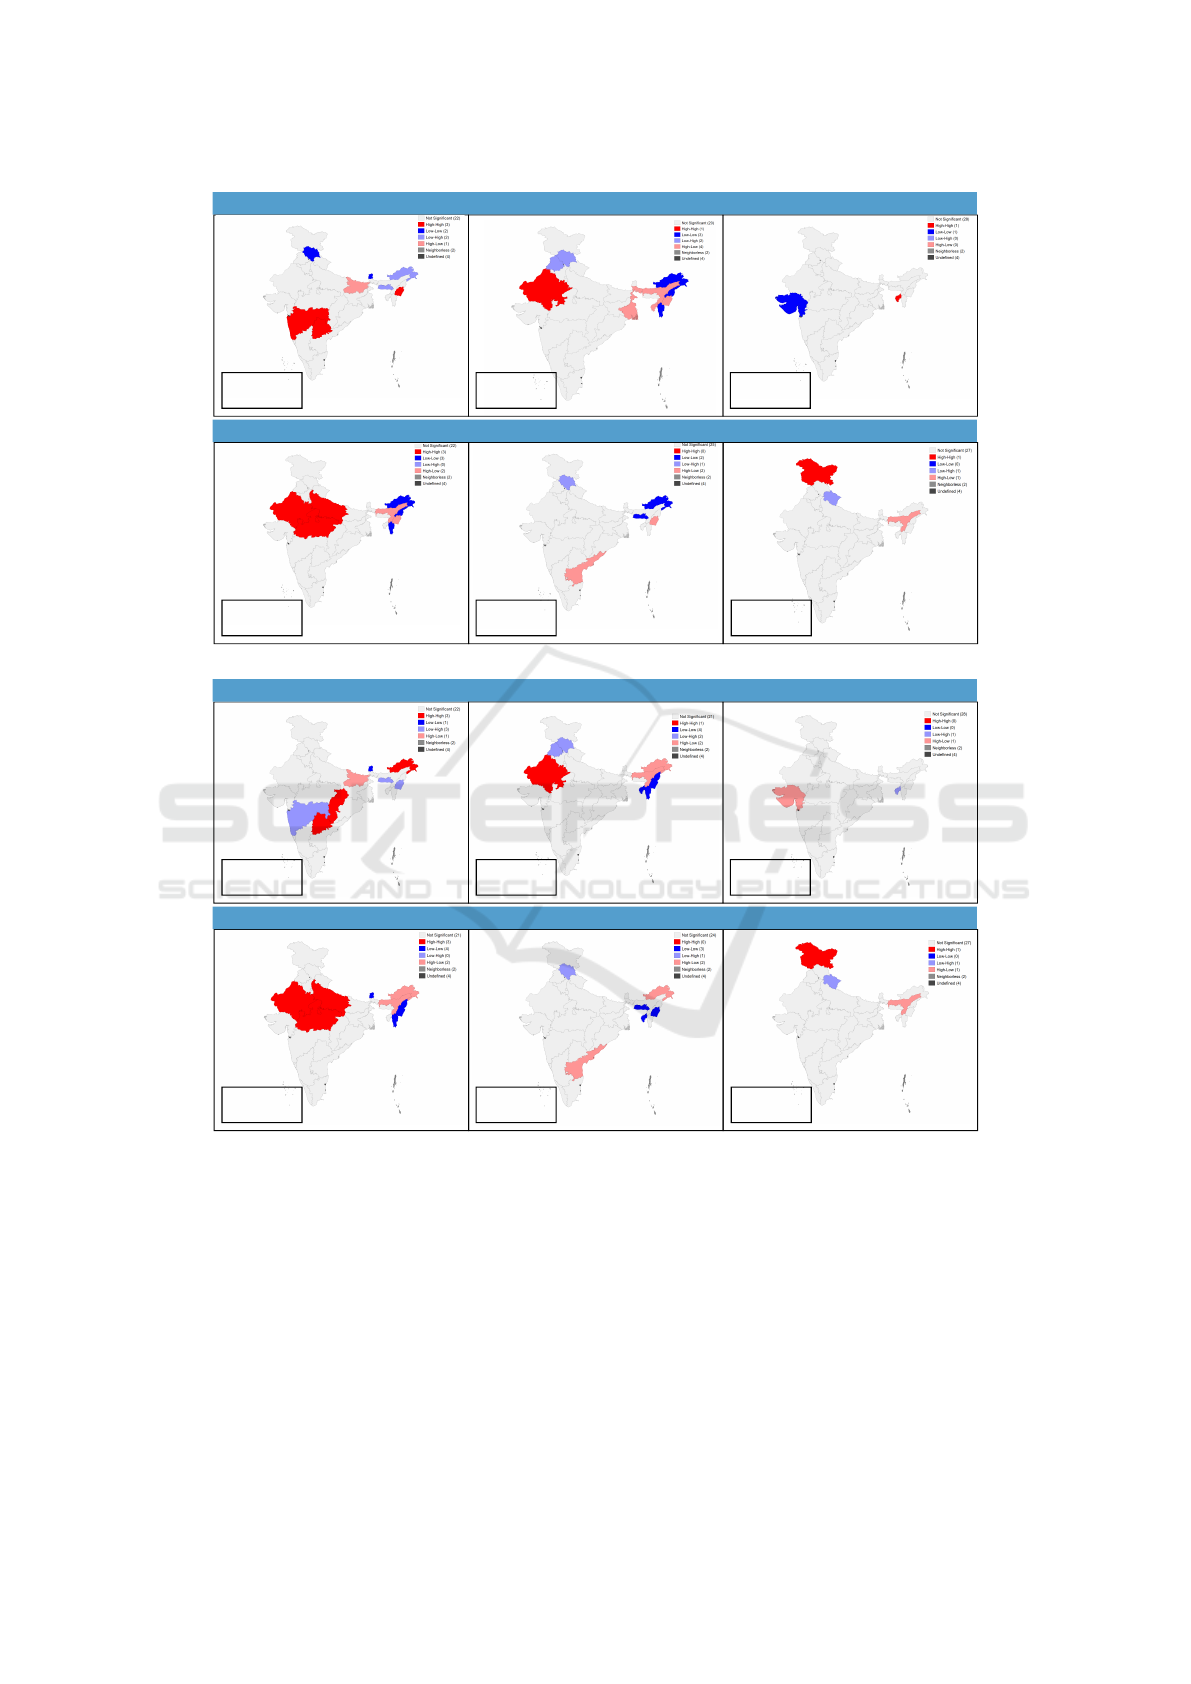
The bivariate LISA cluster maps for spatial corre-
lation between an indicator and contextual factor are
given in Figure 6. The hotspots are the high-risk re-
gions when both an indicator and contextual factor
have high values, i.e., high-high. Bivariate LISA be-
tween unimproved sanitation and micronutrient defi-
ciency (Figure 6,(A)) show high-risk clusters in the
western region for folate, Rajasthan for low serum
ferritin, large parts of northern-central regions for vi-
tamin B12, and Jammu & Kashmir for Zinc defi-
ciencies. We find that 3, 1, 1, 3, 1 out of 30 states
have a higher prevalence of folate, low serum fer-
ritin, vitamin A, vitamin B12, and Zinc deficiencies
coexisting with unimproved sanitation, respectively.
Unimproved sanitation is an important factor of stunt-
ing (Dwivedi et al., 2019), thus, indicating that the
hotspots are potential regions for the co-occurrence
of both stunting and micronutrient deficiency.
Bivariate LISA between maternal illiteracy and
micronutrient deficiencies (Figure 6,(B)) indicate 3,
1, 3, and 1 out of 30 states having a higher preva-
lence of maternal illiteracy coexisting with folate, low
serum ferritin, vitamin B12, and Zinc deficiencies, re-
spectively. We observe the clustering patterns in high
prevalence of low serum ferritin, vitamin B12, and
Zinc deficiencies coexisting with maternal illiteracy,
which is similar to the same with unimproved sani-
tation. Parental education is an important factor in
the occurrence of anemia and stunting (Puri et al.,
2020). Thus, we can conclude that the hotspots have a
high risk of co-occurrence of micronutrient deficien-
cies and stunting or anemia.
We observe relatively fewer spatial outliers in our
integrated analysis (Figure 6,(A)-(B)), reinforcing the
feasibility of this integrated analysis. The pie-chart
glyph map (Figure 3), the cluster map of correlation
of anemic prevalence between surveys (Figure 5,d.),
and the cluster map of low serum ferritin deficiency
against both contextual factors (Figures 6,(A)-(B))
demonstrate that north-eastern region is a coldspot for
prevalence of anemia, i.e., a low-risk region. We also
Integrating Population Surveys using Spatial Visual Analytics: A Case Study on Nutrition and Health Indicators of Children under Five in
India
209
North
Central
East
North East
West
South
Haryana
Himachal
Pradesh
Jammu &
Kashmir
Punjab
Raja
sthan
Uarakhand
Chhasgarh
Uar
Pradesh
Madhya
Pradesh
Odisha
West
Bengal
Jhark
hand
Bihar
Arunachal Pradesh
Assam
Manipur
Meghalaya
Nagaland
Sikkim
Tripura
Andhra
Pradesh
Karna
taka
Tamil
Nadu
Telangana
Kerala
Delhi
Mizoram
Maha
rashtra
Daman
and Diu
Dadra and Nagar Haveli
Gujarat
Goa
Andaman & Nicobar
Puducherry
Lakshadweep
Chandigarh
BCG
DPT Fully Immunized
Hepa��s B Measles
Polio
(A) State-wise coverage of immunization in percentage, as reported in the NFHS-4
North
Central
East
North East
West
South
Delhi
Haryana
Himachal
Pradesh
Jammu &
Kashmir
Punjab
Raja
sthan
Uara
khand
Chhasgarh
Uar
Pradesh
Madhya
Pradesh
Odisha
West
Bengal
Jhark
hand
Bihar
Arunachal Pradesh
Assam
Manipur
Meghalaya
Mizoram
Nagaland
Sikkim
Tripura
Maharashtra
Gujarat
Andhra Pradesh
Karna
taka
Tamil
Nadu
Telan
gana
Kerala
Folate
Low Serum
Ferri�n
Vitamin A
Vitamin B12 Vitamin D
Zinc
(B) State-wise occurrence of micronutrient deficiency in percentage, as reported in the CNNS
Figure 4: Circular radar plots showing the (A) coverage of immunization and (B) occurrence in micronutrient deficiency,
given in percentage in different regions in India.
GISTAM 2021 - 7th International Conference on Geographical Information Systems Theory, Applications and Management
210
(a) Stun�ng
(c) Was�ng
(b) Underweight
(d) Anemia
I=0.296,
z-score=2.698,
p-value=6.1e-3
I=0.432,
z-score=3.727,
p-value=4.2e-4
I=0.284,
z-score=2.688,
p-value=5.7e-3
I=0.450,
z-score=4.132,
p-value=3.1e-4
Figure 5: Global Moran’s I statistics and bivariate LISA
cluster maps of India showing the local clustering (hotspots
& coldspots) at the state-level from CNNS and NFHS-4 sur-
vey for undernutrition indicators in children under five, for
(a) Stunting, (b) Wasting, (c) Underweight, and (d) Anemia.
observe that Rajasthan is an outlier for bivariate LISA
analysis of anemia across both surveys but is a hotspot
in bivariate LISA analysis of variable, low serum fer-
ritin, and contextual factor, for both lack of sanita-
tion facility and maternal illiteracy (Figures 6,(A)-
(B), Low Serum Ferritin). This is due to the low oc-
currence of anemia in Rajasthan recorded in CNNS,
in comparison to that NFHS-4 (Figure 3), even though
low serum ferritin has been observed in CNNS for Ra-
jasthan (Figure 4, North).
Overall, we conclude that our integrated survey
analysis has brought forward findings that could not
have been made from either survey in isolation.
4 CONCLUSIONS
Our study illustrates the integration of national sur-
veys, namely, NFHS-4 and CNNS, using spatial-
visual analytics to find high- and low-risk regions of
co-occurrence of malnutrition conditions in children
under five in India. The analysis is done for under-
nutrition conditions at the state-level, and resolving
the difference in the granularity of the data openly
available for both surveys. Our results of hotspots
and coldspots using the indicators for micronutrient
deficiencies from CNNS and contextual factors from
NFHS-4 show the usefulness of our work. We have
also shown that the indicators which are commonly
available for both the surveys also reveal hotspots
and coldspots, where CNNS in 2016-18 reinforces
the findings of NFHS-4 in 2015-16. Our system-
atic integration of the surveys uses a three-step work-
flow involving a feasibility check, variable identifica-
tion, and the integration using spatial statistics. Fur-
ther, our spatial clustering results also show the high-
risk and low-risk regions identified across the sur-
veys for indicators common in both. Our work has
future scope of generalization across any two large-
scale population surveys, using a formal abstraction.
In summary, we show a proof-of-concept of inte-
grating existing large-scale population surveys, ben-
efiting the stakeholders. The integrated findings may
have been otherwise siloed within the surveys but are
significant when observed together. The goal of our
work is to demonstrate evidence of such significant
integrated results in order to improve the adaptation
of survey integration. The responsibility of data col-
lection is split strategically between national and lo-
cal population health surveys for economic reasons.
Planning joint outcomes across different surveys and
mining data jointly from multiple surveys can give
deeper insights together while preserving the auton-
omy of each survey in its entirety.
Integrating Population Surveys using Spatial Visual Analytics: A Case Study on Nutrition and Health Indicators of Children under Five in
India
211
(b) Low Serum Ferri�n
(a) Folate
(c) Vitamin A
(d) Vitamin B12
(e) Vitamin D
(f) Zinc
I=0.065,
z-score=0.684,
p-value=2.4e-1
I=0.269,
z-score=2.638,
p-value=7.0e-3
I=0.014,
z-score=0.085,
p-value=4.7e-1
I=-0.028,
z-score=-0.186,
p-value=4.3e-1
I=0.211,
z-score=2.150,
p-value=1.8e-2
I=-0.067,
z-score=-0.670,
p-value=2.5e-1
(A) Between micronutrient deficiency indicators from CNNS and “No improved sanitation” from NFHS-4.
(b) Low Serum Ferri�n
(a) Folate
(c) Vitamin A
(d) Vitamin B12
(e) Vitamin D
(f) Zinc
I=0.006,
z-score=0.136,
p-value=4.4e-1
I=0.091,
z-score=0.949,
p-value=1.7e-1
I=-0.029,
z-score=-0.297,
p-value=3.8e-1
I=0.287,
z-score=2.754,
p-value=5.8e-3
I=0.067,
z-score=0.631,
p-value=2.6e-1
I=-0.007,
z-score=-0.060,
p-value=4.8e-1
(B) Between micronutrient deficiency indicators from CNNS and women illiteracy from NFHS-4.
Figure 6: Global Moran’s I statistics and bivariate LISA cluster maps of India showing the local clustering (hotspots &
coldspots) at the state level between indicators from CNNS, and contextual factors from NFHS-4 surveys.
ACKNOWLEDGEMENTS
This work has been supported by the IBM Shared
University Grant and the Mathematical Research Im-
pact Centric Support (MATRICS) grant by the Sci-
ence and Engineering Board (SERB). This paper
has also benefited from the inputs from members of
GVCL and EHRC, and anonymous reviewers. This
study has been possible solely because of the open
data available in the public domain – the unit-level
NFHS-4 data and fact sheets for NFHS-4 and CNNS.
GISTAM 2021 - 7th International Conference on Geographical Information Systems Theory, Applications and Management
212

REFERENCES
Anselin, L. (1995). Local indicators of spatial associa-
tion—lisa. Geographical analysis, 27(2):93–115.
Berk, M. L., Schur, C. L., and Feldman, J. (2007). Twenty-
five years of health surveys: Does more data mean
better data? Health Affairs, 26(6):1599–1611.
Bharti, R., Dhillon, P., and Narzary, P. K. (2019). A spa-
tial analysis of childhood stunting and its contextual
correlates in India. Clinical Epidemiology and Global
Health, 7(3):488–495.
Cooper, M. W. (2020). People and Pixels: Integrat-
ing Remotely-Sensed and Household Survey Data for
Food Security and Nutrition. PhD thesis, University
of Maryland, College Park.
Dandona, R., Pandey, A., and Dandona, L. (2016). A re-
view of national health surveys in India. Bulletin of
the World Health Organization, 94(4):286.
Dhirar, N., Dudeja, S., Khandekar, J., and Bachani, D.
(2018). Childhood Morbidity and Mortality in India –
Analysis of National Family Health Survey 4 (NFHS-
4) Findings. Indian pediatrics, 55(4):335–338.
Dotse-Gborgbortsi, W., Tatem, A. J., Alegana, V., Utazi,
C. E., Ruktanonchai, C. W., and Wright, J. (2020).
Spatial inequalities in skilled attendance at birth in
Ghana: a multilevel analysis integrating health facil-
ity databases with household survey data. Tropical
Medicine & International Health, 25(9):1044–1054.
Dwivedi, L. K., Banerjee, K., Jain, N., Ranjan, M., and
Dixit, P. (2019). Child health and unhealthy sani-
tary practices in India: evidence from recent round
of national family health Survey-IV. SSM-population
health, 7:100313.
IIPS and MoHFW (2016). National Family Health Survey
state factsheets, 2015-16. IIPS, Mumbai.
Jacobson, D. M. and Teutsch, S. (2012). An Environmental
Scan of Integrated Approaches for Defining and Mea-
suring Total Population Health. In National Quality
Forum, Washington, DC2012.
Keim, D., Andrienko, G., Fekete, J.-D., G
¨
org, C., Kohlham-
mer, J., and Melanc¸on, G. (2008). Visual analytics:
Definition, process, and challenges. In Information
visualization, pages 154–175. Springer.
Khan, J. and Mohanty, S. K. (2018). Spatial heterogene-
ity and correlates of child malnutrition in districts of
India. BMC public health, 18(1):1027.
MoHFW, UNICEF and Population Council (2019). Com-
prehensive National Nutrition Survey (2016-2018)
National Report.
Morris, S. S., Carletto, C., Hoddinott, J., and Christiaensen,
L. J. (2000). Validity of rapid estimates of house-
hold wealth and income for health surveys in ru-
ral Africa. Journal of Epidemiology & Community
Health, 54(5):381–387.
Nsubuga, P., White, M. E., Thacker, S. B., Anderson, M. A.,
Blount, S. B., Broome, C. V., Chiller, T. M., Espitia,
V., Imtiaz, R., Sosin, D., et al. (2006). Public Health
Surveillance: A Tool for Targeting and Monitoring In-
terventions. Disease control priorities in developing
countries, 2:997–1018.
Puri, P., Khan, J., Shil, A., and Ali, M. (2020). A cross-
sectional study on selected child health outcomes in
India: Quantifying the spatial variations and identifi-
cation of the parental risk factors. Scientific reports,
10(1):1–15.
Rathi, K., Kamboj, P., Bansal, P. G., and Toteja, G.
(2018). A review of selected nutrition & health sur-
veys in India. The Indian journal of medical research,
148(5):596.
Sarna, A., Porwal, A., Ramesh, S., Agrawal, P. K., Acharya,
R., Johnston, R., Khan, N., et al. (2020). Charac-
terisation of the types of anaemia prevalent among
children and adolescents aged 1–19 years in India: a
population-based study. The Lancet Child & Adoles-
cent Health, 4(7):515–525.
Sharma, H., Singh, S., and Srivastava, S. (2020). Socio-
economic inequality and spatial heterogeneity in
anaemia among children in India: Evidence from
NFHS-4 (2015–16). Clinical Epidemiology and
Global Health.
UNICEF (2019). The State of the World’s Children 2019.
Children, Food and Nutrition: Growing well in a
changing world. UNICEF, New York.
Integrating Population Surveys using Spatial Visual Analytics: A Case Study on Nutrition and Health Indicators of Children under Five in
India
213
