
LogMe: An Application for Generating Logs in Immersive Interactions
for UX Evaluation
Victor Klisman, Luan Souza Marques, Jo
˜
ao Pedro de Lima, Leonardo Marques, Genildo Gomes,
Tayana Conte and Bruno Gadelha
Institute of Computing, Federal University of Amazonas, Manaus, AM, Brazil
Keywords:
User Experience, Immersive Experience, Log, Interaction, UX, Log Application.
Abstract:
Immersive applications aim to stimulate interactions between the physical, virtual, and simulated world. Such
applications stand out for transforming the public, often limited to a passive spectator, into an active participant
in an event. Assessing the experience promoted by immersive applications is a challenge, as it involves
difficulties inherent in the context of immersion. As an example, the user cannot be interrupted when he is
immersed in the experience. In this sense, a non-intrusive way of collecting data is needed that can indicate
whether the experience was positive or negative. The methods available in the literature are dependent on the
spoken and observed reports of users during the interaction, but they are not applicable in all dimensions of
evaluation and contexts of interaction, such as immersive events. The use of methods such as log capture can
assist in the investigation of user interactions. In this work, we propose an application capable of recording logs
from mobile devices while the user interacts with a certain immersive application. This will allow interactions
to be recorded as they actually are, facilitating the investigation of the user’s feelings when performing a
certain task.
1 INTRODUCTION
Technologies that promote the sensation of immer-
sion have been used to modify the way users inter-
act and engage in different immersive environments.
As an example of these technologies, we can men-
tion Augmented Reality (AR), Virtual R eality (VR),
and Mixed Reality (MR). These technologies tend to
eliminate or reduce the boundaries between the phys-
ical, virtual, and simulated worlds (Suh and Prophet,
2018).
Immersive environments should provide a good
user experience (UX)(Tcha-Tokey et al., 2017). Such
experience is a subjective concept, dependent on the
context and dynamics of the interaction(Law et al.,
2009). The user experience goes beyond performing
tasks in an application and focuses on hedonic aspects
of use, such as fun and pleasure. For this, evaluations
that focus on aspects beyond usability and their instru-
mental values must be applied(Hassenzahl, 2018).
In order to perform UX assessments, UX evalu-
ators use several techniques and methods available
in the literature. Rivero and Conte (2017) present
a mapping of these techniques and organize them
in seven categories: scales, such as Likert scale or
semantic differentials; forms, with open questions,
with free expression, and/or restricted, as multiple
choice; checklist; interviews, with questions pre-
defined by the moderators; exploration with acquaint-
ances, where there is an exchange of users exper-
iences and thoughts about what is being evaluated;
probes, materials such as multimedia and objects to
involve users in the evaluation process; experience
sampling and controlled user monitoring, psycho-
physiological responses through coupled sensors.
When considering contexts of immersive exper-
iences, traditional UX techniques may not be feas-
ible to use, as the evaluation must be carried out in
such a way that the user experience is not interrup-
ted (Marques et al., 2020). In this sense, ways of
capturing user experience data in a non-intrusive way,
without interrupting the experience or disturbing the
user, should be considered.
Through continuous records of user data (logs), it
is possible to capture more information about the con-
text of the interaction and the user experience while
having an immersive experience (Menezes and Non-
necke, 2014). However, the vast majority of applica-
tions do not provide user logs or make them publicly
available for analysis. The sensors logs can help to
Klisman, V., Marques, L., Pedro de Lima, J., Marques, L., Gomes, G., Conte, T. and Gadelha, B.
LogMe: An Application for Generating Logs in Immersive Interactions for UX Evaluation.
DOI: 10.5220/0010460105490556
In Proceedings of the 23rd International Conference on Enterprise Information Systems (ICEIS 2021) - Volume 2, pages 549-556
ISBN: 978-989-758-509-8
Copyright
c
2021 by SCITEPRESS – Science and Technology Publications, Lda. All rights reserved
549

infer the actual behavior of the user since the inter-
action is recorded exactly at the moment when it oc-
curs (Menezes and Nonnecke, 2014). But the absence
of this information by most applications demands the
use of intrusive UX assessment methods, requiring
direct contact between the moderator and the user.
In this sense, this paper presents LogMe, an ap-
plication that provides data inherent to the context,
capturing and storing logs of immersive applications
without interfering in the user experience. For this,
geolocation data, motion sensors, and external envir-
onment, such as luminosity, are collected to assist in
the analysis of the user behavior.
2 BACKGROUND
As new technologies emerge, organizers of entertain-
ment events seek to provide different ways of interac-
tion and engagement with the public at their events.
This industry branch is gaining prominence and is
constantly expanding (Martins et al., 2020).
An example of this expansion is reflected in the
creation of applications to increase audience engage-
ment or make it more active in entertainment events,
such as StageCast (Funkquist, 2019) and Echobo
(Lee and Freeman, 2013). Another example is the
Bumbometer (Martins et al., 2020), which consists
of a competitive and collaborative game for crowds.
The Bumbometer allows two opposing teams to play
matches through the continuous movement of their
mobile devices. A screen displays two thermomet-
ers that indicate each teams’ engagement (Figure 2
in Section 4.1). The speed of the thermometer is
defined by adding the acceleration points (x, y, and
z) provided by the device’s accelerometer sensor. The
team that manages to get the thermometer to the top
wins.
For this type of technology to fulfill the role of
encouraging user interaction, it is necessary to ana-
lyze the experiences they provide to users. In this
sense, UX evaluations are a way to analyze these ex-
periences lived by the public. As stated earlier, tra-
ditional evaluation techniques of UX are not the best
alternative in the context of immersive experiences,
as they interrupt the user during immersion. On the
other hand, UX evaluations based on indirect obser-
vation can be a viable alternative (Marques et al.,
2020). They can be automatically done by captur-
ing the user’s logs, while the user interacts with the
application, allowing the understanding of their inter-
action and engagement without direct interference.
Hussain et al. (Hussain et al., 2018) proposed the
Lean UX Platform, a platform for capturing and ana-
lyzing user data of a given software at the moment of
interaction. The platform is focused on recording and
processing user data. The Lean UX Platform uses sev-
eral ways to collect interaction logs, such as facial ex-
pression analysis, eye tracking, video and voice cap-
ture, and electroencephalography (EEG). When ap-
plying a test on another platform, the authors realized
that capturing information in a synchronized way al-
lows a better interpretation of the data. And the use
of several methods and devices provide more accurate
information about the user when interacting with the
product.
The web also adheres to log capture as it is a
powerful resource for business research and market,
benefiting a series of applications(Preece et al., 2015).
The UX-Log tool uses such logs to infer and recre-
ate user behavior after an experiment (Menezes and
Nonnecke, 2014). A test was carried out where 10 us-
ability experts, watched the user experience recreated
by UX-Log and evaluated the use of the tool. The
experts were able to understand the user and his in-
tentions. The authors stated that the tool was efficient
in recreating user behavior from logs.
Based on the aforementioned works, we can say
that interaction logs allow the analysis of the context,
attitudes, and emotions of the users during their ex-
perience. Logs analysis allows UX experts in car-
rying out UX evaluations without interfering in the
user’s experience. In this work, we propose an applic-
ation for capturing logs from mobile devices in order
to enable UX experts to evaluate UX on different mo-
bile applications. Our proposal differs from the others
presented in this section in that it focuses on logs of
immersive experiences.
3 METHOD
In order to propose a way of evaluating UX in im-
mersive experiences in a non-intrusive manner, we ad-
opted a research method based on 4 stages as follows:
(i) exploratory, where we reviewed literature in order
to understand both UX evaluation practices and im-
mersive technologies; (ii) experimentation, where we
proposed LogMe, a tool for capturing logs from dif-
ferent sensors in smartphones; (iii) Pilot Study, where
we conducted a pilot test; and finally the (iv) Feasibil-
ity Study, corresponding to the feasibility study on the
use of LogMe.
In the (i) exploratory stage, we aimed at under-
standing UX concepts and techniques, and immers-
ive applications. During this stage we analyzed some
papers that dealt with the exploration of interaction
logs and data cataloging. A snippet of this review
ICEIS 2021 - 23rd International Conference on Enterprise Information Systems
550

is presented in Section 2. These papers gave us the
background to understand the ways of capturing logs
and their application for analyzing users’ behavior.
Also, they aimed at a better interpretation of the final
experience of those who used a particular application
(Menezes and Nonnecke, 2014).
After reviewing the literature, we proceeded to the
(ii) experimentation stage, which started with a com-
parative study between technologies for developing
mobile applications. During this study, we decided
on the most suitable technology for log collection in
mobile devices. After that, we began with the devel-
opment of LogMe in an incremental-iterative way. In
each iteration, we made some improvements and ad-
ded more sensors’ data. Section 4 details the develop-
ment of LogMe.
Before proceeding with the feasibility studies, the
(iii) Pilot Study stage took place, which consists of
conducting a pilot test with four simultaneous users
through video conferencing. The purpose of the
test was to verify the usability and efficiency of the
LogMe data capture, while the participants used a
specific interaction app that stimulates the movement
of the device. The pilot test can be seen in more detail
in Section 4.1.
In (iv) Feasibility Study stage, we conducted a
feasibility study to verify the use of LogMe in prac-
tice. We aimed at verifying whether the quality of the
logs recorded by LogMe were as good as those of the
Bumbometer itself. For such comparison, the analysis
was performed based on the data collected by both
LogMe and Bumbometer apps. The study was con-
ducted entirely online via video conference and had
a total of 13 simultaneous participants. Section 4.2
details this study.
4 LogMe
Smartphone apps can mediate many immersive ex-
periences. But, in most apps, we do not have ac-
cess to log files with information about user interac-
tions. This fact makes the evaluation of the UX during
immersive experiences in a non-intrusive way more
challenging. This scenario motivates the development
of LogMe.
LogMe is a mobile app developed for collect-
ing and registering sensor and contextual data from
mobile devices. LogMe reads data from a set of
sensors comprising: accelerometer, gyroscope, mag-
netometer, and light sensor. Besides sensors data,
LogMe also reads and registers the location and bat-
tery level as contextual data.
The choice of these sensors is justified by the fact
that through them it is possible to infer the behavior
of users, through body gestures and the way they ma-
nipulate the device. Thus, it is possible to associate
such behaviors with sentimental characteristics such
as stress, dissatisfaction, and fluidity. It is also pos-
sible to record contextual information of the user, for
example, it is possible to collect the signal strength of
the wi-fi network in relation to the distance from the
router, understand when the user is moving or how
the device reacts to the battery charge level. This
last point is emphasized due to some functionalities of
mobile devices being reduced or disabled when they
are at low load levels.
The context of the use of the immersive exper-
ience under evaluation must be taken into account
when analyzing the logs provided by LogMe. Apps
used in entertainment events, for example, can gener-
ate a lot of movement data and this does not charac-
terize stress or anger on the part of the user, but joy or
enthusiasm.
The usage of LogMe is simple. The user must
activate the app, set the time interval for collecting
sensors and contextual data and press the ”Start” but-
ton (”Iniciar”, in Portuguese) (Figure 1 on the left).
After pressing the start button, LogMe keeps running
in background and registers sensors data while the
user interacts normally with the smartphone during an
immersive experience. After the experience, the user
activates LogMe and press the ”Stop” button to finish
the data collection.
During data collection, LogMe records the data
in a text-based log file. LogMe captures information
from sensors and components that can be classified
into 4 groups: Motion Sensors, capable of capturing
any movement of the device; Position Sensors, allows
you to recognize the device’s position in the physical
space; Environment Sensors, allows you to capture
information external to the device; Location Com-
ponents, allows you to collect the geographic loca-
tion of the device; In addition to these, the timestamp
provides the date and time for each line in the log file.
An example of a generated file is also presented in
Figure 1.
Depending on the context in which the applica-
tion is used, it is more feasible to use a certain capture
time. For this, the option of configuring the time in-
terval to capture sensor data was added. In this way,
the user can choose intervals from 0.1 to 2.0 seconds.
This allows greater control and makes it more flexible
during use combined with other applications.
LogMe enables the sharing of the generated log
file. In the case of a UX evaluation, the user can
send their file to UX evaluators. This file-sharing is
performed manually by the user after the log genera-
LogMe: An Application for Generating Logs in Immersive Interactions for UX Evaluation
551
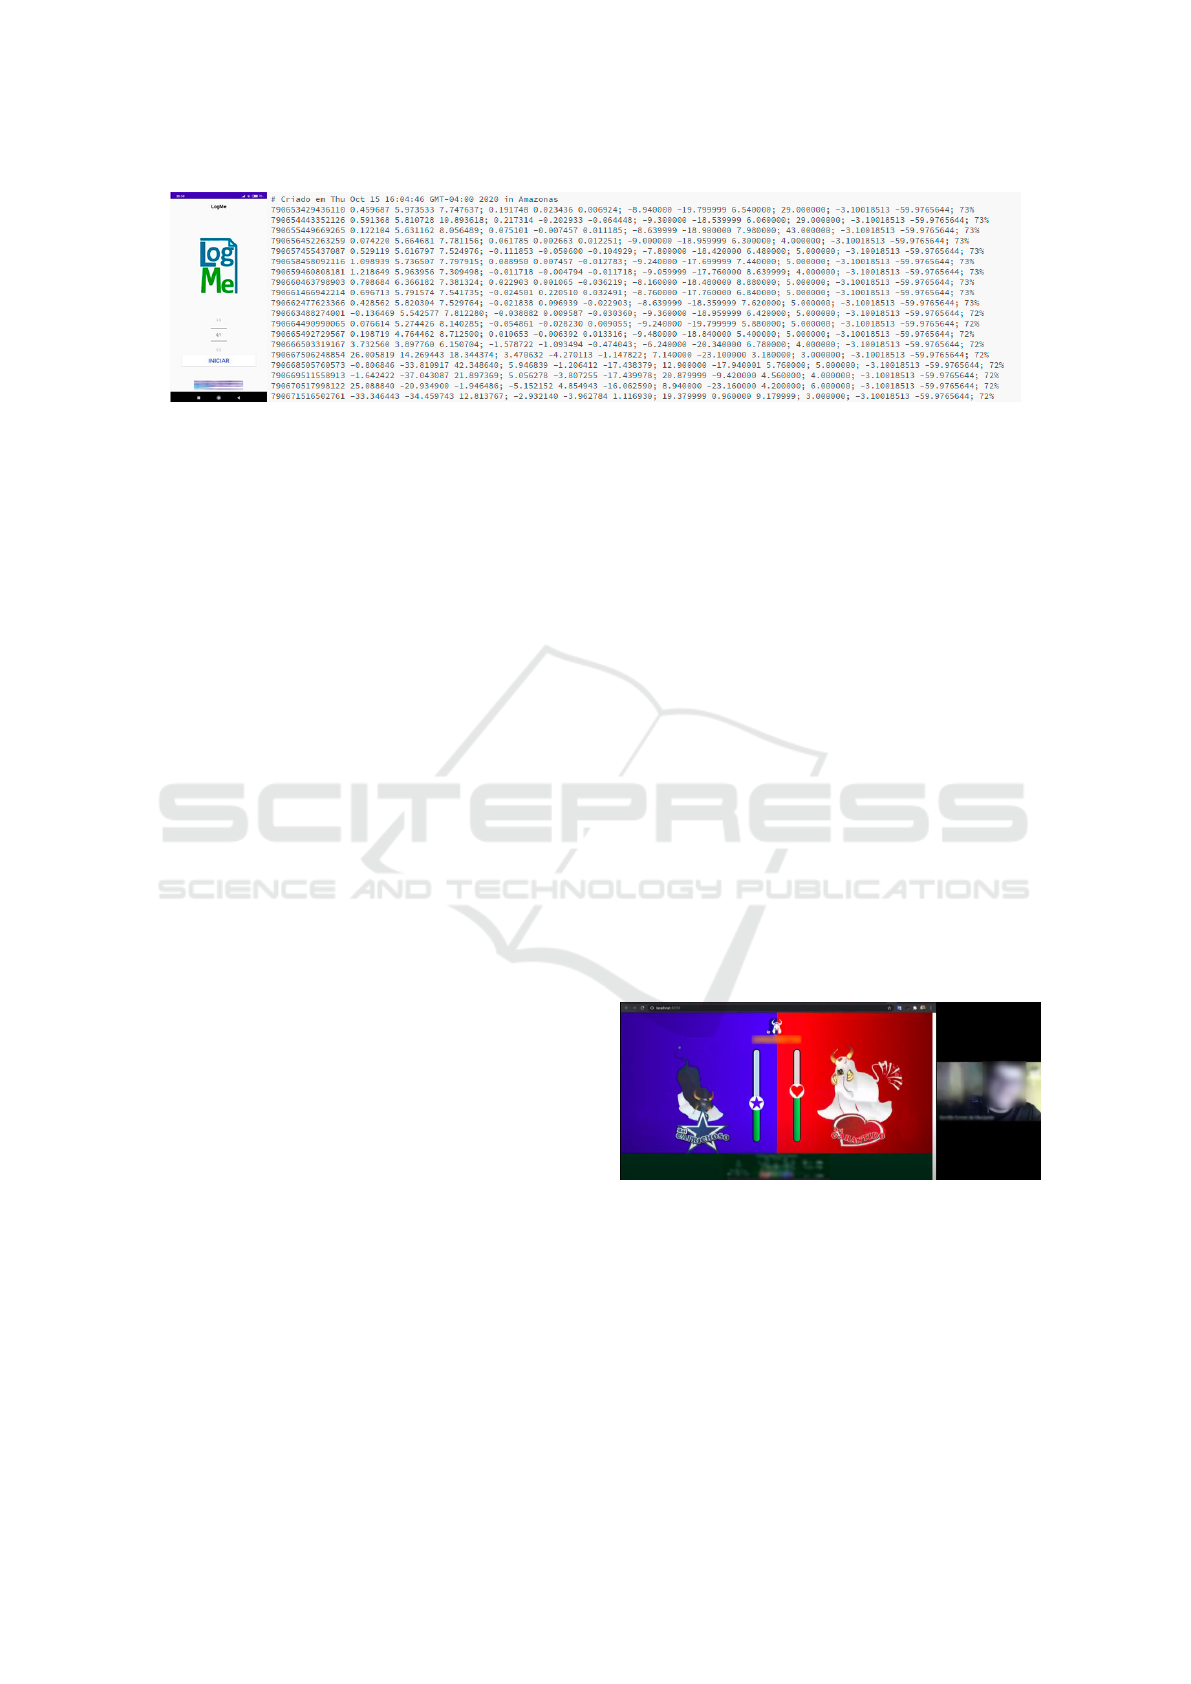
Figure 1: On the left, a LogMe home screen. On the right, an example log file.
tion has ended, through an option that appears on the
screen, where the user determines where to send the
log file.
4.1 Pilot Study
After developing LogMe, we conducted a pilot study
in order to verify if the generated log is comparable
with a native log of an application that provides im-
mersive experiences. The pilot test aimed to improve
the data collection plans and procedures that will be
followed to validate the study. For this, the steps that
comprise this test are described below.
4.1.1 Preparation
In order to conduct the study, we had to select an app
that provides an immersive experience. The require-
ments for this selection were: (1) the interaction in
the app must be motion-based; (2) the app must be
used in an on-line setting (given the scenario of social
isolation due to the COVID-19 pandemic) and; (3) the
app must provide a log of user interaction to serve as
basis for comparison with LogMe generated logs.
Based on these requirements, we chose Bum-
bometer as an app for conducting the pilot study.
Bumbometer, as mentioned in Section 2, is an app
designed to be used during an entertainment event
where two teams compete by shaking their smart-
phones to see who is the most animated. Bum-
bometer provides an immersive experience during en-
tertainment events engaging its users in the battle.
Bumbometer works entirely on-line which enables its
use in a non-presencial environment. Bumbometer’s
backend application generates an log with the inter-
action of its users. This turns possible to compare the
data with log provided by LogMe.
The pilot study was conducted with four parti-
cipants that installed both Bumbometer and LogMe
apps in their smartphones. Due to the context of
the Covid-19 pandemic (Roser et al., 2020), it was
conducted entirely on-line via video conference us-
ing Google Meet. Google Meet enabled the sharing
of the Bumbometer’s feedback screen, displaying the
termomethers as we can see in Figure 2.
4.1.2 Execution
With the applications installed on their devices, the
participants started LogMe and were instructed to ini-
tially set the interval time of 0.1 seconds for cap-
turing sensors data. Soon after, they were able to
start recording the logs and leave the application run-
ning in the background. That done, they started the
Bumbometer app and choose their favorite team (Blue
Team - Boi Caprichoso or Red Team - Boi Garantido).
The feedback screen with the teams’ thermomet-
ers was presented and the round started. Thus, the
participants were able to shake their smartphones to
take their team to victory. Normally, interaction with
the Bumbometer takes an average time of 20 seconds.
After the round, the participants stopped the record
of logs in LogMe and shared the generated log file
to the researcher that conducted the study. Figure 2
illustates the feedback screen shared in Google Meet
during the study.
Figure 2: Pilot test being performed remotely.
Four more rounds were performed with the following
intervals defined in LogMe: 0.5 seconds, 1 second,
1.5 seconds, and 2 seconds. At the end of all rounds,
the participants shared all LogMe generated files with
the researcher that conducted the study. We also
collected Bumbometer’s five log files related to the
five rounds during the study. In the next section we
present the analysis of the log files from both LogMe
and Bumbometer.
ICEIS 2021 - 23rd International Conference on Enterprise Information Systems
552
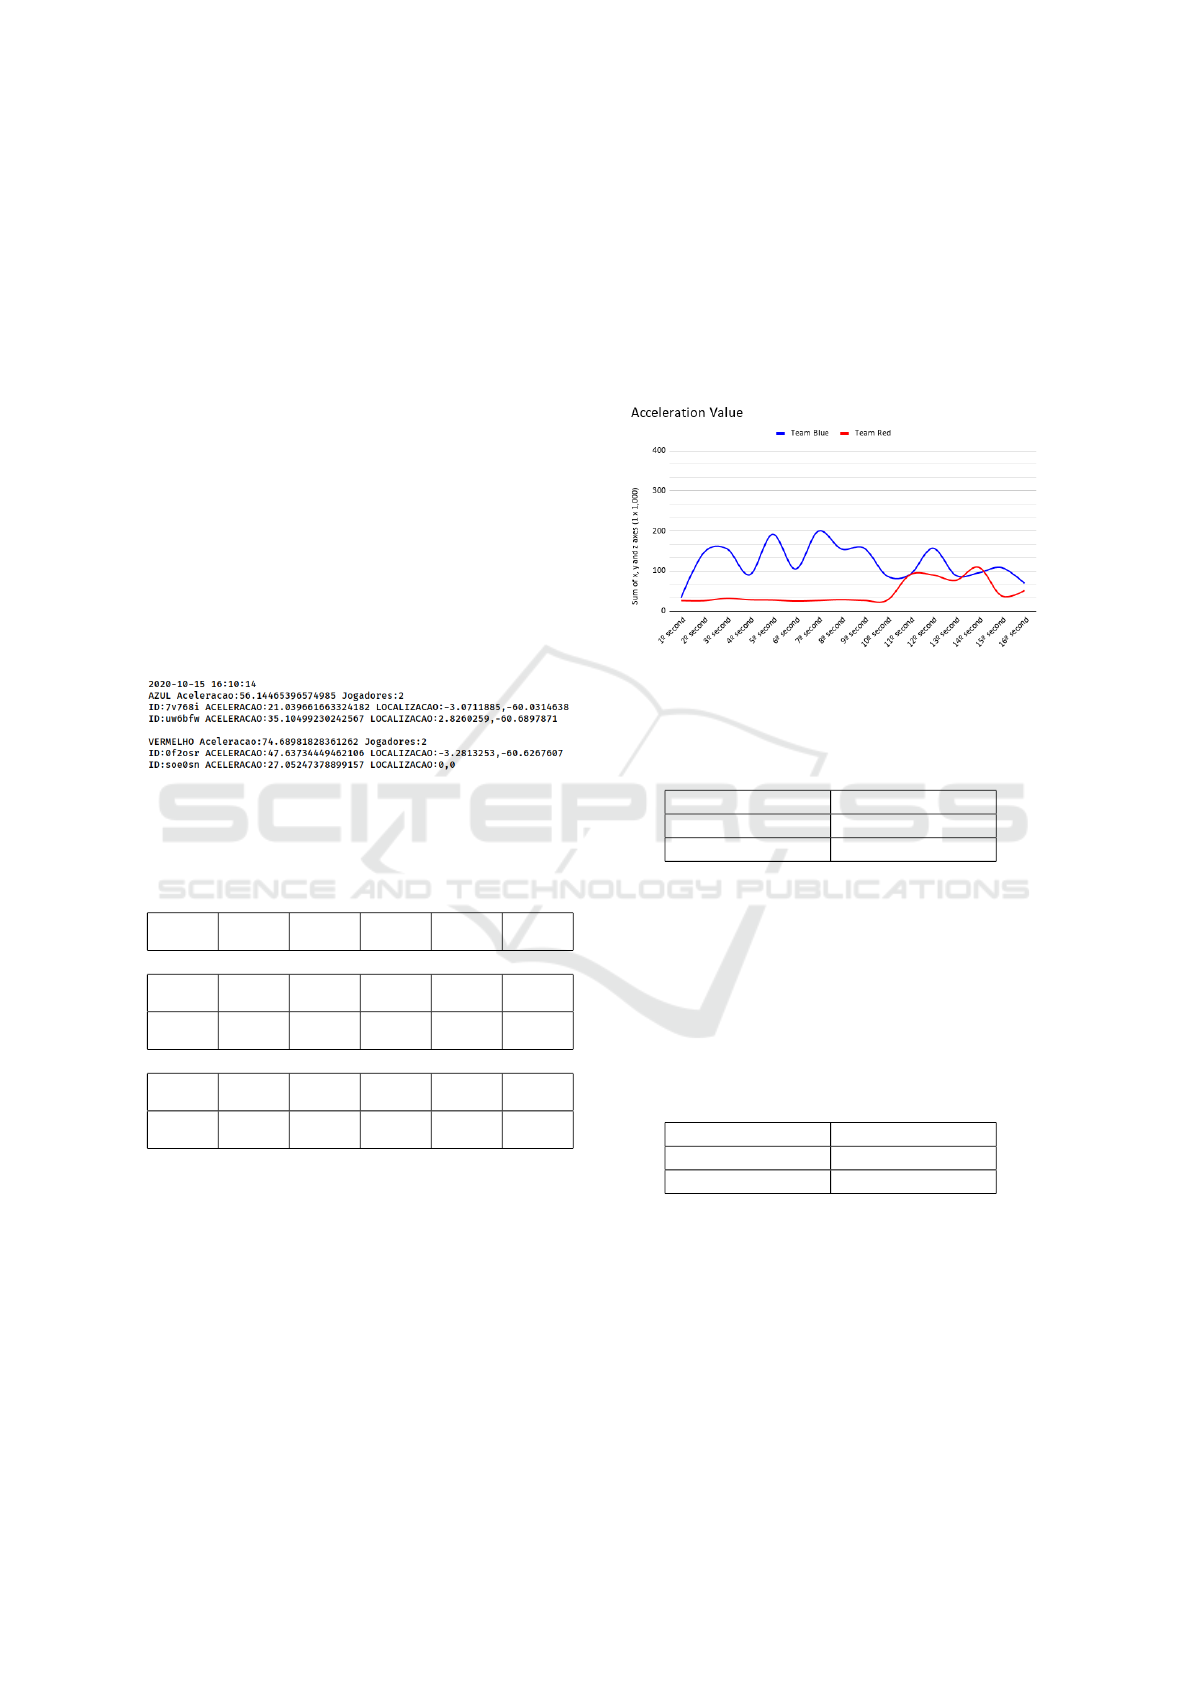
4.1.3 Results Analysis
The structure of Bumbometer’s native log is different
from LogMe generated logs. The data is divided by
teams, where each individual accelerometer value is
summed to form the team’s acceleration value. Bel-
low the team information, the log presents informa-
tion about each user comprising: id of the user, ac-
celerometer value, and GPS location values. Figure 3
shows an example of Bumbometer’s native log file for
one round of the study.
Different from Bumbometer’s log files, LogMe
generated file stores data for just one user. So, to
analyze and compare both log files, we needed to
collect LogMe generated logs of each participant of
the study. After that, we had to organize the logs
from all the participants in the same structure as Bum-
bometer’s native log. Table 1 shows LogMe files’ data
organized for comparison with Bumbometer’s native
log file.
Figure 3: Example of log generated by the Bumbometer
application.
Table 1: Organization of LogMe data for comparison with
Bumbometer logs.
X aceller-
ation
Y aceller-
ation
Z aceller-
ation
Total In-
dividual
Team
Total
Blue Team
participant
1
4.298.388 3.996.705 6.078.269 14.373.362
participant
2
2.473.210 3.335.123 12.919.112 18.727.445 33.100.807
Red Team
participant
3
0.683.738 5.584.887 8.002.572 13.587.459
participant
4
0.689.530 2.861.071 9.907.207 12.768.278 23.355.737
For each second counted in LogMe, the accelerometer
data (x, y, z axes) for each user were added and later
added to the total value of the chosen team, resulting
in a single value. This value was compared with the
opposing team. The time interval for the execution of
each test was also considered.
Among the 5 rounds performed, we considered
only rounds 2 and 3 (intervals of 0.5 and 1 second)
for the comparison with the records generated by the
Bumbometer app. This was due to the interval times
for rounds 2 and 3 are the closest to the Bumbometer’s
native log, obtaining a more consistent result.
The test with the capture interval of 1 second had a
total interaction time of 15 seconds. In comparison
with the results of the Bumbometer’s native log, 11
results were obtained with an accuracy of 78.57%.
The final result of the winning team was confirmed by
the logs collected from LogMe. The variation in team
acceleration can be seen in Figure 4 and the winner of
the round in Table 2.
Figure 4: Graph of the acceleration variation during the in-
teraction between the teams in round 3 (1-second interval).
Table 2: Total acceleration for each team and the winner
within 1 second.
Team Blue 1.935.595.156
Team Red 732.001.560
Round Winner Team Blue
For the test with the interval time set to 0.5 seconds,
the LogMe data had to be considered in pairs. Every
two lines of 0.5 seconds the data were added to match
the time of 1 second in the Bumbometer’s log. The in-
teraction lasted 11 seconds and obtained 7 coincident
values and the confirmation of the winner by LogMe
(seen in Table 3).
Table 3: Total acceleration for each team and the winner
within 0.5 second.
Team Blue 1.467.652.366
Team Red 2.362.262.779
Round Winner Team Red
It is considered that, due to the flexibility of cap-
ture time and individual registration, LogMe logs can
bring more efficient results when analyzing the inter-
action. This flexibility allows verifying the user who
collaborated and engaged the most (Table 4). In addi-
tion, based on individual data, it is possible to find the
winning team in a clearer, more objective way and
without loss of information. The Bumbometer also
obtains this information, but calculates the accelera-
tion value over a very large interval and still passes it
LogMe: An Application for Generating Logs in Immersive Interactions for UX Evaluation
553

to a database via the internet, which can be lost during
this process.
Table 4: Total acceleration of participants and who contrib-
uted most during the round.
Team Blue Team Red
Participant 1 1.436.432.830 Participant 3 414.089.883
Participant 2 499.162.326 Participant 2 317.911.677
Biggest contributor: participant 1
LogMe’s utility stands out for collecting data from
other sensors present in the device, allowing to un-
derstand the context and mode of experience, engage-
ment, and interaction of each user more deeply. In
general, the pilot test met the expectations of the study
concerning ease of use and gaining information that
may have been compared to the logs of the applica-
tions to be evaluated.
4.2 Feasibility Study
In order to confirm the results from the Pilot Study,
we conducted a feasibility study. This study aimed
to verify the feasibility of analyzing multiple LogMe
generated files from many users interacting in the
same immersive experience. So, in this study, we in-
vited 13 participants to engage and interact virtually
using Bumbometer. The study is detailed in the fol-
lowing sections.
4.2.1 Preparation
For this study, we elaborated an Informed Consent
Form (ICF) explaining the motivation and execution
process of the research highlighting the information
that would be collected from the participants. All par-
ticipantes digitally signed the ICF that was available
through the Google Forms platform
1
. As in the pi-
lot test, the study was carried out by videoconference
using the same interaction application.
The study started with a short presentation to the
participants contextualizing them and explaining the
functioning of the LogMe and Bumbometer apps.
The procedures of the study was also explained to the
participants.
As in the Pilot Study, the Bumbometer’s feedback
screen with each team’s thermometers was shared
with all participants in Google Meet. We also created
a group on a message exchange platform (Telegram
2
)
with all the participants to send their log files for ana-
lysis.
1
https://docs.google.com/forms
2
https://telegram.org/
4.2.2 Execution
In total, 13 people participated in this study. All
of them downloaded both LogMe and Bumbometer
apps. During the presentation about the study, we
answered all participant’s questions and doubts. We
also asked them to sign the ICF through an online
form link, where everyone agreed to use their data an-
onymously for scientific purposes.
After signing the ICF, the rounds were initiated
and carried out like the pilot test, Session 4.1. For
each round, the LogMe data logging interval varied
between 2 seconds for the first round, 1.5 seconds for
the second round, 1 second for the third round and 0.5
for the fourth round. The Figure 5 shows the feedback
screen and the participants shaking their smartphones.
In the end, the individual logs generated by LogMe
were sent to a group on Telegram. These logs were
received for further analysis.
Figure 5: Test performed with 13 people remotely.
4.2.3 Results Analysis
Through the analysis of the logs, we could infer the
total of both individual and collective engagement
during the interactions. We could also observe in
which rounds the participants collaborated more and
which team was more engaged in the immersive ex-
perience. Figure 6 shows the total engagement for
each round. As we can see, the Blue team won rounds
1, 2 and 3. The Red Team won only the last round.
As in the Pilot Study, for comparison purposes,
we organized LogMe generated logs following the
same organizational structure of the data generated by
Bumbometer’s native-logs.
The third round had to be discarded from the ana-
lysis. The reason for that is that one of the parti-
cipants had trouble with sharing the log referring to
this round. Bumbometer’s native log has data from
this participant, but without the log from LogMe, the
comparison was not possible.
The comparison of the data returned by the Bum-
bometer, the adapted data from LogMe and the per-
centage of equivalence is shown in Table 5. It is
ICEIS 2021 - 23rd International Conference on Enterprise Information Systems
554
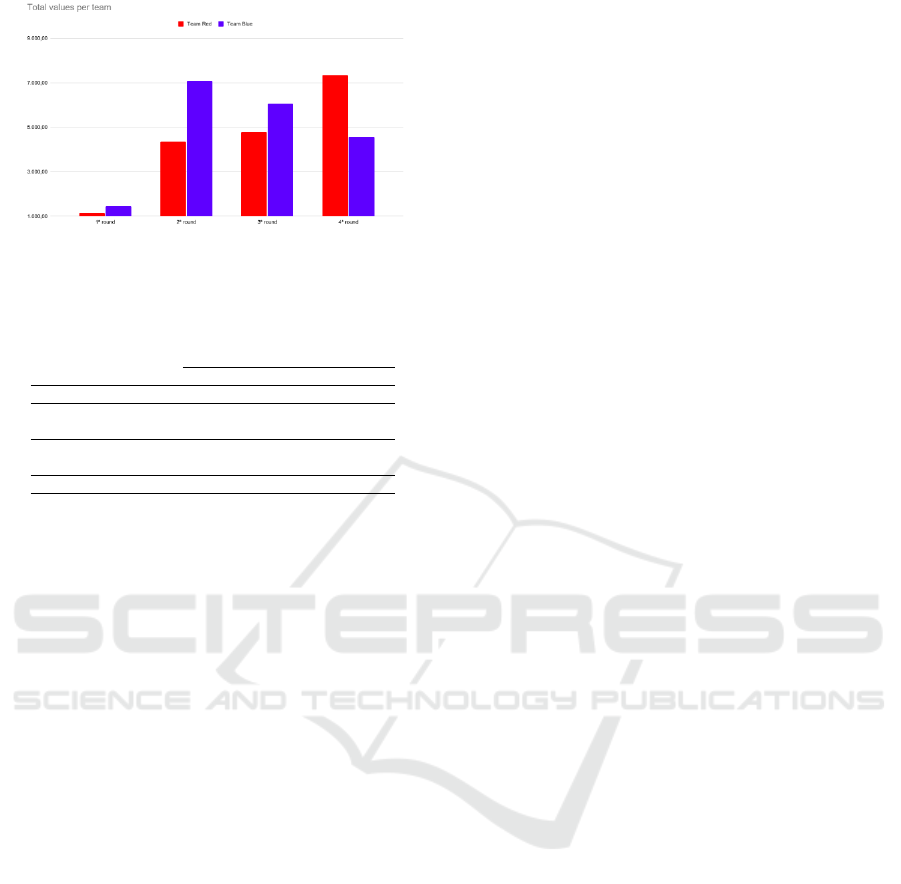
Figure 6: Comparison table of the winners during the 4
rounds.
Table 5: Matching results between Bumbometer and
LogMe.
Round 1 Round 2 Round 4
Capture time 2 sec 1,5 sec 0,5 sec
Values returned
by the Bumbometer
15 14 14
Corresponding values
with LogMe
12 13 13
Accuracy 80% 92,85% 92,85%
possible to observe that the adaptation of the LogMe
data, in its great majority, becomes equivalent to the
data generated by the Bumbometer, achieving excel-
lent accuracy.
The study showed that the logs generated by
LogMe are as good as those generated by the evalu-
ated application. During the three valid rounds carried
out in this study, we obtained an average of 88.56%
of correct answers. This allowed us to verify that the
logs generated by LogMe could be used to correctly
determine the winner of all valid rounds (1,2 and 4).
5 DISCUSSIONS
The objective of this work is to investigate whether
LogMe is capable of producing useful data for the
evaluation of UX, specially on applications that
provides immersive experiences. As seen during the
study, it is feasible to use logs to assess user engage-
ment, interaction and collaboration. According to the
results obtained through the studies, we noticed that
the LogMe data compared to the Bumbometer, had
significantly similar results, which can be verified in
the Session 4.2.
This allows us to state that LogMe provides in-
formation comparable to the information provided by
Bumbometer’s native log. Information on logs from
LogMe manages to be more accurate with less loss
of information. It is worth mentioning that the pres-
ence of more sensors available, allows loading de-
tailed information of the interaction, thus generating
more consistency in the inferences of users behavior
during immersive experiences. LogMe can also be
used in other contexts using different applications if
the interaction can be analyzed by logs of motion and
contextual sensors.
As explained in Marques (Marques et al., 2020),
some UX measures need the user’s direct opinion,
but there are indirect measures, such as engagement.
These measures can be found through LogMe since it
is possible to assess how much the user has actively
contributed to the interaction.
Therefore, LogMe can help UX evaluators to ad-
opt non-intrusive techniques as an alternative to tra-
ditional UX techniques. This is an important issue
given the context of immersive entertainment, where
the user experience cannot be interrupted. In this
scenario, the evaluation through traditional UX tech-
niques may not be feasible. In this sense, LogMe cap-
tures and provides data for the UX assessment to be
carried out indirectly.
About the limitations of LogMe, we can point
that the app was developed exclusively for Android
devices, limiting the reach of users. LogMe is still a
proof of concept. We developed it firstly for Android
devices because Android is the most used mobile op-
erating system (Alzaylaee et al., 2020). We intend to
develop an IOS version of LogMe, covering a wider
range of devices.
Another limitation of LogMe as to do with its log
sharing function. This function is not yet exclusive to
LogMe, that is, the user can choose the destination to
which he wants to make the generated logs available
(WhatsApp, Telegram, etc.). This can lead to sharing
errors and file loss. Subsequently, we intend to create
automated file management, where log files would be
uploaded to the cloud and stay accessible only for UX
evaluators, thus reducing the chance of errors in shar-
ing.
6 CONCLUSION AND FUTURE
WORK
Immersive applications are gaining ground in enter-
tainment events, and evaluating the user experience
(UX) while using the application without directly in-
terfering is a challenge. For that, we proposed an ap-
plication to capture data inherent to the context, cap-
able of generating interaction logs through the sensors
of mobile devices. And through the analysis of these
interaction logs, infer the user’s real behavior. Thus,
the LogMe application was developed and subjec-
ted to feasibility studies and comparison analyzes to
verify the efficiency of log captures.
LogMe: An Application for Generating Logs in Immersive Interactions for UX Evaluation
555

Through the results collected, LogMe proved to be
a satisfactory product, achieving an excellent similar-
ity rate in contrast to other applications, proving to be
efficient and effective in capturing details of the user’s
behavior without interfering with their experience. It
also allows the understanding of user behavior, and
the extension of the utility to test any types of applic-
ations that require behavior inference.
As future work, we intend to expand the use of
the application by creating a multiplatform version of
LogMe, as well as adding support for more sensors,
registering the name of the application used in the
foreground, and allowing automatic sharing of the log
files. Besides, there is also a need to validate LogMe
together with other applications, since in this paper,
the data were compared only with an immersive ap-
plication.
ACKNOWLEDGMENT
This research, carried out within the scope of the
Samsung-UFAM Project for Education and Research
(SUPER), according to Article 48 of Decree no
6.008/2006(SUFRAMA), was funded by Samsung
Electronics of Amazonia Ltda., under the terms
of Federal Law no 8.387/1991, through agreement
001/2020, signed with Federal University of Amazo-
nas and FAEPI, Brazil. Also supported by Coordin-
ation for the Improvement of Higher Education Per-
sonnel - Brazil (CAPES) - Financing Code 001, CNPq
process 311494/2017-0, and Foundation for Research
Support of the State of Amazonas (FAPEAM) - POS-
GRAD and process 062.00150/2020.
REFERENCES
Alzaylaee, M. K., Yerima, S. Y., and Sezer, S. (2020). Dl-
droid: Deep learning based android malware detection
using real devices. Computers & Security, 89:101663.
Funkquist, M. (2019). Study of the impact and usage of an
audience engagement tool at live events.
Hassenzahl, M. (2018). The thing and i: understanding the
relationship between user and product. In Funology 2,
pages 301–313. Springer.
Hussain, J., Khan, W. A., Hur, T., Bilal, H. S. M., Bang, J.,
Hassan, A. U., Afzal, M., and Lee, S. (2018). A mul-
timodal deep log-based user experience (ux) platform
for ux evaluation. Sensors, 18(5):1622.
Law, E. L.-C., Roto, V., Hassenzahl, M., Vermeeren, A. P.,
and Kort, J. (2009). Understanding, scoping and de-
fining user experience: a survey approach. In Pro-
ceedings of the SIGCHI conference on human factors
in computing systems, pages 719–728.
Lee, S. W. and Freeman, J. (2013). echobo: A mobile music
instrument designed for audience to play. Ann Arbor,
1001:48109–2121.
Marques, L., Amazonas, M., Assuncao, W., Castro, T.,
Zaina, L., Gadelha, B., and Conte, T. (2020). Ux
trek: A post-interaction journey from immersive ex-
perience logs. IHC 2020 - XIX Simp
´
osio Brasileiro
sobre Fatores Humanos em Sistemas Computacionais.
Martins, G., Gomes, G., Conceic¸
˜
ao, J., Marques, L., Silva,
D. d., Castro, T., Gadelha, B., and Freitas, R. d.
(2020). Enhanced interaction: audience engagement
in entertainment events through the bumbometer app.
IHC 2020 - XIX Simp
´
osio Brasileiro sobre Fatores
Humanos em Sistemas Computacionais.
Menezes, C. and Nonnecke, B. (2014). Ux-log: understand-
ing website usability through recreating users’ exper-
iences in logfiles. Journal ISSN, 2368:6103.
Preece, J., Sharp, H., and Rogers, Y. (2015). Interaction
design: beyond human-computer interaction. John
Wiley & Sons.
Rivero, L. and Conte, T. (2017). A systematic mapping
study on research contributions on ux evaluation tech-
nologies. In Proceedings of the XVI Brazilian Sym-
posium on Human Factors in Computing Systems,
pages 1–10.
Roser, M., Ritchie, H., Ortiz-Ospina, E., and Hasell, J.
(2020). Coronavirus pandemic (covid-19). Our World
in Data.
Suh, A. and Prophet, J. (2018). The state of immersive tech-
nology research: A literature analysis. Computers in
Human Behavior, 86:77–90.
Tcha-Tokey, K., Loup-Escande, E., Christmann, O., and
Richir, S. (2017). Effects on user experience in an edu-
tainment virtual environment: comparison between
cave and hmd. In Proceedings of the European Con-
ference on Cognitive Ergonomics 2017, pages 1–8.
ICEIS 2021 - 23rd International Conference on Enterprise Information Systems
556
