
Lessons Learned from a Lean R&D Project
Bianca Teixeira
1
, Bruna Ferreira
1
, André Damasceno
1
, Simone D. J. Barbosa
1
, Cassia Novello
1
,
Hugo Villamizar
1
, Marcos Kalinowski
1
, Thuener Silva
1
, Jacques Chueke
1
, Hélio Lopes
1
,
André Kuramoto
2
, Bruno Itagyba
2
, Cristiane Salgado
2
, Sidney Comandulli
2
, Marinho Fischer
2
and Leonardo Fialho
2
1
Pontifical Catholic University of Rio de Janeiro (PUC-Rio), Rio de Janeiro, Brazil
2
Petrobras, Rio de Janeiro, Brazil
{kuramoto, itagyba, cristiance.salgado, comandulli, marinhof, leofmello}@petrobras.com.br
Keywords:
Lean R&D, Research & Development, Agile, Lean Inception.
Abstract:
In a partnership between academia and industry, we report our experience in applying the Lean R&D ap-
proach in the IAGO project, an oil and gas machine-learning-based dashboard. The approach is grounded in
continuous experimentation through agile development, beginning with a Lean Inception workshop to define
a Minimal Viable Product. Then, after technical feasibility assessments and conception phases, Scrum-based
development begins, continually testing business hypotheses. We discuss our experiences in following the
approach, and report developers’ perceptions gathered through interviews and user evaluations of the final
product. We found that the Lean Inception works well for aligning expectations and objectives among stake-
holders, but it is not enough to level the domain knowledge among developers. The participation of end users
in the workshop and throughout the project, as well as constant communication among all stakeholders, is
very important to deliver appropriate solutions.
1 INTRODUCTION
In September 2019, the Pontifical Catholic Univer-
sity of Rio de Janeiro and Petrobras, a large publicly-
held company that operates in the oil, gas, and energy
industry in Brazil, established a partnership through
an initiative called ExACTa (Experimentation-based
Agile Co-creation initiative for digital Transforma-
tion). The goal is to develop several Research &
Development (R&D) solutions, with a focus on Dig-
ital Transformation (DT). We follow an approach
named Lean R&D, which has the following build-
ing blocks: (i) Lean Inceptions, to allow stakeholders
to jointly outline a Minimal Viable Product (MVP);
(ii) early parallel technical feasibility assessment and
conception phases, allowing to “fail fast”; (iii) Scrum-
based development management; and (iv) strategi-
cally aligned continuous experimentation to test busi-
ness hypotheses (Kalinowski et al., 2020).
The first solution in the partnership is called IAGO
(Artificial Intelligence (AI) for Odor Management,
in Portuguese). It is an AI-powered visual analytics
dashboard that helps to diagnose and forecast odor-
iferous compound, which eventually can be felt by
nearby communities. The underlying goal of IAGO
is to enhance the good relationship with these com-
munities. IAGO was conceptualized and developed
in eight months. Its kick-off event was a modified,
in-person Lean Inception (LI) workshop in December
2019. LI is a five-day, collaborative workshop pro-
posed by Caroli (2018), whose objective is the defini-
tion of an MVP. However, due to time constraints, we
had to conduct the workshop in 2.5 days. We kept all
the activities, but reduced the time in which they were
conducted.In this paper, we report our experience of
co-creating a DT solution with an R&D focus, follow-
ing the Lean R&D approach (Kalinowski et al., 2020).
We report difficulties and obstacles we encountered
in the first iteration of the approach, which includes
a mismatch of expectations from the customer side to
participate in conception phases, as they were eager to
start the development stage. Indeed, we failed to set
the expectation that end users should be present dur-
ing the LI, the definition of the product backlog, and
the design of the prototype user interface. We also re-
port results from questionnaires about the quality and
usability of the final software product, as perceived by
its users.
The remainder of this paper is structured as fol-
lows: in Section 2, we describe related work. Sec-
tion 3 describes the methodology used to develop
IAGO. In Section 4, we discuss positive and negative
Teixeira, B., Ferreira, B., Damasceno, A., Barbosa, S., Novello, C., Villamizar, H., Kalinowski, M., Silva, T., Chueke, J., Lopes, H., Kuramoto, A., Itagyba, B., Salgado, C., Comandulli, S.,
Fischer, M. and Fialho, L.
Lessons Learned from a Lean RD Project.
DOI: 10.5220/0010459803450352
In Proceedings of the 23rd International Conference on Enterprise Information Systems (ICEIS 2021) - Volume 2, pages 345-352
ISBN: 978-989-758-509-8
Copyright
c
2021 by SCITEPRESS – Science and Technology Publications, Lda. All rights reserved
345
experiences we had throughout the design and imple-
mentation process. In Section 5, we conclude with
our final remarks, lessons learned, and future work.
2 RELATED WORK
Currently, there are no reports on applying the Lean
R&D approach in industry-academia collaborations.
In this section, we cover related work and studies that
feature similar approaches and methods.
Sandberg et al. (2011) developed 10 action princi-
ples for industry-academia collaboration: (i) address
activities to ensure results, as the ultimate goal is to
provide industrial benefits and innovation; (ii) ensure
management engagement; (iii) embrace research ne-
gotiations, as industry and academia have different
objectives; (iv) organize get-togethers to facilitate col-
laborations; (v) communicate both progress and re-
sults; (vi) attend to both needs and goals; (vii) be ag-
ile; (viii) fund small research projects; (ix) allow in-
novation to emerge from needs; and (x) realize that
collaborative practice research involves learning – re-
searchers must learn to be agile toward industry needs
and practitioners must learn to appreciate research
rigor (Sandberg et al., 2011).
Lárusdóttir et al. (2014) conducted interviews
with information technology (IT) professionals re-
garding customer involvement in an agile context.
They found that developers value a close relationship
with the customer, which can lead to a better under-
standing of software requirements. However, because
agile does not distinguish between customers and real
users of the system, it can blur the real involvement of
system users. Also, the IT professionals in their study
found it important that the customers integrate the ag-
ile process into their organizational culture, which can
prove to be a challenge, as some prefer to follow a
waterfall process. As one of the study participants
said, “It is difficult to be Agile in a non-Agile envi-
ronment” (Lárusdóttir et al., 2014).The study results
indicate that it is easier to be agile in smaller, more
flexible companies. Because Petrobras is a large, tra-
ditional company, some of these obstacles were found
in the IAGO project.
Kuusinen (2014) conducted a study in a large soft-
ware development company that follows agile R&D
practices to investigate the relationship between the
UX and the developers. They found that problems in
Agile UX were mostly related to process and com-
munication: little or no cooperation between the UX
team and the developers, and not enough time for the
UX design to be concluded before being implemented
by the developers, as the UX team was rarely in-
cluded before the product backlog was created. Con-
sequently, as the amount of work done by the UX/UI
team was usually rushed, they lacked a big picture of
the software product, which hampered their work.
3 METHODOLOGY
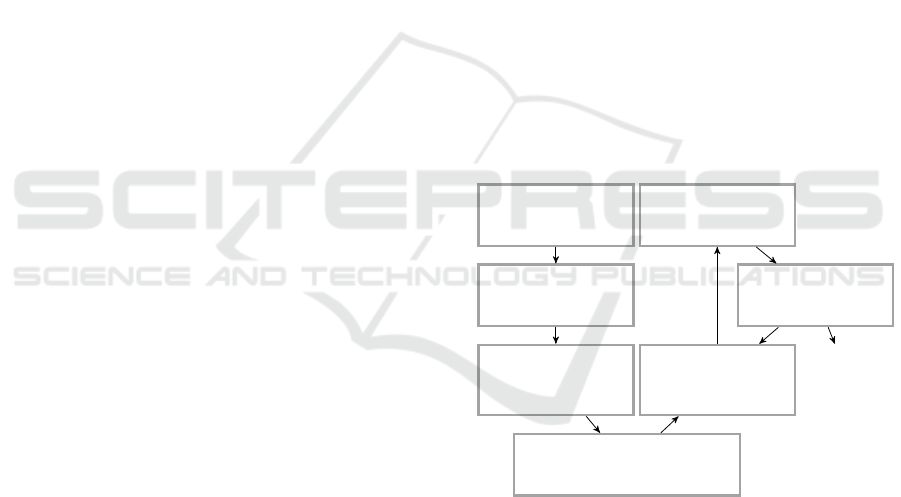
We now describe the Lean R&D methodology used
to develop IAGO. Figure 1 shows the development
process. It started with a brief study of existing solu-
tions regarding odor detection in oil refineries, which
then led to the requirements and MVP definition dur-
ing an LI workshop. The resulting requirements were
then documented through User Stories (US) in Azure
DevOps. The next step was the creation of low-
fidelity wireframes, which were validated and drove
the creation of high-fidelity prototypes. Then, we in-
vestigated different Business Intelligence (BI) plat-
forms to host IAGO. Next, we implemented simple
dashboards, which were evaluated and generated new
investigations of different BI platforms. Once we set-
tled on a platform, we continued the implementation
and development process and concluded the IAGO
project with a usability evaluation questionnaire.
Brief study of
existing solutions
Lean Inception
Backlog
documentation
(Azure DevOps)
Prototype design
(low and high-fidelity)
Investigation of
BI platforms
Implementation
Evaluation
IAGO
Figure 1: Development process.
3.1 Brief Study of Existing Solutions
We started with a brief study of existing solutions.
Petrobras first presented an existing, internal dash-
board, which provides diagnosis for odoriferous com-
pound measurements in oil refineries. However, the
dashboard users mentioned problems with the user
interface, which lacked important information, such
as meteorological data, a log of the complaints and
testimonies by the communities around the refineries
regarding strong odors, and usage data for manage-
ment purposes. The system was also too slow and the
ICEIS 2021 - 23rd International Conference on Enterprise Information Systems
346

machine learning model needed improvement, as the
results were not accurate enough. A migration to a
cloud platform was also desired, as well as the adop-
tion of a robust BI system like Power BI to build the
dashboard, to make the product faster and more us-
able.
As related work, Bashir Shaban et al. (2016) de-
scribe a model to predict concentrations of O
3
, NO
2
,
and SO
2
, whereas Du et al. (2019) present a model to
predict the landfill odor of H
2
S. Nonetheless, neither
of the studies present dashboards to monitor these re-
sults. Yousif (2016) presents a model to predict H
2
S
concentration and implemented a real-time forecast-
ing system for catastrophic conditions, which sends
a suitable warning alarm to the controller. However,
it is unclear how the alarm reaches the users because
there are no mentions of its user interface.
Cadei et al. (2019) developed a real-time, end-to-
end tool to monitor H
2
S emissions in an oil and gas
field, using machine-learning and data mining tech-
niques to raise alarms and then provide prescriptive
information. Their solution also features a dedicated
dashboard to monitor the risks of high H
2
S levels and
model performance.
We were unable to find other solutions that would
be of value to our case. Oil, gas, and refinery plants
have very specific inner workings, and each has its
own unique processing scheme (Groysman, 2017).
Although similar solutions to similar problems can
be adopted, a further study into each specific plant
is necessary. Therefore, the next step of this work
comprises an LI workshop used to provide more in-
formation on the specifics of the IAGO project.
3.2 Lean Inception
We conducted a 2.5-day LI workshop with client rep-
resentatives of business areas, IT experts, potential
users, and the ExACTa development team.
The main goal of an LI is to define the scope of
an MVP. It includes the following activities: (i) defi-
nition of the product vision, following a specific tem-
plate; (ii) definition of the scope of the product, list-
ing what it is and is not, and what it does and does not
do; (iii) creation of personas; (iv) brainstorm of prod-
uct features, performed individually at first, and then
unified; (v) business, technical, and user experience
(UX) review, in which each participant has to pro-
vide a score for how well they understand each fea-
ture and how it will be implemented, and a score from
one to three on each of three dimensions – the busi-
ness, technical, and UX impact of each mapped fea-
ture –; (vi) creation of user journeys for each persona;
(vii) definition of a sequence of the mapped features
according to a set of rules based on their business,
technical, and UX scores, which are then evaluated
by the participants and broken into different MVPs;
and (viii) finalizing the MVP canvas (Caroli, 2018).
The first three activities, although performed in
groups, were mostly carried out by Petrobras repre-
sentatives, because the ExACTa participants had not
had any contact beforehand with the domain, business
context, and requirements of the IAGO project. For
instance, when creating personas, an in-depth knowl-
edge of the system’s users is necessary, and the Ex-
ACTa participants did not have that expertise. Al-
though the LI workshop does encourage collaboration
among teams, it does not mention the kinds of knowl-
edge each participant needs to have about the problem
domain beforehand. The problem is defined in the
first two activities, but it proved to be hard to follow
for those who had never even been to an oil refinery.
The fourth activity was a brainstorming of prod-
uct features, performed individually. Because of the
first three stages, by then the ExACTa team had a
deeper understanding of the problem. Every partic-
ipant was able to come up with a few features during
the brainstorming session, but the Petrobras represen-
tatives proposed more complex and specific features,
due to their expertise in the field of oil refineries.
The fifth activity took the longest time and gener-
ated the most hesitation and uncertainty among par-
ticipants. In this step, each participant must provide
a score of how much each feature impacts: business,
technical, and user experience (UX) aspects. Because
the IAGO project is grounded in Research & Devel-
opment, some of the features identified were not fully
clear. For instance, one feature that generated a lot
of debate was “Real-time inference of environmental
issues”. It was clear to participants what that feature
meant: to predict the possibility of a person feeling
odoriferous compounds from the plant. However, it
was not clear how this would be done and what ef-
fort it would require, as it entails a potentially long
research and experimentation period, with testing of
different AI models. Therefore, in the dimension of
technical impact, it received a score of three – the
maximum score. The uncertainty behind that feature
made it challenging to estimate its effort, and the LI
workshop does not go into detail regarding complex
features, commonly found in R&D projects.
Then, in groups, participants drew the user jour-
ney for each persona. The idea was to see how the
identified features would be included in the tasks per-
formed by each persona in their daily routines. This
step was performed without any problems.
The next activity was the definition of a sequence
of the identified features. This sequence would also
Lessons Learned from a Lean RD Project
347

help define the scope of the MVP. Because of all the
issues left unanswered in the fifth activity, this one
was also challenging. Many participants had different
views regarding what needed to be delivered as the
first MVP, and what features could be delivered as a
second or even third MVP, but we came to a conclu-
sion that the first MVP would encompass 17 features.
Once the MVP was defined, we filled an MVP canvas
with all the knowledge generated from the workshop.
The canvas aimed to guide the conception and devel-
opment stages that would follow.
3.3 Backlog Documentation (Azure
DevOps)
After the LI, the next step in the Lean R&D approach
is usually a workshop called Product Backlog Build-
ing (PBB) (Aguiar and Caroli, 2020). It helps to
structure User Stories (US), which have a specific
template for software requirements: “As a [role], I
want [goal], so that [reason]” (Cohn, 2004). How-
ever, in the IAGO project, we were not able to con-
duct the PBB workshop because, as many hours had
been spent in the LI workshop, the business represen-
tatives and potential users of the system were unable
to participate in another workshop. Hence, the US
definition was done by the ExACTa team, relying on
the understanding and knowledge they had obtained
in the LI workshop.
This generated a multitude of questions that
needed to be answered. Although the PBB workshop
was not conducted, daily informal meetings were
held with customer representatives, who helped solve
some of the emerging doubts. Still, new queries arose
often, as the ExACTa team had no experience in the
field of oil and gas refineries. Other issues were re-
lated to data gathering: to build a machine learning
model, large amounts of structured data are necessary,
and obtaining them took longer than first estimated
when defining the MVP.
3.4 Prototype Design (Low and
High-fidelity)
Once the product backlog was defined, the UX team
started working on low-fidelity paper prototypes. Pa-
per prototypes are fast and allow developers and de-
signers to demonstrate the behavior of an interface
very early in development (Rettig, 1994). We were
only able to validate those prototypes with customer
representatives from research and business areas, but
not with real users. As real users work within refin-
ery plants and are often occupied with surveying real-
time environmental issues that may be happening, it
is not practical to have frequent meetings with them.
End-user participation occurred in two stages: to de-
fine the main features and characteristics of the first
MVP; and to test and use the final product.
Hence, as other representatives from the customer
side validated the proposed sketch of user interface
(UI) and interaction design, the UX team moved on
to designing high-fidelity prototypes to guide the de-
velopers involved in the IAGO project. This was done
using Adobe XD
1
, a UX/UI design collaboration tool.
The high-fidelity prototype was available online
and was shared with the customers. Some of them
left comments, which were then taken into account
as new versions of the high-fidelity prototype were
created. The UI was designed without a specific BI
platform in mind, as no decisions had been made in
that regard at that point.
3.5 Investigation of BI Platforms
Before the implementation stage, we had to choose a
BI platform to host IAGO. Because of the experimen-
tation nature of this project, we tested different plat-
forms and found some limitations. We tried to repli-
cate the high-fidelity prototype on these platforms,
but encountered performance and usability issues.
We settled on Power BI, which was already used
by Petrobras. The developers found its learning curve
to be shorter than the other platforms’. We were able
to reproduce the high-fidelity prototype with great
similarity, which means that the UI had already been
approved by the customer. The end users, however,
had yet to test and evaluate the system. Their evalua-
tion is described in Section 3.7.
3.6 Implementation
The implementation stage was performed in three si-
multaneous activities: (i) Data analysis and develop-
ment of a machine learning model; (ii) Serverless ar-
chitecture building; and (iii) Design and development
of a dashboard. This paper focuses on the latter.
Figure 2 depicts IAGO’s user interface. IAGO
supports two main goals: making decisions when
dealing with an odor event, and preventing the odor
event by analyzing historic data. With that in mind,
we designed a 3-part dashboard: (i) the main visual-
ization, which shows historic measurements of odor-
iferous compound; (ii) the “Cards” tab, which pro-
vides information about the possible causes for those
measurements; and (iii) the “Inquiries” tab, which
lists the registered inquiries or complaints from the
community.
1
https://www.adobe.com/products/xd.html
ICEIS 2021 - 23rd International Conference on Enterprise Information Systems
348
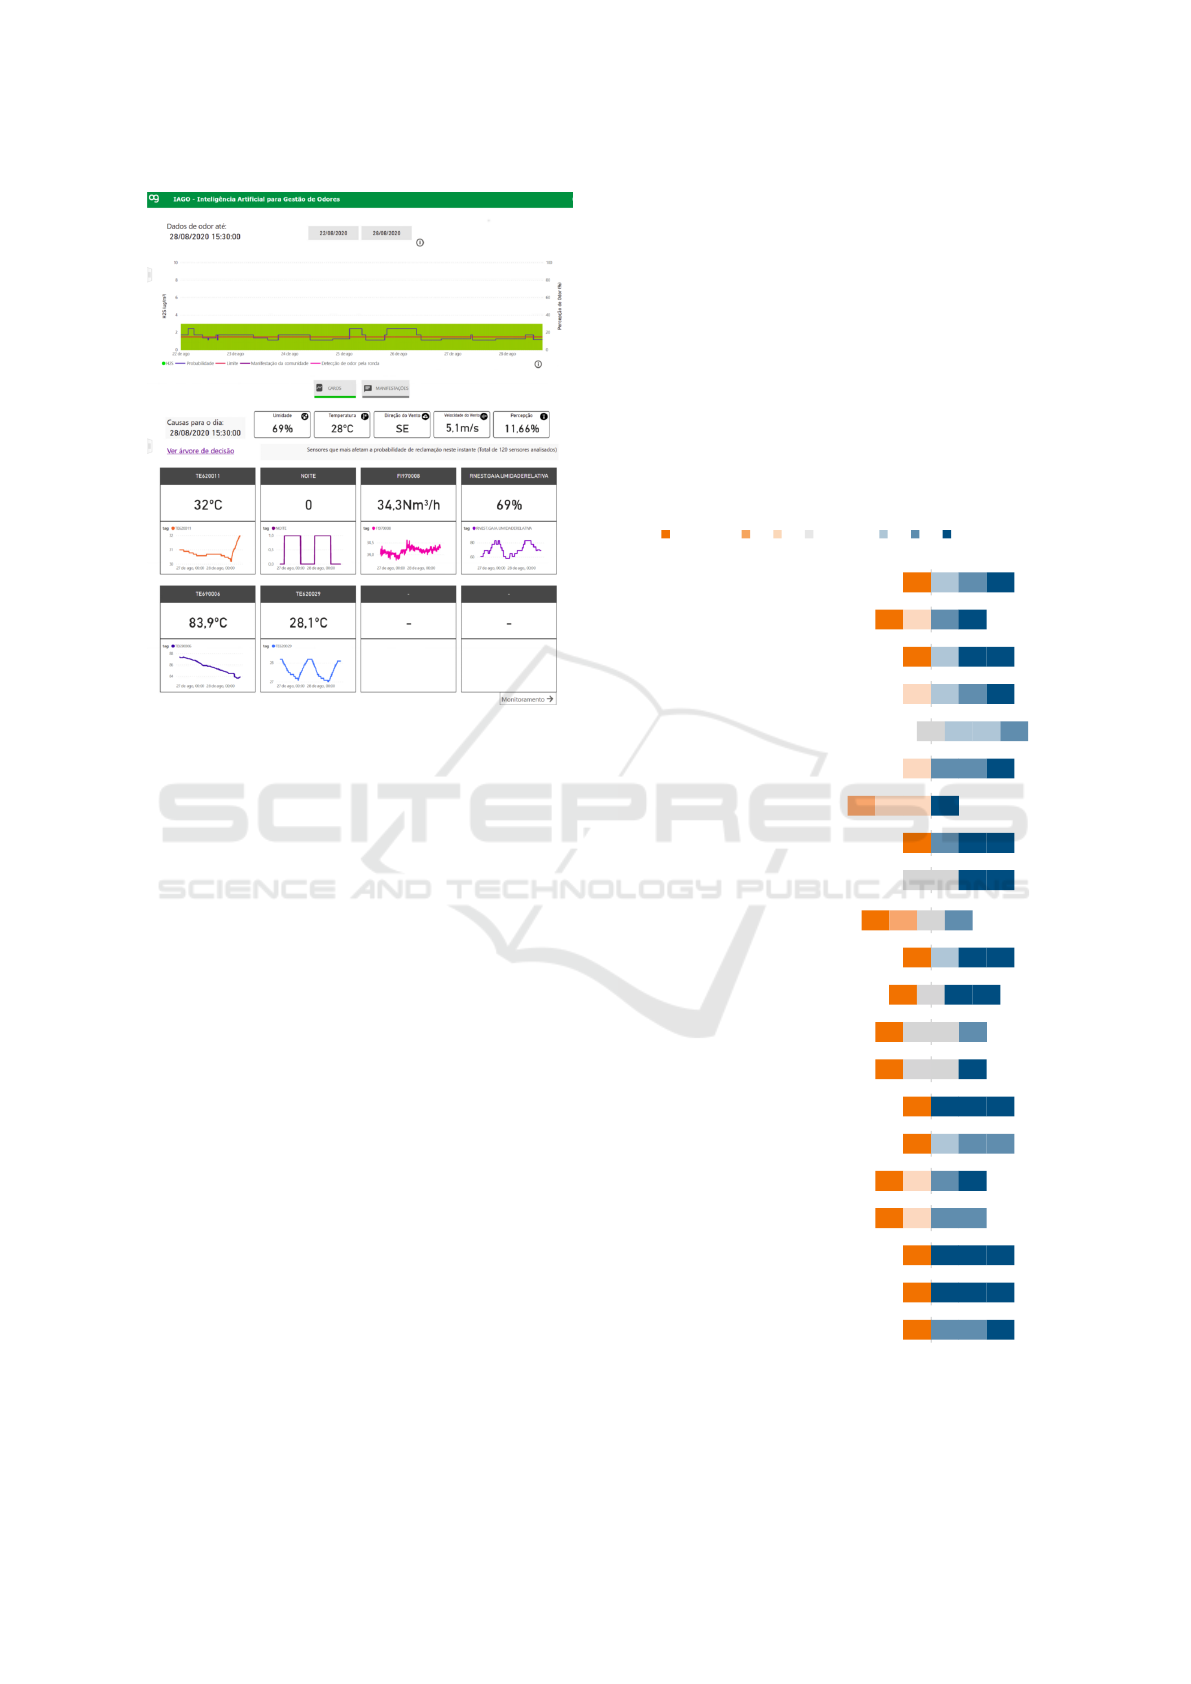
Figure 2: IAGO’s interface.
The main visualization comprises a bar chart and a
line chart. The bars represent the measure of the
odoriferous compound over time. The bar colors can
be green, yellow, or red. Green means the value of
the measure of odoriferous compound is below an
estimated threshold, yellow means it is close to the
threshold or slightly above it, and red means it is way
over the threshold. The line represents the probability
of a person feel odoriferous compound, as calculated
by the AI model.
Power BI provides a “Filters” tab, where the user
can pick a date and time range that affects the whole
dashboard. It is also possible to select a relative date
range. By default, IAGO shows the data from the last
7 days, as of the current day.
Below the main visualization, there are two possi-
ble visualizations: “Cards” and “Manifestation”. The
“Cards” tab shows meteorological data and possible
causes for the odoriferous compound measurement
in a given time. These causes are the most impor-
tant features selected by the AI model. Each cause
is represented by its name, its description, its value
in that given time, and also an associated line chart
that shows the history of that value in a recent period.
The “Manifestation” tab shows a table of registered
manifestations in that time range, with attributes like
location, intensity of the odor, whether it is plausible
or not, and others.
3.7 System Evaluation
The evaluation was performed using an online ques-
tionnaire based on the Technology Acceptance Model
(TAM) (Davis, 1989) and the Questionnaire for User-
Interaction Satisfaction (QUIS) (Harper et al., 1997),
which are questionnaires widely used in the literature
to evaluate interactive systems.
Four users evaluated IAGO after at least 3 weeks
of usage. Figure 3 depicts their answers in the ques-
tionnaire. For most of our analysis, we contrast the
answers provided by P3 and P1, depicted in boldface
in the chart, as they often had opposite opinions.
Learning to operate IAGO was easy
Learning to operate IAGO was quick
It is easy to find the information that I
need
IAGO’s interface is pleasant
The amount of information that can be
displayed on screen is adequate
The arrangement of information on
screen is logical
I like to use IAGO’s interface
Terminology relates well to the work I am
doing
Messages that appear on screen are
clear
IAGO keeps me informed about what it
is doing
Tasks can be performed in a straight-
forward manner
Steps to complete a task follow a logical
sequence
Performing an operation leads to a
predictable result
Results presented by IAGO help me
accomplish my tasks
Response time for most operations is
fast enough
IAGO is reliable
IAGO can increase my job productivity
IAGO has all the functionalities that I
would want
I believe IAGO can help reduce the
number of complaints from communities
near the refineries
I believe IAGO can help identify causes
of H₂S concentrations
Overall, I am satisfied with IAGO
P3
P2
P4
P1
P3
P2
P4
P1
P3
P2
P4
P1
P4
P3
P2
P1
P4
P3
P2
P1
P3
P4
P2
P1
P4
P3
P2
P1
P3
P2
P4
P1
P3
P2
P4
P1
P3
P2
P4
P1
P3
P2
P4
P1
P3
P2
P4
P1
P3
P4
P2
P1
P3
P2
P4
P1
P3
P4
P2
P1
P3
P2
P4
P1
P3
P2
P4
P1
P3
P2
P4
P1
P3
P4
P2
P1
P3
P4
P2
P1
P3
P4
P2
P1
Disagree Neutral Agree
Figure 3: IAGO’s evaluation.
Overall, it is clear that P3 had a negative standpoint,
whereas P1 seemed to enjoy all aspects of the sys-
Lessons Learned from a Lean RD Project
349

tem. The questionnaire also featured open-ended
questions, and we found that P3 will be working with
system maintenance. P3 mentioned negative aspects
regarding code documentation and lack of a manual
to be used for maintenance. We believe P3’s perspec-
tive may have been biased by their role, as they may
had viewed dealing with IAGO as a burden.
P3 also mentioned that IAGO’s main calculation
should be different, but this was a functional require-
ment for the system decided by Petrobras. As the
questionnaire responses were anonymous, we do not
know the identity of P3, but it appears that they did
not participate in the LI. As their role as system main-
tainer is crucial to the future of IAGO, they should
have been included in the early conception phases
and their input should have been heard. It seems like
IAGO did not meet their expectations, and their in-
clusion in the LI might have avoided this issue and
possible resentment towards the system.
By contrast, P1 agreed to most of the provided
statements, i.e., had a positive view of IAGO, claim-
ing that “the interface is easy, logical, and organized;
the information presented is adequate; and it allows
filtering by specific periods”. Although we cannot be
sure, we tend to assume that P1 was present in the LI,
as most of their expectations seem to have been met.
P2 and P4 seemed mostly positive in their re-
sponses, but not as strongly. There was some varia-
tion between positive, neutral, and negative opinions.
Because their responses were not intense like P1’s and
P3’s, we argue that they can use the system without
major issues.
An interesting disparity found in the scores is re-
lated to the UI. Most participants stated they found
the UI ‘pleasant’, but when providing scores for the
statement “I like to use IAGO’s interface”, most an-
swers were negative. This shows that, even though a
design can “look nice”, it may not be fully functional
and meet the users’ expectations in terms of usability.
We argue that the lack of user involvement is the most
probable cause for this problem, since we were not
entirely aware of the end users’ perspectives, needs,
and values.
In general, most answers were positive. Never-
theless, there are clear issues with certain users and
certain aspects of IAGO, which might have been pre-
vented with the inclusion of users in the early concep-
tion phases. The design team played a sort of “guess-
ing game”, which worked to an extent, but the ques-
tionnaire results show that it was not enough and gen-
erated some user dissatisfaction.
3.8 Lessons Learned by Developers
We interviewed three developers from the ExACTa
team involved in the IAGO project. Each interview
lasted about two hours. During the interviews, par-
ticipants discussed negative and positive points, de-
tailing what worked and what did not work in each
LI activity, which is the foundation for identifying the
project’s requirements. Participants also provided ob-
servations about the Lean R&D process overall. After
conducting the interviews, we performed a qualitative
analysis adopting some Grounded Theory (GT) pro-
cedures, especially coding, i.e., the process of assign-
ing meaning to data (Corbin and Strauss, 2007). We
identified the following categories of lessons learned:
Expectation alignment, Collaboration between teams
and stakeholders, Feature identification, Generated
requirements, User interface conceptualization, and
Importance of end-user participation.
Expectation Alignment. The developers agreed that,
during the LI, the objective of aligning expectations
was achieved. In addition, participants mentioned that
several activities of the LI helped align the objectives
about the software to be created.
Collaboration between Team and Stakeholders.
Because of the informal nature of the LI, the partici-
pants felt comfortable to collaborate and to contribute
to the discussions: “The process felt laid-back and
people were comfortable to express themselves” - P1.
The LI activity that most contributed to the collabo-
ration between participants was the brainstorming of
product features.
Feature Identification. This item is related to the
previous ones, as the alignment of the expected objec-
tives and the ability to speak freely felt by the partic-
ipants allowed for efficient feature identification. The
persona technique helps to see features from the point
of view of end users. The user journey helps iden-
tify the context of use. After identifying the features,
the LI has an activity to help prioritize them, which is
the business, technical, and UX review. Despite the
developers’ perception that this step helps prioritize
the features, some aspects of the activity are not clear.
Participants have only a general idea of the features
and of the product goal, so there is not enough infor-
mation to provide an accurate estimate of needed ef-
fort. Therefore, to reduce the lack of detail, for future
projects, we will plan thorough meetings to help the
development team get more business knowledge be-
fore the LI workshop. This way, the workshop will fo-
cus more on aligning the project’s goals and on prior-
itizing features than on understanding requirements.
Generated Requirements. After the LI, several
meetings were conducted to elicit requirements and
ICEIS 2021 - 23rd International Conference on Enterprise Information Systems
350

to perform validations with the stakeholders. To fa-
cilitate system maintenance, Petrobras decided that
the dashboard platform should be low-code. This was
settled after the LI in meetings with the customers,
but no decisions were made regarding what specific
tool should be used. As continuous experimentation
suggests, different platforms were tested and we set-
tled on Power BI. However, there were issues with
the transition between platforms: “We had to mi-
grate the entire database in the middle of the project,
and the deadline was too tight. Some decisions were
made without proper deliberation, because of time
constraints.” - P1.
User Interface Conceptualization. This step had
positive and negative aspects, since the platform to be
used for the UI had not been chosen when the UI was
designed. Due to the low-code nature of BI platforms,
the development team could not follow the UI design
proposal created earlier by the UX/UI team. To work
with the platform limitations, the UX/UI team pro-
posed a new UI design that would work with the de-
fined platform. The UI prototypes helped the develop-
ers understand the requirements, acting as a founda-
tion for the software development. In future projects,
when working with a low-code platform, it is imper-
ative that both developers and designers know its po-
tential and limitations.
Importance of End-user Participation. The devel-
opers’ participation in the workshop helped them get
an idea of how important end users are when under-
standing the problem to be solved by the final soft-
ware product. However, because there were no actual
end users in the LI, only end-user representatives –
like their managers –, the team struggled to define the
requirements. To help mitigate the lack of end-user
participation in the LI, after implementing the UI, we
held meetings with end users to validate the final soft-
ware. The users were also asked to create, weekly,
a list of adjustments that should be made to improve
usability. To minimize rework after the software im-
plementation, it is important to ensure that at least one
end user participates in the LI workshop.
4 DISCUSSION
The Lean R&D approach leaves some aspects under-
specified. In this section, we review these aspects,
some of which were highlighted by the interviews
with the development team.
Before the LI, which marks the beginning of the
project, there should be a conversation with domain
specialists. The IAGO project focuses on a very spe-
cific part of oil refineries, which were new to the Ex-
ACTa team working on the project. If there had been
a knowledge-sharing event prior to the LI, the tech-
nical team would have been able to participate in the
discussions much more efficiently.
The end users were also not present in most of
the project, participating only in a few meetings and
testing the final product. Although certain approaches
and techniques such as User-Centered Design (Abras
et al., 2004) state the importance of having the user
involved throughout the design and development pro-
cess, the Lean R&D approach does not clearly spec-
ify how and when the end user, or other stakeholders,
should participate. As the IAGO project was one of
the first projects using the approach, it became clear
that end-user involvement should be non-negotiable
in future projects when planning some workshops and
meetings, especially during the LI, where the require-
ments start taking shape. Also, as discussed by Lárus-
dóttir et al. (2014), the lack of distinction in many ag-
ile processes between customers and end users can
cause a false sense of user involvement: although
customers were present in the LI, there were no ac-
tual users of the final product in the workshop and
throughout most of the project. This problem became
apparent in the system evaluation questionnaire re-
sults.
One of Lean R&D’s building blocks is “strategi-
cally aligned continuous experimentation to test busi-
ness hypotheses”. We argue that, besides business hy-
potheses, it is also imperative to study and evaluate
user needs so that the final product is valuable to both
the company and the end user. With users involved
from the start, their opinions, preferences, values, and
feedback can help shape the product into something
they can incorporate into their daily routine.
Lean R&D is grounded in agile, continuous ex-
perimentation, which allows solution options to “fail
fast”. However, it is important to make sure that the
team views these “failures” as a natural part of the ex-
perimentation process, not as problems. In the IAGO
project, when platform limitations were found and
evaluated, the team felt discomfort in having to switch
platforms, but this type of change is welcome and ex-
pected in Lean R&D. Thus, the team’s mindset should
be prepared for these types of situations, which are
normal and acceptable in research and development
projects which feature great deals of uncertainty.
Nonetheless, despite failures being a part of con-
tinuous experimentation, it is essential that changes
be communicated and validated with the stakehold-
ers. When there was a switch in BI platforms in the
IAGO project, there had to be confirmation that the
chosen platform would be approved for deployment
within the company. This depends on a clear align-
Lessons Learned from a Lean RD Project
351

ment between the technical team, the business repre-
sentatives of the customer side, and the IT department
on the customer side. This communication network is
crucial for Lean R&D projects to work. For solutions
to be delivered in an agile way, there must be an align-
ment among all stakeholders.
5 CONCLUSIONS
Through our experiences, interviews with develop-
ers, and usability data from questionnaires with end
users, we have learned interesting lessons from ap-
plying Lean R&D in an industry-academia collabora-
tion in the oil and gas field, specifically in the IAGO
project.
We found that not only communication with all
stakeholders is crucial for this type of agile collabo-
ration, but also, in particular, end-user involvement is
key to avoid misunderstandings and rework. Because
of the short cycles with frequent deliveries and the
experimentation nature of the process, it is important
to continually evaluate the evolving solution with the
end users and customers and keep all parties informed
about changes in the project.
When following the Lean R&D approach in the
future, we plan to schedule early knowledge-sharing
meetings about the domain, so that all participants in
the LI workshop will be able to make well-informed
decisions and elicit features and requirements that are
valuable to both the business and the end users.
REFERENCES
Abras, C., Maloney-krichmar, D., and Preece, J. (2004).
User-Centered Design. In In Bainbridge, W. Ency-
clopedia of Human-Computer Interaction, Thousand
Oaks. Sage Publications.
Aguiar, F. and Caroli, P. (2020). Product Backlog Building:
Concepção de um Product Backlog Efetivo. Editora
Caroli.
Bashir Shaban, K., Kadri, A., and Rezk, E. (2016). Ur-
ban Air Pollution Monitoring System With Forecast-
ing Models. IEEE Sensors Journal, 16(8):2598–2606.
Cadei, L., Camarda, G., Montini, M., Rossi, G., Fier, P.,
Bianco, A., Lancia, L., Loffreno, D., Corneo, A., Mi-
lana, D., Carrettoni, M., and Silvestri, G. (2019). Pre-
diction and prescription of operation upset in H2S gas
sweetening unit: Implementation of an innovative big
data analytics procedure. In Offshore Mediterranean
Conference, pages 1–9, Ravenna.
Caroli, P. (2018). Lean Inception: Como Alinhar Pessoas e
Construir o Produto Certo. Editora Caroli, 1st edition.
Cohn, M. (2004). User Stories Applied: For Agile Software
Development. Addison-Wesley Professional, USA.
Corbin, J. and Strauss, A. (2007). Basics of Qualitative
Research: Techniques and Procedures for Developing
Grounded Theory. SAGE Publications, Inc, Los An-
geles, Calif, 3rd edition edition.
Davis, F. D. (1989). Perceived Usefulness, Perceived Ease
of Use, and User Acceptance of Information Technol-
ogy. MIS Quarterly, 13(3):319–340.
Du, D., Jiang, X., Sun, H., and Nie, Z. (2019). An
APSO-BP Prediction Modeling of Malodorous Gas
in Landfill Based on Historical Data. In Proceedings
of the 2019 International Conference on Artificial In-
telligence and Computer Science, AICS 2019, page
390–393, New York, NY, USA. ACM.
Groysman, A. (2017). Corrosion problems and solutions
in oil, gas, refining and petrochemical industry. Ko-
roze a ochrana materialu, 61(3):100–117. Publisher:
Sciendo Section: Koroze a ochrana materialu.
Harper, B. D., Slaughter, L. A., and Norman, K. L. (1997).
Questionnaire Administration Via the WWW: A val-
idation & Reliability Study for a User Satisfaction
Questionnaire. In Proceedings of World Conference
on the WWW, Internet and Intranet, WebNet 97.
Kalinowski, M., Lopes, H., Teixeira, A. F., da Silva Car-
doso, G., Kuramoto, A., Itagyba, B., Batista, S. T.,
Pereira, J. A., Silva, T., Warrak, J. A., da Costa, M. S.,
Fischer, M., Salgado, C., Teixeira, B. R., Chueke, J.,
Ferreira, B., Lima, R., Villamizar, H., Brandão, A.,
Barbosa, S. D. J., Poggi, M., Pelizaro, C., Lemes, D.,
Waltemberg, M., Lopes, O., and Goulart, W. (2020).
Lean r&d: An agile research and development ap-
proach for digital transformation. In Morisio, M.,
Torchiano, M., and Jedlitschka, A., editors, Product-
Focused Software Process Improvement - 21st In-
ternational Conference, PROFES 2020, Turin, Italy,
November 25-27, 2020, Proceedings, volume 12562
of Lecture Notes in Computer Science, pages 106–
124. Springer.
Kuusinen, K. (2014). Improving UX Work in Scrum De-
velopment: A Three-Year Follow-Up Study in a Com-
pany. In Sauer, S., Bogdan, C., Forbrig, P., Bernhaupt,
R., and Winckler, M., editors, Human-Centered Soft-
ware Engineering, Lecture Notes in Computer Sci-
ence, pages 259–266, Berlin, Heidelberg. Springer.
Lárusdóttir, M. K., Cajander, Å., and Simader, M. (2014).
Continuous Improvement in Agile Development Prac-
tice. In Sauer, S., Bogdan, C., Forbrig, P., Bernhaupt,
R., and Winckler, M., editors, Human-Centered Soft-
ware Engineering, Lecture Notes in Computer Sci-
ence, pages 57–72, Berlin, Heidelberg. Springer.
Rettig, M. (1994). Prototyping for tiny fingers. Communi-
cations of the ACM, 37(4):21–27.
Sandberg, A., Pareto, L., and Arts, T. (2011). Agile Col-
laborative Research: Action Principles for Industry-
Academia Collaboration. IEEE Software, 28(4):74–
83. Conference Name: IEEE Software.
Yousif, J. H. (2016). Forecasting Hydrogen sulfide Level
Based Neural Computation. International Journal of
Computation and Applied Sciences, 1(1):21–26.
ICEIS 2021 - 23rd International Conference on Enterprise Information Systems
352
