
Modeling the e-Inclusion Prediction System
Ieva Vitolina
a
, Atis Kapenieks
b
and Ieva Grada
c
Riga Technical University, Kalku Street 1, Riga, LV-1658, Latvia
Keywords: e-Inclusion, Machine Learning, Predictive Analytic.
Abstract: e-Inclusion aims to provide the benefits of digital technology for every member of society. Digital skills and
their meaningful use are a prerequisite for everyone to be e-included. The improvement of learning outputs
of online and blended courses on digital skills is therefore an important aspect of ensuring an e-included
society. Due to the use of learning management systems and their ability to collect data on students, different
types of student data become available for analysis. We proposed the data-driven approach which uses student
data and machine learning algorithms to predict learning outcomes. The goal of this article is to present the
conceptual architecture and prototype of the e-inclusion prediction system which is based on a combination
of several algorithms and uses a machine learning approach.
1 INTRODUCTION
E-inclusion aims to provide the benefits of
information and communication technology (ICT) for
every member of society. Digital skills and their
meaningful use are a prerequisite for everyone to be
e-included. E-inclusion means both inclusive ICT and
the use of ICT to achieve wider inclusion objectives.
The development of ICT is ongoing, so it should be
ensured that the acquisition and application of digital
skills are also in line with ICT innovation (EC, 2020).
Nowadays, acquiring skills through online and
blended courses is one of the learning opportunities.
However, research shows that only a small percentage
of people who take online courses complete them
(
Eurostat, 2020)
. The second problem with skills
acquisition is related to scrap learning. According to
a CEB Global (2014) study, for the average
organization, 45% of learning investments are scrap
learning - learning that is delivered but not applied
back on the job. The improvement of learning outputs
of online and blended courses on digital skills is
therefore an important aspect of ensuring an e-
included society. It is important to find out how to
predict students' learning outcomes, especially their
use of newly acquired digital skills, which would
indicate that students will be e-included.
a https://orcid.org/0000-0002-7089-1326
b https://orcid.org/0000-0002-3082-5922
c https://orcid.org/0000-0002-6318-9141
The data-driven approach, which uses student
data and machine learning algorithms to train models,
has been widely used in the education sector. Nafukho
et al. (2017) examined factors related to training
design, training delivery, student motivation, and the
workplace environment to predict how these factors
impact skill usage in a work placement. Testers et al.
(2020) concluded that motivation to learn, expected
positive personal outcomes, and learner readiness
were predictors for training transfer in workplace.
However, there is little evidence that the current
application of learning analytics in education
improves students' learning outcomes, learning
support, and teaching (Viberg et al., 2018). Prediction
models are without a mechanism that assists the
interpretation of machine learning results. An
essential issue is to find out how to deliver the results
of analytics corresponding to the expectation of
learners and instructors to improve the learning
process (Miteva, & Stefanova, 2020).
This article continues the presentation of our
previous research related to e-inclusion prediction.
The contribution of this study is to address the e-
inclusion prediction problem and to provide the
concept of the e-inclusion prediction system and
prototype. The goal of this article is to present the
conceptual architecture and prototype of the e-
258
Vitolina, I., Kapenieks, A. and Grada, I.
Modeling the e-Inclusion Prediction System.
DOI: 10.5220/0010458302580265
In Proceedings of the 13th International Conference on Computer Supported Education (CSEDU 2021) - Volume 2, pages 258-265
ISBN: 978-989-758-502-9
Copyright
c
2021 by SCITEPRESS – Science and Technology Publications, Lda. All rights reserved
inclusion prediction system which is based on a
combination of several algorithms and uses a machine
learning approach.
2 METHODOLOGY FOR
BUILDING PREDICTIVE
MODELS
Predictive modeling is a process of building models
for predicting the future behavior of our data. It
includes: understanding the data and defining the
objective of the modeling; collection, pre-procesing
and splitting of data; model building and evaluation,
deployment of the selected model (Kuhn & Johnson,
2013). These phases are iterative and incremental.
The process of building the e-inclusion prediction
system corresponds to the following processes: (i)
problem definition, (ii) data analysis for feature
selection and (iii) model training and validation
iterations. These processes have been presented in our
previous research (Vitolina, and Kapenieks, 2013;
Vitolina, and Kapenieks, 2020).
In this article, the main focus is on the model
deployment phase. According to Maskey (2019), in
order to deploy the model, it is necessary to: (i)
evaluate the model’s performance in production, (ii)
collect and store additional data from user
interactions, (iii) interpret numerical outputs from the
model, (iv) plan retraining frequency.
3 e-INCLUSION PREDICTION
SYSTEM
3.1 Context Level Data Flows of the
e-Inclusion Prediction System
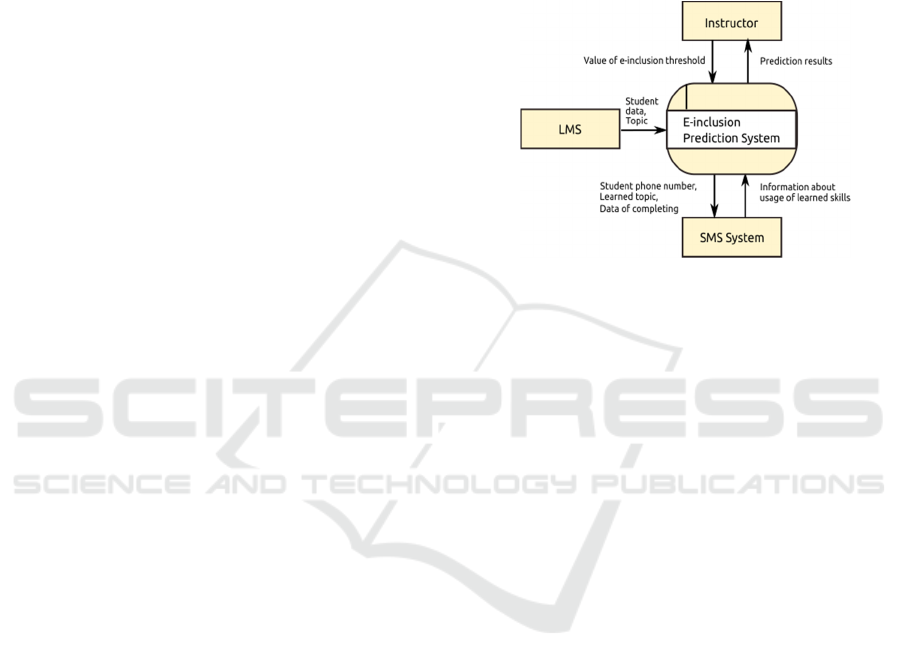
The main goal of the e-inclusion prediction system is
to determine student with e-inclusion risk. Figure 1
presents a context-level data flow diagram for the e-
inclusion prediction system. The main user of e-
inclusion prediction system is an instructor who
teaches students in the blended e-learning courses.
The instructor sets values of the e-inclusion degree
threshold level and receives information on risk
students and risk factors. The e-inclusion prediction
system receives student data and the topic from the
learning management system (LMS). We decided to
use Moodle as a LMS because Moodle is the default
system in our university, and it is also one of the most
widespread open-source platform in the world
(Moodle, 2020). To get feedback from students on the
usage of the learned skills, we decided to send SMS
messages to students' smartphones. The decision to
use the SMS approach for communication with
students is based on our previous successful
experience delivering blended learning courses by the
multi-screen approach (Kapenieks et al., 2014) . Then
the database is supplemented with data on the actual
use of newly acquired skills.
Figure 1: Context-level data flow diagram showing the re-
lationship between the e-inclusion prediction system, in-
structor, LMS, and SMS system.
3.2 Basic Processes of the e-Inclusion
Prediction System
As basic processes of the e-inclusion prediction
system we determine (1) data pre-processing, (2)
training and evaluation of the PREDICT model, (3)
prediction of at-risk students, and (4) quality
monitoring of the prediction performance.
3.2.1 Data Pre-processing
Data pre-processing for the e-inclusion prediction
system includes data quality assessment, data
cleaning, data transformation (García et al., 2015).
To ensure the quality of the data, we obtain the
data as structured tables from the Moodle system. The
data are students' answers to our pre-designed
questionnaire questions. We based the Moodle survey
questions on knowledge management theory to get
students' answers and transform them as features for
prediction (Nissen, 2006). During the data
preparation step, the system maps the student data
obtained from the LMS to the feedback data obtained
from the SMS system. Incomplete data are cleaned
out of the database when the training course is over.
In this pre-processing step, the system also
calculates feature values from student data. The
output of the data pre-processing is a student database
that is used for model training and prediction.
Modeling the e-Inclusion Prediction System
259

3.2.2 Model Building Process
The second process of the e-inclusion system is
training and evaluation of the prediction model.
Pachler (2010) reveals the diversity of factors that
influence the choice to use ICT. Based on our
previous research as input for training purposes the e-
inclusion prediction system uses the following
features: (I) student’s motivation in learning; (ii)
student’s ability to learn; (iii) instructor’s willingness
to share knowledge; (iv) student’s assessment of e-
learning environment; (v) student’s evaluation of e-
learning materials; (vi) student’s knowledge level
before learning; (vii) student’s digital skill level; (viii)
student’s predicted use of the newly learned skills
(Vitolina, and Kapenieks, 2013; Vitolina, and
Kapenieks, 2014).
We labeled each learner record of the data set as
e-included or not e-included. We defined that the
value is e-included if we observed that the learner
uses newly learned skills. The value is not e-included,
if we observed that the learner doesn’t use newly
acquired skills. The data set contains 435 not e-
included learners and 493 e-included learners. We
named this attribute as observed usage of newly
learned skills. The dependent variable of the linear
regression model is the numeric variable – the degree
of e-inclusion which is a combination of the learner’s
predicted and observed usage of newly acquired
digital skills. We merged data from the several
blended learning courses and topics. The participants
of the courses were teachers who were improving
their digital skills in continual education courses.
After several iteration of model training and
evaluation we concluded that student’s e-inclusion
can be predicted by combination of several prediction
models (Vitolina and Kapenieks, 2020a).
Figure 2 presents an algorithm for e-inclusion
prediction learned in the training phase. Three
different prediction models M1, M2, and M3 are
trained, then predictions of these models are
combined and final prediction is calculated.
Model M1 is an ensemble classification based
prediction model that combines predictions of
lazy.LWL with Random Forest, LMT, and Simple
Logistic algorithms using the majority vote approach.
Prediction Model M2 is based on the K-means
clustering algorithm, it divides students into 2
clusters, where each of the clusters corresponds to the
e-included or not-e-included group. Prediction Model
M3 is a multiple linear regression model that predicts
that the learner is digitally excluded corresponding to
the previously set e-inclusion threshold. Calculation
of final prediction PREDICT is explained in more
detail in section: 4.1.2.
The decision for a more appropriate prediction
model is based on training and model evaluation
using open source data mining WEKA platform (
Hall,
2009).
For Model M1 and Model M3 evaluation, we
used cross-validation, for clustering Model M2 we
used WEKA mode – classes to clusters evaluation.
Cross-validation is an appropriate validation method
for a small data set (Yadav, & Shukla, 2016). In a
binary classification problem, the performance of the
classifiers is assessed using the standard measures of
recall, precision, F measure (Seliya et al., 2009). We
use the F2 measure in our study to emphasize the
importance of recall. The F2 measure combines
precision and recall, putting a double emphasis on
recall.
Obtained values of performance metrics showed
that Model M1 that uses ensemble approach for
classification can predict 79.50% of at-risk students,
Model M1&M2 where prediction is based on the
combination of classification and clustering can
predict 83.40% but Model M1&M2&M3 that
supplemented Model M1&M2 with a linear
regression can predict 95.60% of at-risk students. The
values of the F2 measure for Model M1 is 0.800, for
Model M1&M2 it is 0.824 and for Model
M1&M2&M3 it is 0.863. The output of the model
training and evaluation phase is trained Models M1,
M2, M3, the e-inclusion threshold and the PREDICT
model algorithm.
3.2.3 Prediction of At-risk Students
The third process of the e-inclusion prediction system
is the calculation of student's learning outcomes in the
context of usage of newly learned skills. In the
prediction process, as the input data are student data,
these have not been seen previously by training
models. The second input data are pre-trained models
that calculate the prediction for the student.
The output of the prediction process is the
determination of students at-risk to be digitally
excluded because they do not have the ability to use
the newly learned skills in their professional or
private life.
The prediction process includes the presentation
of result to the instructor, in order to take action to
decrease the risk factors. Results need to be presented
to end-users in an intuitive form, and that is one of the
challenges in the model implementation (Maskey,
2019).
CSEDU 2021 - 13th International Conference on Computer Supported Education
260
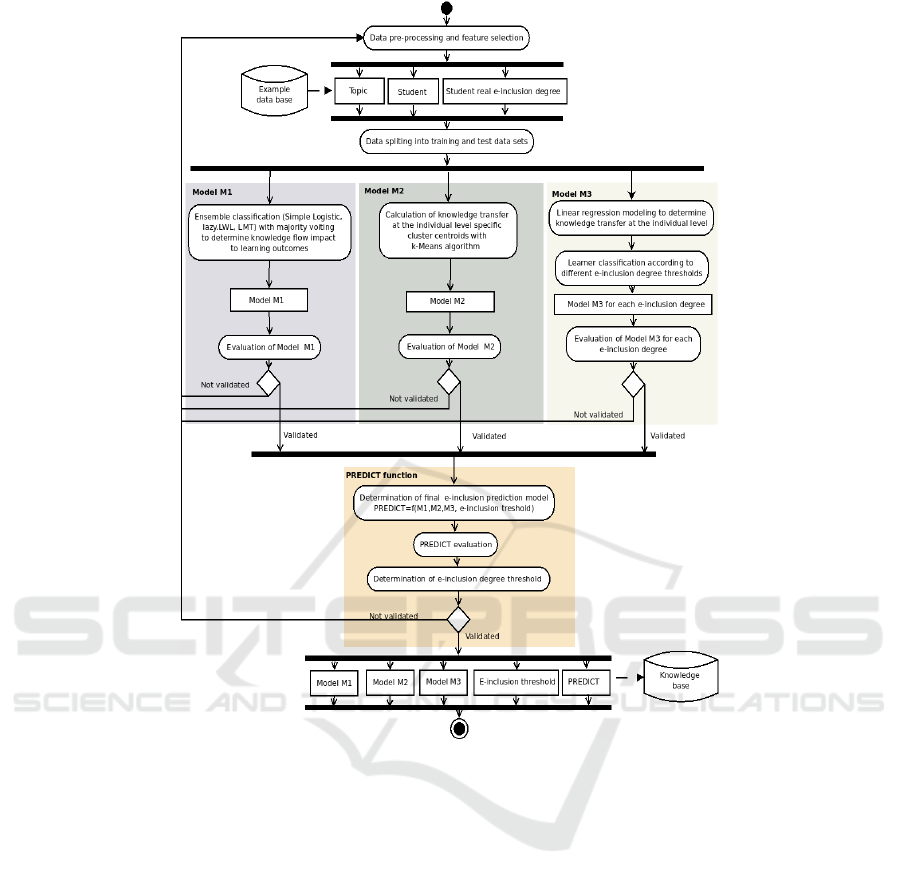
Figure 2: Algorithm for e-inclusion prediction based on training of three models and calculation of PREDICT function.
3.2.4 Monitoring of Prediction Performance
The last process of the e-inclusion prediction system
is system maintenance, especially quality monitoring.
There is no common understanding as to what are the
best key metrics for quality measurement of machine
learning models (Schelter et al., 2018). The
complexity of machine learning application
management is higher due to the fact that
performance of machine learning application depends
on training data but during the production stage data
can be changed. The quality and frequency of model
retraining are impacted by the model drift (Lu et al.,
2018). There are different approaches for adapting
models to new data, including scheduled regular
retraining, continual or online learning (Chen and
Liu, 2018).
We decided to evaluate model quality based on
models performance metrics such as the F2 measure,
recall and precision, and to determine frequency of
model retraining in line with receipt of new data. The
output of the model monitoring process is the
decision whether the model requires retraining.
4 PROTOTYPE OF THE
e-INCLUSION PREDICTION
SYSTEM
We have deployed the proposed model onto the
prototype of the e-inclusion prediction system. The
prototype is web-based software using the JAVA
programming language and open source software
WEKA libraries.
The prototype is an early version of the e-
inclusion system and consists of the base
functionality. The main task of the e-inclusion
prediction prototype is to provide functionalities that
inform instructors about at-risk students and evaluate
Modeling the e-Inclusion Prediction System
261
the performance of the basic functionality of the e-
inclusion prediction system.
The main functionality of the e-inclusion
prediction system for the instructor: to set an e-
inclusion degree threshold, to search for students, to
display prediction results for students (e-included or
not e-included); to display factors impacting the
prediction result (for example, student motivation,
student self-evaluation of learning materials or e-
learning environment; download prediction results.
For prototype validation, we used 65 student data
from the three blended learning courses: Video
Technology and Design course, Mobile Technologies
course, Robotics course. Teachers from vocational
and secondary schools attended these blended
learning courses.
4.1 Explanation, Visualization, and
Interpretation of Prediction Results
4.1.1 The View of the Main Prediction
Results
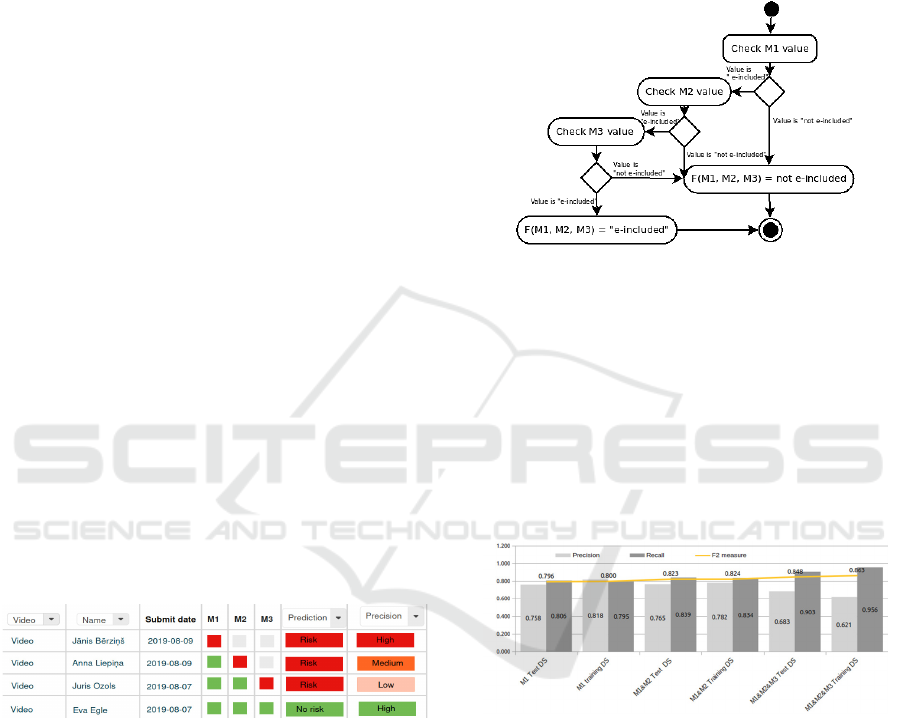
Figure 3 presents the view of the main prediction
results for the instructor in the tabular form in the
prototype. Each row of the table contains the
following information about the student: what models
(M1, M2, or M3) have been used for the prediction,
what is the predicted value for the student's e-
inclusion (at-risk or no risk) and what is the level of
precision for the prediction (high, medium, low). This
table presents four possible prediction and precision
level combinations.
Figure 3: Prototype view of different types of the results
predicting risk to be digitally excluded for learners and pre-
senting the level of precision for the prediction.
To make the information easier to perceive, we
chose to use red color tones as a warning of risk and
green color for no risk (Silic, & Cyr, 2016).
4.1.2 Calculation of the Final Prediction
To calculate the final prediction, the prototype uses
prediction results of Model M1, M2 or M3 based on
the algorithm presented in the Figure 4.
If Model M1 predicts that the student will not be
e-included, then the final result will be that the
student is at risk. If Model M1 predicts that a student
will be e-included, the next step is checking the
prediction of Model M2. If Model M2 predicts that
the student is not e-included, then the final result
again is that the student is at risk. Similarly, M3
model is checked. This approach is chosen because
we need to check as many students as possible who
are potentially at risk.
Figure 4: Process of determining the final prediction based
on predictions of models M1, M2, M3.
4.1.3 Interpretation of the Extent of the
Prototype Prediction Precision
To help the instructor to interpret prediction results,
we supplemented the prediction with an indicator of
the extent to which we consider the prediction to be
precise. Model performance measurements showed
that the precision is different for model combinations
in case of the not e-included class.
Figure 5: Comparison of models and their performance in
the training and testing phase.
Figure 5 shows how the precision decreases and
the recall increases for different model combinations
in case of a training data set. For model M1, the
precision is 0.818, for the combination of models
M1&M2 it is 0.782, for the combination of models
M1&M2&M3 the precision is lower - 0.621. We
checked that the trend of decreasing precision
remains with the test data also, the precision
decreased from 0.758 to 0.683. It means that among
the predicted students at-risk, there will be more who
are actually e-included. So we decided to add a
Precision column to the prediction table in the
prototype. Based on the observed precision values,
CSEDU 2021 - 13th International Conference on Computer Supported Education
262
we divided it in three levels for not e-included or at-
risk class: (1) high level - if the model makes a
decision based on Model M1; medium level - if the
model predicts based on the combination of models
M1&M2; and low level - if the prediction is based on
a
combination of Models M1&M2&M3. We found
that 80% in the test phase or 85% in the training phase
not e-included students are predicted with Model M1.
In case of the e-included class, we determine that
prediction precision is based on our calculations of
correctly predicted e-included learners. We obtained
that 92.63% of e-included learners are correctly
predicted in case of the training data set and 87.50%
in case of the test data set.
4.1.4 Detailed View of the Prediction Results
To ensure that the instructor has the possibility to
understand more deeply the reasons that impact
student learning outcomes the prototype has a detail
view of prediction results in tabular form (Figure 6)
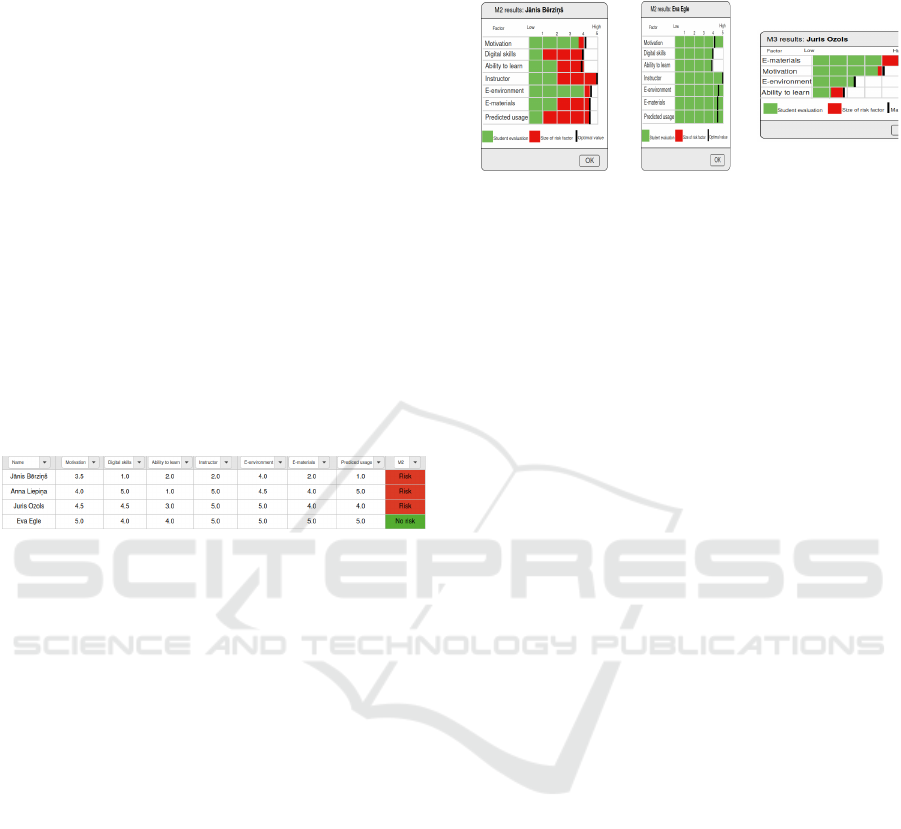
or as a visual presentation (Figure 7).
Figure 6: The view of student data and corresponding pre-
diction results in tabular form in the prototype for Model
M2.
To determine which features are most important
to a particular student, the prototype offers to the
instructor a visual view of the student's feature based
on algorithms obtained during the training phase.
Risk factors of the student are colored in red.
Figure 7 (a) and (b) present visualization of the
results obtained from Model M2 that used clustering
for predictions. To interpret prediction results of M2,
we used values of the centroids calculated in the
model training process, subdivided into two classes:
“e-included” and “not e-included”.
Figure 7(a) presents visualization of student's data
which has prediction of the risk to be digitally
excluded with high level reliability. Based on
warnings about the student's weaknesses, the
instructor can decide what actions to take.
Information in this prototype view is visualized as
follows: green bars show the extent to which a student
has one of the specific features, while red shows how
much it lacks to reach the feature. The factor having
a longer red bar affects the student more and these are
the main risk factors. The centroid values which are
determined by the k-Mean algorithm are represented
by a black vertical bar. They mark the boundary that
a student feature should reach in order to avoid the
risk of being digitally excluded.
(a) (b) (c)
Figure 7: Detailed view of the Model M2 and M3 results
for an individual learner. (a) Model M2 prediction of the at-
risk student; (b) Model M2 prediction of the e-included stu-
dent; (c) Model M3 prediction of the at-risk student.
Figure 7(b) demonstrates the features of a student,
who is predicted as e-included by the prototype. The
instructor can see that all the features are green and
have high values.
Model M3 is based on a linear regression, so the
prototype visualizes the results of M3 according to
the trained linear regression algorithm
.
During the training and cross-validation process
we obtained that the linear regression model uses only
four attributes to predict the e-inclusion degree:
Student motivation, student ability to learn,
evaluation of e-learning materials, and e-learning
environment. Linear correlation coefficients indicate
that student features have different effects on
prediction. The prototype visualizes and informs the
instructor according to the coefficients determined by
the algorithm on the effect on the prediction. For
example, Figure 7(c) presents the size of risk factors
according to the linear regression algorithm where the
instructor can see that e-materials and ability to learn
could be risk factors of the student.
4.1.5 The e-Inclusion Degree Threshold
We were challenged to determine at which predicted
linear regression value to consider a student e-
included and when the student is at risk.
To determine the e-inclusion degree threshold we
calculated precision, recall, and F2 measure for
different levels of e-inclusion degree. We observed
that metrics have constant values if the e-inclusion
degree is less than 60% from the maximum value in
the case of training data and less than 65% for test
data (Figure 8). F2 measure has the highest value
when the e-inclusion degree is reached by 80% for
both training data and test data. Based on this F2
measure value, we determined that a student can be
Modeling the e-Inclusion Prediction System
263
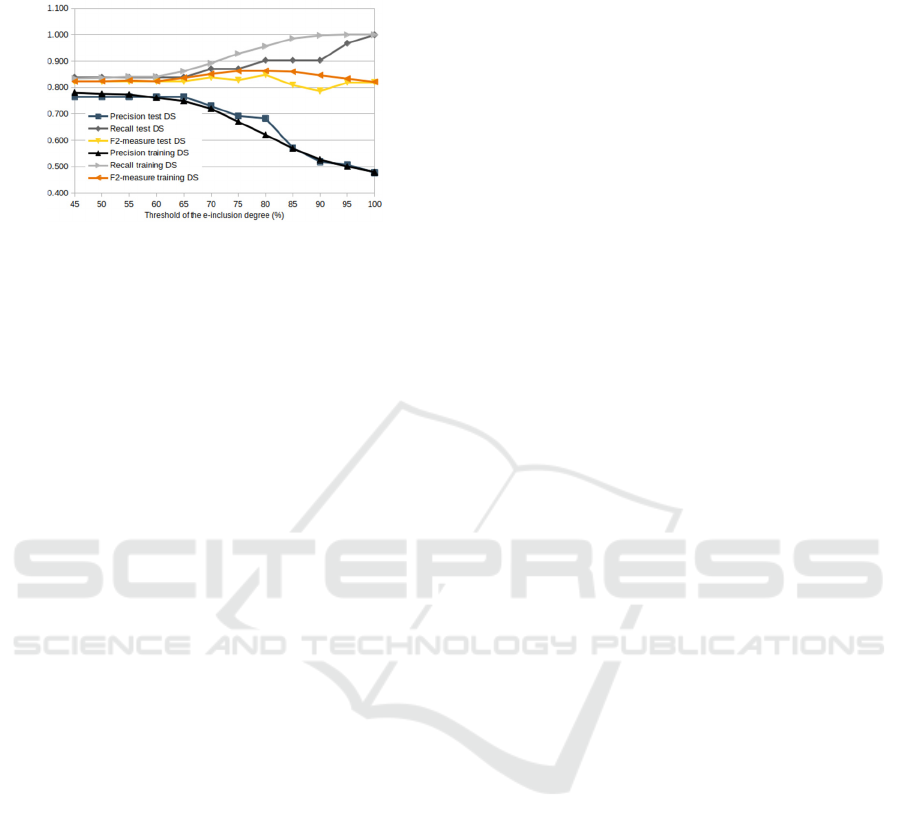
considered e-included if he/she reaches at least 80%
of the potential e-inclusion value.
Figure 8: Metrics according to e-inclusion degree.
4.2 Evaluation of the Model Drift
To evaluate the prediction model drift, we compared
performance metrics for training and test data sets.
The F2 measure was higher for the training data
set but the difference was small. In the case of Model
M1, the F2 measure of the training set is 0.798, but in
the case of the test set it is 0.800. For the combination
of M1&M2, the F2 measure of the training set is
0.823, for the test it is 0.824. For M1&M2&M3 the
F2 measure of the training set is 0.863, for the test set
it is 0.848. Model M1 in the prototype can predict
80.6 % of students at risk. It is possible to predict
83.9% of risk students in case of the M1&M2
combination model. Model M1&M2&M3 in the
prototype can predict 90.3% of the student at risk.
As the differences in metrics are small, we
assumed that the model has retained its accuracy.
However, it should be noted that model quality
monitoring is important and must be ensured on an
ongoing basis.
5 CONCLUSIONS
The conceptual architecture of the e-inclusion
prediction system was presented. The e-inclusion
prediction model was developed by combining a
classifiers (Simple Logistic, lazy.LWL, LMT), K-
means clustering, and multiple linear regression
algorithms. A data set of 65 learners records was used
for testing and validating the e-inclusion prediction
prototype. In a test condition the e-inclusion
prediction recall, precision, F2 measure were found
to be high. The recall value is above 0.806. It means
that prototype can predict more than 80.60% at risk
students from all digitally excluded students. The
precision value is above 0.683, and the F2 measure is
above 0.796. Comparing the model performance in
the training phase and prototype testing phase the
performance quality is stable. It is argued that the
proposed e-inclusion prediction system could
increase the number of e-included persons after they
complete the digital skill improvement blended
learning courses.
We concluded that it is possible to use the
proposed prediction model for different digital skills
improvement courses. It is possible to merge data
from several courses or vice versa to predict for each
course separately.
The prototype provides the main functionality for
predicting digitally excluded students. Functionality
includes data uploading, model training, and outcome
predictions as well as result presentation.
A limitation in using the e-inclusion system is that
the student should fill out questionnaires in the
Moodle courses. In case the student has not submitted
or has partly submitted the answers the system will
miss data for predictions. Another limitation is the
issue with the technical equipment. If the student does
not have available software or any device for skill
usage in the future then the instructor cannot impact
the usage of the newly learned skills.
The plan for the future is to supplement the
functionality of the prototype and to test it in
production in cooperation with instructors of the
blended learning courses.
ACKNOWLEDGMENTS
This work is supported by the EU ERANET FLAG
ERA project ’FuturICT 2.0 - Large scale experiments
and simulations for the second generation of
FuturICT’.
REFERENCES
CEB Global, 2014 Confronting Scrap Learning.
Chen, Z., & Liu, B., 2018. Lifelong machine learning. Syn-
thesis Lectures on Artificial Intelligence and Machine
Learning, 12(3), 1-207.
García, S., Luengo, J., & Herrera, F., 2015. Data prepro-
cessing in data mining (pp. 195-243). Cham, Switzer-
land: Springer International Publishing.
European Commission, 2020. Digital Education Action
Plan 2021-2027
Eurostat, 2020. People expanding their knowledge by
learning online.
Hall, M. et al., 2009. The WEKA data mining software: an
update. In ACM SIGKDD explorations newsletter, Vol.
11, No. 1, pp.10-18.
CSEDU 2021 - 13th International Conference on Computer Supported Education
264

Kapenieks, A., Žuga, B., Vītoliņa, I., Kapenieks, K. ... &,
Balode, A. 2014. Piloting the eBig3: A Triple-screen e-
Learning App. Proc. of the 6th International Conference
on Computer Supported Education. pp. 325.-329.
Kuhn, M., & Johnson, K., 2013. Applied predictive model-
ing (Vol. 26). New York: Springer.
Lu, J., Liu, A., Dong, F., Gu, F., Gama, J., & Zhang, G.,
2018. Learning under concept drift: A review. IEEE
Transactions on Knowledge and Data Engineering,
31(12), 2346-2363.
Maskey, M. et al., 2019. Machine Learning Lifecycle for
Earth Science Application: A Practical Insight into Pro-
duction Deployment, IGARSS 2019 - 2019 IEEE Inter-
national Geoscience and Remote Sensing Symposium,
Yokohama, Japan, pp. 10043-10046
Miteva, D., & Stefanova, E., 2020. Design of Learning An-
alytics Tool: The Experts' Eyes View. In CSEDU (2)
(pp. 307-314).
Moodle, 2020, https://stats.moodle.org/
Nafukho, F. M., Alfred, M., Chakraborty, M., Johnson, M.,
& Cherrstrom, C. A., 2017. Predicting workplace trans-
fer of learning. European Journal of training and De-
velopment,
Nissen, M.,E., 2006. Harnessing knowledge dynamics:
Principled organizational knowing & learning. p. 278.
Pachler, N.; Cuthell, J. P.; Preston, C.; Allen, A; Pin-
heiro−Torres, C. (2010) ICT CPD Landscape Review:
Final report. Becta ICT CPD RR.
Paleyes, A., Urma, R. G., & Lawrence, N. D., 2020. Chal-
lenges in Deploying Machine Learning: a Survey of
Case Studies. arXiv preprint arXiv:2011.09926.
Seliya, N. et al., 2009. A study on the relationships of clas-
sifier performance metrics. In 21st IEEE International
Conference on Tools with Artificial Intelligence. New-
ark, NJ, pp. 59-66.
Schelter, S., Biessmann, F., Januschowski, T., Salinas, D.,
Seufert, S., & Szarvas, G., 2018. On challenges in ma-
chine learning model management.
Silic, M., & Cyr, D., 2016. Colour arousal effect on users’
decision-making processes in the warning message
context. In International Conference on HCI in Busi-
ness, Government, and Organizations (pp. 99-109).
Springer, Cham.
Testers, L., Gegenfurtner, A., & Brand-Gruwel, S., 2020.
Taking Affective Learning in Digital Education One
Step Further: Trainees’ Affective Characteristics Pre-
dicting Multicontextual Pre-training Transfer Intention.
Frontiers in Psychology, 11.
Viberg, O., Hatakka, M., Bälter, O., & Mavroudi, A., 2018.
The current landscape of learning analytics in higher
education. Computers in Human Behavior, 89, 98-110.
Vitolina, I., & Kapenieks, 2013. A. E-inclusion measure-
ment by e-learning course delivery. In: Procedia Com-
puter Science, 26, (pp. 101-112).
Vitolina, I., & Kapenieks, 2014 A. User analysis for e-in-
clusion in a blended learning course delivery context.
In Proceeding of the International Scientifical Confer-
ence May 23th–24th (Vol. 2).
Vitolina, I., Kapenieks A. (2020). E-inclusion Prediction
Modelling in Blended Learning Courses (accepted pa-
per), 23rd International Conference on Interactive Col-
laborative Learning.
Vitolina, I., Kapenieks A. (2020a). Comparision of E-inclu-
sion Prediction Models in Blended Learning Courses
(accepted paper), 19th International Conference e-Soci-
ety.
Yadav, S., & Shukla, S., 2016. Analysis of k-fold cross-val-
idation over hold-out validation on colossal datasets for
quality classification. In 2016 IEEE 6th International
conference on advanced computing (IACC) (pp. 78-83).
IEEE.
Modeling the e-Inclusion Prediction System
265
