
Quality Assessment of Learners’ Programs by Grouping Source
Code Metrics
Francisco Alan de O. Santos
1,4 a
, Alana Oliveira
2,4 b
, Carlos S. Soares Neto
3 c
and Mario Meireles Teixeira
3 d
1
Advanced Center of Informatics and Educational Research, Federal Institute of Maranh
˜
ao (NAIPE/IFMA), Brazil
2
Computer Engineering, Federal University of Maranh
˜
ao (UFMA), Brazil
3
Departament of Informatics, Federal University of Maranh
˜
ao (UFMA), Brazil
4
PhD Program in Computer Science, DCCMAPI/UFMA, Brazil
Keywords:
Computer Education, Programming, Cluster Analysis, Error Detection, Software Metrics.
Abstract:
This article reports on the process of clustering source code metrics from beginner students in an Algorithms
course in order to identify their learning profiles. Our approach relies on extracting a set of metadata from Lua
programming assignments written by 60 Computer Science undergraduate students, comprising 21 practical
exercises. A total of 13 metrics have been selected and submited to clustering algorithms and it was found that
hierarchical grouping, K-means and DIANA proved to be more suitable to the set under study. Preliminary
results on the relationship between student groups and source code quality are reported. Further research is
required towards an automated student performance evaluation strategy to assist in student assessment based
on source code quality.
1 INTRODUCTION
Currently there exist a vast variety of assessment
methods and tools for assessing programming learn-
ing. Several studies have applied automatic or semi-
automatic assessment to practical programming test
to qualitatively evaluate programming skills (Santos
and Fonseca, 2019). Although, identifying student
profiles still represents a challenge.
Thus, learning profile detection based on informa-
tion from students’ source codes is an open question
and lacks mitigating alternatives, so that proposals
to deal efficiently with different student profiles are
still pending, thus constituting an opportunity of re-
search. To address this gap, this work aims to support
an initiative to evaluate the performance of learners
in Algorithms, focused on clustering students through
the quality analysis of the solutions in order to guide
teaching strategies.
As a proof of concept, we describe the use of
source code metrics as an input for clustering algo-
a
https://orcid.org/0000-0002-8457-3345
b
https://orcid.org/0000-0001-7870-3943
c
https://orcid.org/0000-0002-6800-1881
d
https://orcid.org/0000-0001-8771-1478
rithms, in order to develop models capable of group-
ing novice students to identify learning profiles. With
this preliminary approach, it is intended to discover
the relationship between the attributes collected and
the students’ proficiency in the programming lan-
guage used. This can be used to categorize students
according to their degree of expertise as a program-
mer in order to make it possible to infer the levels of
knowledge of each group.
The remainder of this article is divided as follows:
Section 2 describes related work. Section 3 details
the theoretical foundations. Section 4 presents the
methodology. Section 5 displays the results. Section
6 discusses preliminary conclusions and finally, Sec-
tion 7 presents limitations and future work.
2 RELATED WORK
Ribeiro et al. (2018) employed Self-Organizing Maps
to asses the impact of the use of Dr. Scratch
1
tool in
Computational Thinking skills. They found a weak
linear relationship between Dr. Scratch’s rubric and
1
http://www.drscratch.org/
Santos, F., Oliveira, A., Neto, C. and Teixeira, M.
Quality Assessment of Learners’ Programs by Grouping Source Code Metrics.
DOI: 10.5220/0010457003390346
In Proceedings of the 13th International Conference on Computer Supported Education (CSEDU 2021) - Volume 1, pages 339-346
ISBN: 978-989-758-502-9
Copyright
c
2021 by SCITEPRESS – Science and Technology Publications, Lda. All rights reserved
339

cyclomatic complexity, indicating that the influence
is true.
Santos and Fonseca (2019), captured source code
metrics to find patterns for composing programming
learning profiles. They concluded that was possible
to assist the evaluation work of examiners to help un-
derstanding students’ difficulties.
Oliveira et al. (2017) mapped student profiles in
348 different software metrics for analysis of pro-
gramming learning. The approach allowed to rec-
ognize learning difficulties, good programming prac-
tices and learning profiles in a quick, detailed and
holistic way.
Unlike Ribeiro et al. (2018), which focuses on the
development of Computational Thinking skills, San-
tos and Fonseca (2019) and Oliveira et al. (2017),
which addresses automatic correction, the focus of
our approach is on exploring ways of grouping data
about quality of the apprentices’ source codes, such as
error types, coding style, indentation patterns, among
others, as a complementary mechanism to other eval-
uation strategies.
3 THEORETICAL FOUNDATION
The following is a brief discussion of the topics re-
lated to the domain of this research.
3.1 Programming Learning Assessment
Assessing programming learning is complex from
data collection to the analysis of the results (Raposo
et al., 2019). This complexity is due to the fact that
learn to program is a modular and interdependent pro-
cess, in which the progress in each stage is a key for
success in the following (Raposo et al., 2019). There-
fore, it is important to monitor the evolution of stu-
dents performance in each activity developed.
In introductory classes, a limiting factor to an effi-
cient assesssment is the inability to identify individual
difficulties of each student because beginner classes,
in general, are numerous, making it difficult to indi-
vidually assist students (Santos and Fonseca, 2019).
Additionally, there are several possibilities regard-
ing the difficulties in programming learning, which
may be lexical, syntactic or semantic (Jesus et al.,
2018). With all this diversity, it is impracticable for
the teacher to provide individual feedback.
Online judge systems are commonly adopted to
support practical learning of Computer Programming.
Such platforms provide repositories of problems to
which students must submit solutions in the form of
source code (Zaffalon Ferreira et al., 2019). However,
in spite of enabling automatic and prompt evaluation
and response (Oliveira et al., 2019), most systems are
limited to informing whether or not the user was able
to achieve the expected outputs, without analyzing the
logical structure of the developed solution.
Thus, presenting qualitative information about the
source codes produced by students constitutes an op-
portunity of research in the area of Educational Data
Mining (EDM), because with the historical record
of all the programs developed by students during
their attempts to solve the proposed exercises, a huge
database can be generated, whose exploration has the
potential to reveal discoveries about learning (Santos
and Fonseca, 2019).
3.2 Source Code Analysis
Programming solutions can be evaluated automati-
cally or semi-automatically using three types of ap-
proaches: static, dynamic, or static-dynamic method
(Ala-Mutka, 2005).
Static analysis is based on the evaluation of source
code without executing it. Unlike dynamic analysis,
in which the source code is executed and its return-
ings are compared to the expected outputs for the in-
puts provided, static analysis consists on examining
items in the written code such as syntactic, semantic,
structural programming errors and even programming
style (Oliveira et al., 2017). The static-dynamic anal-
ysis, in turn, is characterized by the combination of
the two previous approaches.
With the static method, it is possible to analyze
effort, complexity, efficiency and quality of program-
ming. This is why we used static analysis to extract
source code metrics in order to compose practical pro-
gramming learning profiles.
3.3 Source Code Quality Metrics
ISO/IEC 25021 (2012) is part of ISO/IEC 25000
(2014), also known as SQuaRE (Software product
Quality Requirements and Evaluation) and presents a
guide for quality measurement of software products.
According to this standard, software metrics are qual-
ity indicators that can be assessed in the point of view
of users and managers or at a lower level, which is
part of the vision of developers, engineers and archi-
tects. The former is also known as external quality,
as it is related to the perception of value from the per-
spective of use and includes aspects such as usability
and reliability. The latter is known as internal quality.
Also according to ISO/IEC 25021 (2012), source
code metrics are a subcategory of software metrics
and are measures obtained by analyzing the source
CSEDU 2021 - 13th International Conference on Computer Supported Education
340
code to verify the internal quality of software prod-
ucts. Indicators of code quality include, for example,
duplication, complexity and size of code, among oth-
ers. There is a huge variety of source code metrics,
the types used in this work are briefly presented in
Subsection 4.6.
3.4 Clustering
Data clustering is an unsupervised learning technique,
that is, when there is no class associated a priori with
each example, used to find unexpected patterns in
the data (Xu and Tian, 2015). There are several ap-
proaches to clustering, such as methods based on par-
titioning, density, grid, model-based, fuzzy, in addi-
tion to hierarchical methods. In this work, only clus-
tering by hierarchy, fuzzy and model-based was con-
sidered.
3.4.1 Partitioning
Partitioning algorithms use the notion of center to
group the data according to the average distance in
relation to a group of points. For each group, the cen-
tral point is calculated and then each observation is
associated with the nearest center. The idea is that
the variation within each group is as small as possible
(Xu and Tian, 2015).
3.4.2 Fuzzy Methods
Also known as non-exclusive, fuzzy methods are data
grouping techniques where each pattern belongs to a
grouping with a certain degree of relevance, thus al-
lowing some ambiguity between the data for a more
detailed analysis of the distribution. A well-known al-
gorithm in this category is Fuzzy Analysis (FANNY).
3.4.3 Hierarchical
Hierarchical methods use a distance matrix as an in-
put and the objects are categorized in a hierarchy sim-
ilar to a tree-shaped diagram, in which the objects are
the leaves and the internal nodes reveal the similarity
structure of the points. This tree is called “dendro-
gram” (Xu and Tian, 2015). The choice of an appro-
priate metric will influence the shape of the groups, as
some elements may be close to each other according
to a distance and distant according to the other. They
are subdivided into divisive and agglomerative.
3.4.4 Model based
Model-based approaches assume a variety of data
models and apply maximum likelihood estimates and
criteria to identify the most likely model and num-
ber of groups. Basically, a specific model is selected
for each group and found the best fit for that model.
There are basically two types of model-based cluster-
ing algorithms, one based on the statistical learning
method and the other based on neural network learn-
ing. Of these, one of the typical algorithms is called
Self-Organizing Maps (SOM) which is an intercon-
nected and unsupervised Artificial Neural Networks
(ANN) architecture that solves tasks of data grouping
based on the principle of mapping brain units (neu-
rons) (Kohonen, 2013).
4 METHODOLOGY
To achieve the purpose of our research, an experiment
was conducted to analyze a set of programs developed
by students in response to practical programming as-
signments, in which source codes written in Lua were
submitted to a Learning Management System (LMS),
and then evaluated by a static program analysis tool
to generate the data sets to be analyzed.
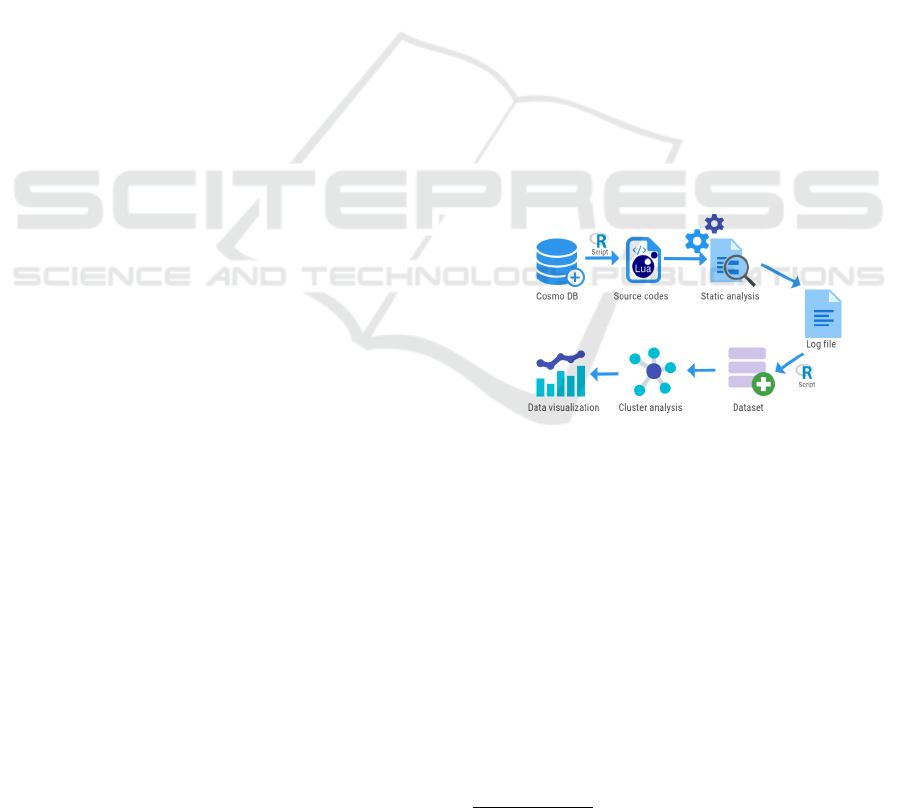
The overview of the entire process is illustrated in
Figure 1. The steps of this initiative are discussed in
the following subsections.
Figure 1: Methodological procedures.
4.1 Data Source
The data was collected from the Cosmo (Rab
ˆ
elo
J
´
unior et al., 2018) database, an LMS created specifi-
cally for teaching algorithms. Cosmo offers several
practical programming assignments, in which stu-
dents are challenged to submit solutions in source
code format to meet the input/output requirements of
the proposed problems. Submission records, as well
as activity data, are stored in a MongoDB database
2
.
The analyzed source codes correspond to attempts
to solve 21 practical programming challenges. The
answers were obtained from an Introduction to Al-
gorithms course offered to 1st semester students of a
2
https://www.mongodb.com/
Quality Assessment of Learners’ Programs by Grouping Source Code Metrics
341
Computer Science program, the classes analyzed have
a total of 60 students enrolled.
From a dump of Cosmo’s database, a set of files
was generated with the students’ source codes. As the
objective of the experiment was to find profiles for the
students, the incorrect solutions, that is, the programs
that did not produce the expected outputs, were also
considered in the analysis, as well as the codes with
compilation errors.
4.2 Languages and Tools
Software Luacheck
3
was used to extract metadata
from the source codes. Luachek is a static analyzer
that detects known programming faults in Lua. The
tool generates alerts about errors such as undefined,
unused and uninitialized variables, inaccessible code,
empty blocks, among others. Specific project config-
urations can be defined via command line options and
file output is suported. Due to its features, the tool
was considered adequate for the purpose of this work.
Data extraction and analysis, in turn, were carried
out using the R programming language, chosen for
being a free-to-use language with built-in functional-
ities ready for statistics. Therefore, R already has all
the necessary functions to perform statistical compar-
isons between algorithms. Another important reason
was the fact that the language is maintained by a very
active community. As of this writing, there were over
16,000 packages in its public repository (CRAN
4
).
4.3 Data Extraction
Initially, a script in R was created to convert the con-
tent of the responses, stored as text in the MongoDB
structure, to various local .lua files, totaling 4,385
items. Then, the Luacheck verification was called,
pointing to the local directory where the source files
were stored. For each error found during the static
analysis, the respective incidences were recorded in
a log, whose output generated a .txt file with 39,545
lines, corresponding to the total of errors found.
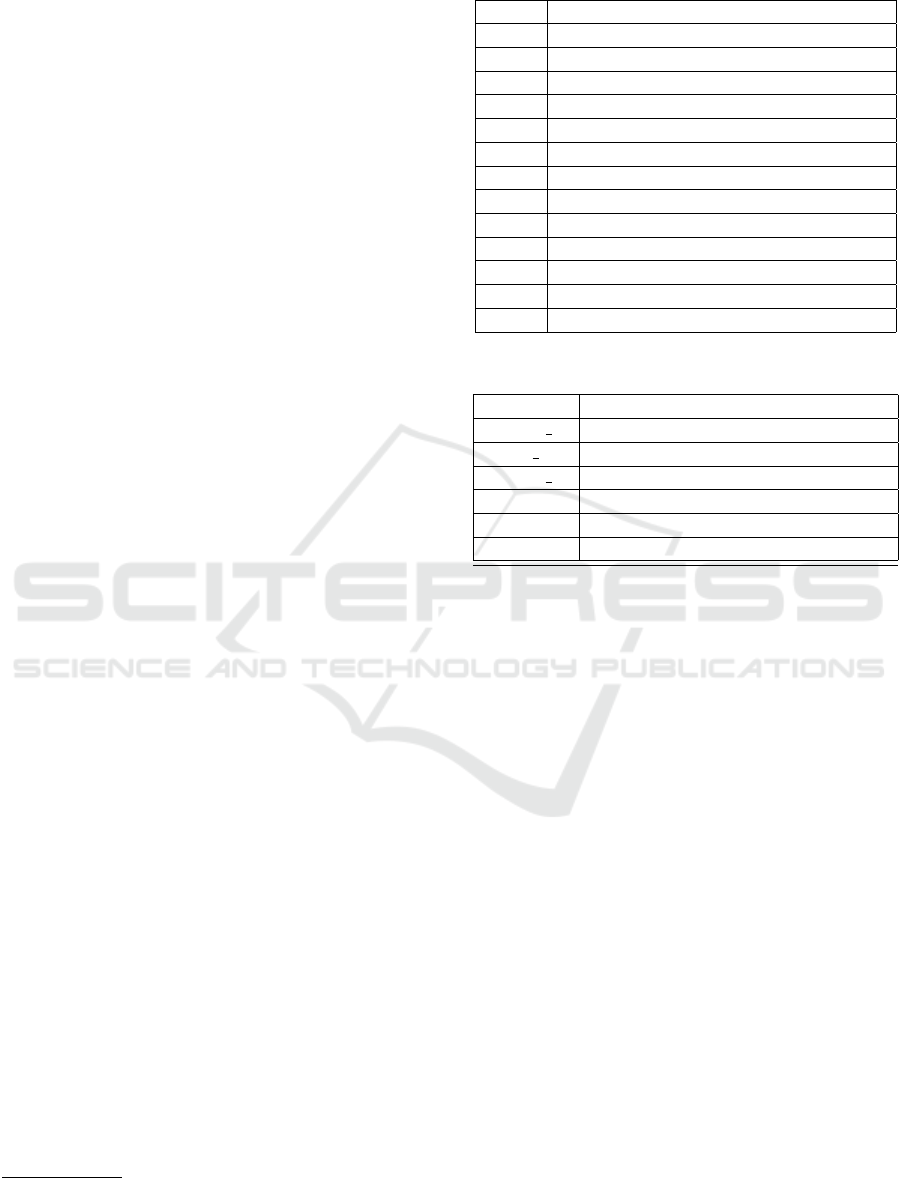
The alerts produced by Luacheck are categorized
into three-digit codes (Melnichenko, 2018). From
the fifty-two possibilities of errors verifiable by Lu-
acheck, twelve were detected. Table 1 presents a brief
description of each one.
Another R script was used to compose the dataset
of this experiment, referring to attempts to answer the
exercises. The steps were: read the log, gather the
necessary data and format it in a single .csv file, re-
sulting in tuples with the attributes listed in Table 2.
3
https://github.com/mpeterv/luacheck
4
https://cran.r-project.org/
Table 1: Errors detected in static analysis.
Code Description
E011 A syntax error.
W111 Setting an undefined global variable.
W112 Mutating an undefined global variable.
W113 Accessing an undefined global variable.
W121 Setting a read-only global variable.
W143 Undefined field of a global variable.
W531 Too short left-hand side of assignment.
W542 An empty ’if’ branch.
W561 High cyclomatic complexity of function.
W611 Line consists of nothing but whitespace.
W612 Line contains trailing whitespace.
W614 Trailing whitespace in a comment.
W631 Line is too long.
Table 2: Data structure after static analysis.
Feature Description
attempt id Attempt identifier
user id Student identifier
activity id Activity identifier
position Error position, in line:column format
ecode Error code reported by Luacheck
message Error description message
The data set was built in a way that each type of er-
ror is equivalent to an input variable or feature, whose
value corresponds to the sum of errors of the respec-
tive type in each attempt by a student. After this pro-
cedure, the structure of the dataset was as shown in
Table 3. The variables were named with the prefixes
”E” (error) or ”W” (warning), followed by the respec-
tive code reported by Luacheck.
4.4 Pre-processing
The output file from static analysis was submitted to
treatment routines, in order to prepare data for clus-
tering. In the data transformation process, adjust-
ments were needed to increase the potential for find-
ing patterns in the data. For example, as the values of
the attributes were in very different scales (for exam-
ple, W111: 12.586 and W121: 19) and because this
discrepancy makes it difficult to learn distance-based
algorithms, the data was scaled using the procedure
standardization.
4.5 Feature Selection
The process of selecting attributes consists of gener-
ating a subset of characteristics that are more relevant
to the intended analysis because they have a certain
CSEDU 2021 - 13th International Conference on Computer Supported Education
342
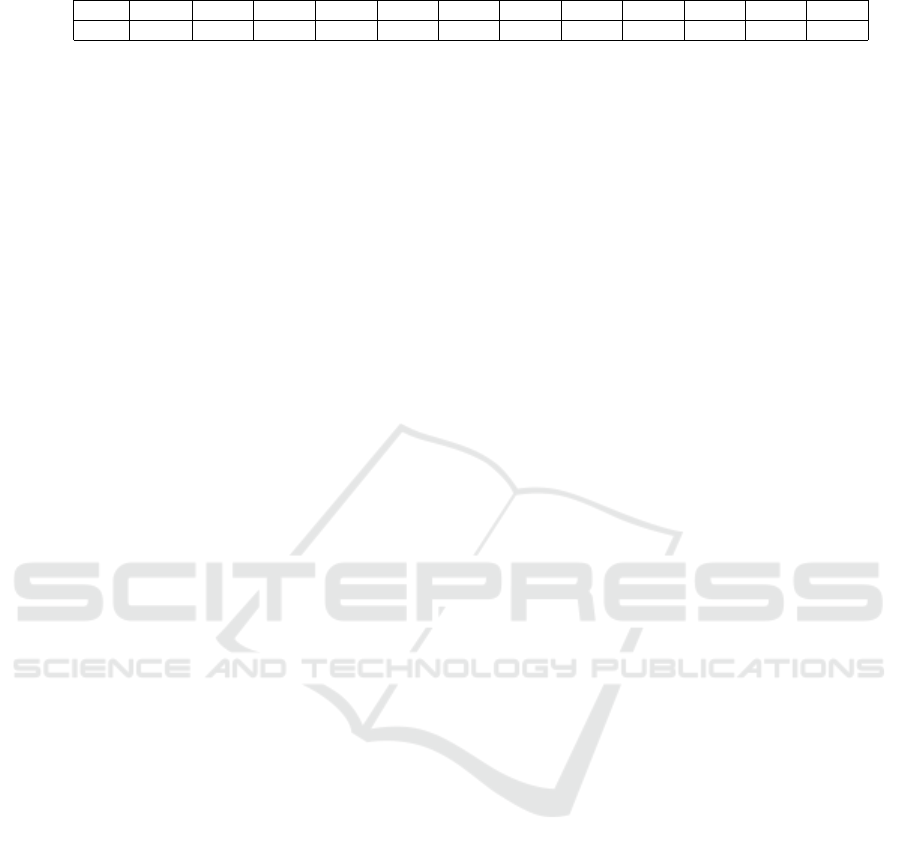
Table 3: Number of error occurrences by type after treatment.
E011 W111 W112 W113 W121 W143 W531 W542 W561 W611 W612 W614 W631
1047 12586 3 24429 19 3 18 37 631 201 568 1 2
influence on the final result. In that case, the error
messages were removed, because, as they are categor-
ical variables, they did not demonstrate relevance for
this type of analysis, since they would not contribute
to the grouping algorithms, thus being eligible to be
discarded.
4.6 Feature Groups
The aspects of code considered in this research were
gathered to encompass requirements that represented
good programming practices regarding the following
perspectives or interest groups.
4.6.1 Syntax
This category is related to the student’s ability to cor-
rectly use language resources, one of the important
questions about the quality of a programmer’s code.
This group includes metrics with the prefixes E0xx
and W1xx.
4.6.2 Size and Complexity
These are related to the ability to write succinct code
(Oliveira et al., 2017) and attest to the conciseness of
the solution. It includes metrics with prefix W5xx.
Among these, an important complexity measure is
the metric developed by McCabe (1976) to calcu-
late the cyclomatic complexity (W561) of a program.
This measure uses the program’s control flow graph
to calculate the number of linearly independent paths
through the source code.
4.6.3 Readability
This perspective concerns with the understandability
of the code and is generally associated with the use
of blanks, tabs and consistent indentation. For exam-
ple, the use of white space at the end of lines of code
and comments or between them is considered useless,
and it can also make it difficult for other developers
to navigate through the code. Therefore, this is not
recommended practice in many coding style guide-
lines. Very long lines of code also impair readabil-
ity, for this reason we defined the standard limit of
120 characters for the length of lines of code (W631),
the default value defined in Luacheck, therefore, lines
longer than that were reported as a violation.
4.7 Clustering Algorithms
Different clustering algorithms were applied and their
results were compared. The algorithms are explained
below.
For partition grouping, we first employed K-
means, a method that divides the dataset into a K
number of groups, defined by the user. For each K,
the central point (centroid) is calculated. Another
partition method adopted was Partitioning Around
Medoids (PAM), a robust version of K-means based
on medoids, less susceptible to outliers. We also ap-
plyed Clustering Large Applications (CLARA), an
extension of the PAM method for large data sets with
a focus on reducing computing time in the case of a
large data set.
For hierarchical grouping, we first calculate a dis-
tance matrix based on Euclidean measure. We then
used that distance as an input to the algorithm. Varia-
tions of the grouping by hierarchy were also applied,
with the algorithms AGNES (AGglomerative NESt-
ing) and DIANA (DIvisive ANAlysis Clustering).
For model-based method, we created and visual-
ized SOMs to map the data set to a three-by-one map,
hexagonally oriented, with linear decay and default
values starting at 0.05 and stopping at 0.01.
We then applyed Fuzzy Analysis (FANNY), a
fuzzy data grouping technique that gives each pattern
a degree of relevance to the groupings involved, thus
generating estimates for the k groupings. The algo-
rithm runs iteratively and stops when the objective
function converges.
Lastly, we used Self Organizing Tree Algorithm
(SOTA), a method that combines the hierarchical
structure of the grouping tree with that of the neu-
ral network. Like SOM, SOTA is a non-deterministic
algorithm, which includes the advantages of the first,
adding also the hierarchical grouping.
4.8 Cluster Validation
To estimate the ideal number of groups, relative vali-
dation was used. This technique evaluates the group-
ing structure by varying different parameter values for
the same algorithm.
To determine the appropriate grouping approach,
the algorithms were compared using internal valida-
tion measures, which includes connectivity, Silhou-
ette coefficient and Dunn index (Xu and Tian, 2015).
Quality Assessment of Learners’ Programs by Grouping Source Code Metrics
343
Connectivity is the extent to which items are
placed in the same group as their closest neighbors
in the data space. Its value ranges from 0 to infinity
and should be minimized.
Silhouette coefficient estimates the average dis-
tance between clusters, measuring how close each
point in a group is to points in neighboring groups, to
determine how well an observation is grouped. Ob-
servations with a Silhouette coefficient close to 1 are
considered to be very well grouped and those with a
negative coefficient are probably in the wrong group.
A coefficient around 0 means that the observation is
between two groups.
The Dunn index is the relationship between the
shortest distance between pairs of different groups
(which are not in the same cluster) and the longest dis-
tance between elements of the same group. In other
words, it is the division of the minimum inter-cluster
distance by the maximum intra-cluster distance. If the
data set contains compact and well-separated groups,
it is expected that the diameter of the groups is small
and that the distance between them is large. Thus, the
Dunn index should be maximized.
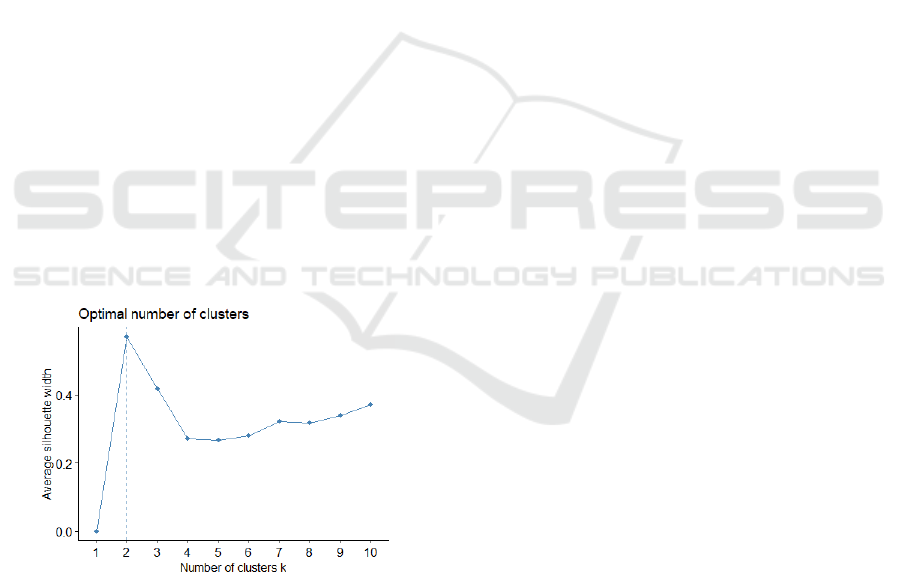
5 RESULTS
Figure 2 shows the curve resulting from the analy-
sis of relative validation to obtain the ideal number of
groups for the data, whose value found was two.
Figure 2: Determining the number of groups.
According to Figures 3, 4 and 5, the algorithms that
presented, respectively, lower Connectivity, higher
Dunn index and Silhouette coefficient closer to 1 were
hierarchical, K-means and DIANA. Therefore, these
were the algorithms that better separate students. The
results of the hierarchical grouping and k-means were
considered for comparison purposes.
In the results of the hierarchical training, shown in
Figure 6, it is possible to observe the grouping of the
characteristics of the source codes and the clustering
of the observed levels, identified through the hierar-
chy of groups. The split or merge distance (called
height) is shown on the y-axis of the dendrogram in
Figure 6. The delimitation in red highlights the two
groups found, where, according to the height, the first
(from the left) is more homogeneous and identifies
students with less errors. The second group (on the
right), is more dispersed and contains students whose
static analysis revealed major problems.
Training with the K-means algorithm resulted in
the groups expressed in Figure 7, in which it is pos-
sible to verify the separation between groups 1 and
2. The proximity of the data points in group 1 is
visibly greater compared to the points in group two,
which have a much more variable distance between
their elements, in addition, it is also possible to vi-
sualize the existence of a probable anomaly (outlier),
as there is, at the bottom of the graph, an observation
that presents a great departure from the others, which
can represent an inconsistency in the data.
Finally, Figure 8 presents a view of the hierar-
chical grouping, with the values of the source code
metrics found in each cluster, summarized by interest
group.
6 DISCUSSION
Figure 8 indicates the existence of a dichotomy in the
data, as there is a clear separation between the two
groups found. While group B had a lower incidence
of problems related to the internal quality of their
codes, students in group A, although they were able to
perform the tasks requested, also presented evidence
of ineffective learning in the formulation of their an-
swers. This brings to light the need to intensify ef-
forts for members of group A to employ means for
the acquisition of the required programmatic skills,
possibly by the application of hands-on assignments
to meet the requirements demanded by the proposed
challenges, without, however, failing to contemplate
good programming practices.
These results point to the importance of observ-
ing aspects of code quality in teaching from the be-
ginning of the process, so that the members of these
classes have coherent feedback on the approaches
they take. This approach has the potential to person-
alize the monitoring of learning, to direct teaching ef-
forts to groups with common programming charac-
teristics. This can be usefull especially in distance
learning contexts.
CSEDU 2021 - 13th International Conference on Computer Supported Education
344
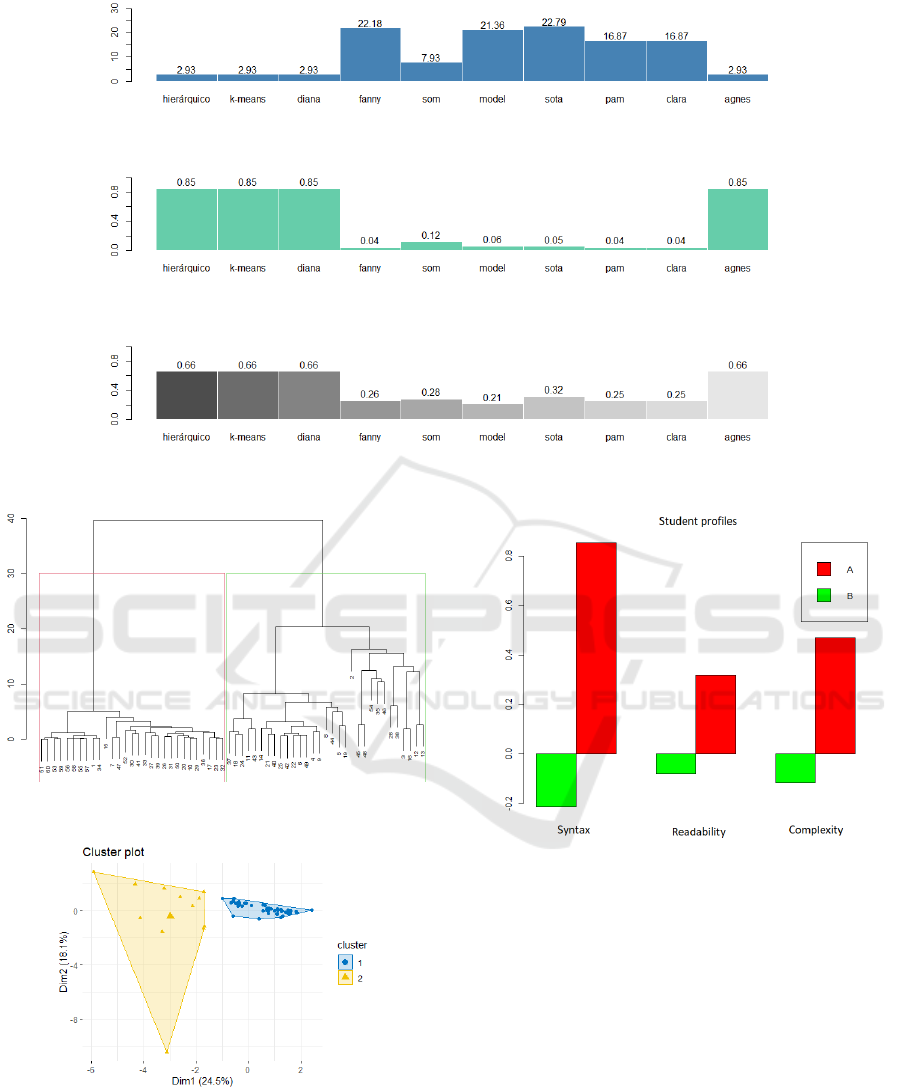
Figure 3: Connectivity plot.
Figure 4: Dunn index.
Figure 5: Silhouette coefficient.
Figure 6: Hierarchical clustering result.
Figure 7: K-means result.
6.1 Threats to Validity
Some limitations to the validity of the study must be
highlighted. The first one is the sample size, since the
low number of observations limits the ability to gen-
Figure 8: Metric value for each cluster by group of interest.
eralize the result. Another one is the fact that the vari-
ables used were identified from a database belonging
to a specific context, with peculiar characteristics of
a course, period, content and particular languages, so
that the exploration of different databases could give a
different direction to the work. Thus, there is a need to
replicate the experiments in different contexts, adding
other comparisons, to attest the feasibility of the ap-
proach in other scenarios.
7 CONCLUSION
This article presented a preliminary validation of the
collection and analysis of source code metrics refer-
Quality Assessment of Learners’ Programs by Grouping Source Code Metrics
345

ring to programming errors of university students in
Computer Science, extracted by static code analysis,
and the use of clustering methods as an approach to
investigate the learning of Algorithms.
With internal measures for group validation, it was
possible to quantify the agreement between group-
ings, among which the hierarchical, K-means and DI-
ANA were the most suitable to the analyzed set, with
equivalent results, which demonstrates a coherence
and consistency of these groupings.
With the interpretation of the groups found, it was
possible to establish a relationship between the met-
rics collected and the students’ adherence to coding
standards, thus constituting a valid initiative to com-
plement the evaluation, in addition to the analysis
based only on the outputs presented by the programs.
Among the potentialities of applying the experi-
ence reported in other contexts, we can mention the
the continuous assessment of the progress in program-
ming practice. Furthermore, this approach also of-
fers the potential benefit of reducing the effort re-
quired to monitor individual learning needs, making
it possible to focus on groups to address their spe-
cific demands, giving a personalized approach to the
teaching-learning experience.
In the near future, we intend to extract as much
data as possible to carry out new experiments and re-
fine the conclusions reached so far, in order to find a
significant set of metrics for the automatic profiling of
learners that will allow us to improve our inferences.
REFERENCES
Ala-Mutka, K. (2005). A survey of automated assessment
approaches for programming assignments. Computer
Science Education, 15:83–102.
ISO/IEC 25000 (2014). Systems and software engineer-
ing — systems and software quality requirements
and evaluation (square) — guide to square. Stan-
dard ISO/IEC 25000:2014, International Organization
for Standardization and International Electrotechnical
Commission.
ISO/IEC 25021 (2012). Systems and software engineer-
ing — systems and software quality requirements
and evaluation (square) — quality measure elements.
Standard ISO/IEC 25021:2012, International Orga-
nization for Standardization and International Elec-
trotechnical Commission.
Jesus, G., Santos, K., Conceic¸
˜
ao, J., and Neto, A. (2018).
An
´
alise dos erros mais comuns de aprendizes de
programac¸
˜
ao que utilizam a linguagem python. page
1751.
Kohonen, T. (2013). Essentials of the self-organizing map.
Neural Networks, 37:52 – 65. Twenty-fifth Anniver-
say Commemorative Issue.
McCabe, T. J. (1976). Mccabe, a complexity measure. IEEE
Transaction on Software Engineering, 2:308–320.
Melnichenko, P. (2018). Luacheck documentation.
Oliveira, A. S., C
ˆ
ortes, M. V. A., A., R. E., Carvalho, B.
T. A. d., and Neto, A. C. N. (2019). Uma proposta
para ensino semipresencial de programac¸
˜
ao apoiada
por ambiente virtual de aprendizagem e juiz on-line.
In Anais do Computer on the Beach 2019, page 756,
Florian
´
opolis, SC. Computer on the Beach.
Oliveira, M., Neves, A., Reblin, L., Franc¸a, H., Lopes,
M., and Oliveira, E. (2017). Mapeamento autom
´
atico
de perfis de estudantes em m
´
etricas de software para
an
´
alise de aprendizagem de programac¸
˜
ao. page 1337.
Rab
ˆ
elo J
´
unior, D., Neto, C., Raposo, A., and Neto, L.
(2018). Cosmo: Um ambiente virtual de aprendizado
com foco no ensino de algoritmos.
Raposo, A., Maranh
˜
ao, D., and Soares, Neto, C. (2019).
An
´
alise do modelo bkt na avaliac¸
˜
ao da curva de apren-
dizagem de alunos de algoritmos. In XXVI Simp
´
osio
Brasileiro de Inform
´
atica na Educac¸
˜
ao (SBIE 2019),
page 479.
Ribeiro, R., Barcelos, T., Souza, A. A., and Silva, L.
(2018). Mensurando o desenvolvimento do pen-
samento computacional por meio de mapas auto-
organiz
´
aveis: Comparac¸
˜
ao de m
´
etricas de complexi-
dade de software com dr. scratch e ct-test. page 609.
Santos, F. A. d. O. and Fonseca, L. (2019). Collection
and analysis of source code metrics for composition of
programming learning profiles. In 2019 IEEE 19th In-
ternational Conference on Advanced Learning Tech-
nologies (ICALT), volume 2161-377X, pages 173–
175.
Xu, D. and Tian, Y. (2015). A comprehensive survey of
clustering algorithms. Annals of Data Science, 2:165–
193.
Zaffalon Ferreira, F., Prisco Vargas, A., Souza, R., Santos,
R., Tonin, N., Bez, J. L., and Botelho, S. (2019). El o
e tri: Estimando a habilidade dos estudantes em uma
plataforma online de programac¸
˜
ao. RENOTE, 17:11–
20.
CSEDU 2021 - 13th International Conference on Computer Supported Education
346
