
Clustering Techniques to Identify Low-engagement Student Levels
Kamalesh Palani, Paul Stynes
a
and Pramod Pathak
b
School of Computing, National College of Ireland, Dublin, Ireland
Keywords: Online Learning, Virtual Learning Environment, Data Mining, Unsupervised Clustering, Gaussian Mixture,
Hierarchical, K-prototype.
Abstract: Dropout and failure rates are a major challenge with online learning. Virtual Learning Environments (VLE)
as used in universities have difficulty in monitoring student engagement during the courses with increased
rates of students dropping out. The aim of this research is to develop a data-driven clustering model aimed
at identifying low student engagement during the early stages of the course cycle. This approach, is used to
demonstrate how cluster analysis can be used to group the students who are having similar online behaviour
patterns in the VLEs. A freely accessible Open University Learning Analytics (OULA) dataset that consists
of more than 30,000 students and 7 courses is used to build clustering model based on a set of unique
features, extracted from the student’s engagement platform and academic performance. This research has
been carried out using three unsupervised clustering algorithms, namely Gaussian Mixture, Hierarchical and
K-prototype. Models efficiency is measured using a clustering evaluation metric to find the best fit model.
Results demonstrate that the K-Prototype model clustered the low-engagement students more accurately
than the other proposed models and generated highly partitioned clusters. This research can be used to help
instructors monitor student online engagement and provide additional supports to reduce the dropout rate.
a
https://orcid.org/0000-0002-4725-5698
b
https://orcid.org/0000-0001-5631-2298
1 INTRODUCTION
The increase in online learning in higher education
has led to increases in educational data. Aljohani,
Fayoumi and Hassan (2019) indicates that
educational data from the VLEs provide
opportunities to analyse the student’s behaviour
patterns, and to increase the performance of teaching
and learning behaviour. Student dropout rates and
withdrawal from the course are major challenges
with the VLEs. Hussain et al., (2018) emphasise that
the student login data is the main source for the
instructor to monitor the student’s online
engagement and provide high quality education. It is
difficult for instructors in the online platform to
monitor and access all the individual student data in
order to determine the student engagement level in
their courses. The student drop out prediction is an
ongoing challenge in the online learning platforms
which needs to be addressed so that both the student
and the online educational institution will benefit
(Chui et al., 2020).
Current research uses machine learning algorithms
to build the dropout prediction model where labelled
data is used to train the model. Hassan et al., (2019)
propose that to predict the at-risk students, individual
student engagement pattern has to be identified from
the VLEs along with academic performance to derive
the valuable insights from the data. Since the
educational data continues to increase, the diversity of
the data changes (based on the research question), and
as such there is no standard way to monitor the
students online based on their individual interaction in
the VLEs.
This research proposes a data-driven clustering
algorithm using a freely accessible OULA
(https://analyse.kmi.open.ac.uk/) dataset, to identify
low-engagement students in early stages of the
course cycle based on the individual student’s
behaviour and academic performance in the VLEs.
The aim of this research is to investigate to what
extent the unsupervised clustering algorithm can be
used to identify low-engagement students during the
early stages of the course cycle in from the VLEs.
248
Palani, K., Stynes, P. and Pathak, P.
Clustering Techniques to Identify Low-engagement Student Levels.
DOI: 10.5220/0010456802480257
In Proceedings of the 13th International Conference on Computer Supported Education (CSEDU 2021) - Volume 2, pages 248-257
ISBN: 978-989-758-502-9
Copyright
c
2021 by SCITEPRESS – Science and Technology Publications, Lda. All rights reserved

This study designs a clustering model and
implements unsupervised clustering models to
identify at risk students. A clustering evaluation
metric is used to measure the better-defined cluster
and separation between the clusters.
The key contribution of this paper is to help the
online instructor to track the student’s online
activities and build the students profile. This helps to
predict the future outcomes of the student
performance which can be used to alter teaching
content and also helps to optimize the learning
environment in the VLEs.
This paper describes related work with a focus
on low-engagement student prediction and clustering
methods in the VLEs in section 2. Section 3
describes the OULA dataset and the methodology
used in the paper. Section 4 presents the
implementation of the Clustering algorithms.
Section 5 provides the evaluation of the model.
Section 6 describes the conclusion and future work.
2 RELATED WORK
The Literature review for this research has been
written from the peer reviewed papers published
during 2010 to 2020 on the student engagement and
dropout prediction in the VLEs. Section 2.1
discusses the uses of online education system.
Section 2.2 discusses the challenges in predicting the
student’s dropout rate. Section 2.3 discusses student
engagement and learning behaviours in VLEs.
Section 2.4 provides an overview of machine
learning techniques used in dropout predictions.
Section 2.5 provides an overview of clustering in
VLEs. Section 2.6 discusses the research gap.
2.1 Study of Technology-enhanced
Learning Platform
Web based learning platforms have shown rapid
growth in higher educational institutions in many
forms such as Virtual Learning Environment, E-
Learning, Massive Open Online Courses (MOOCs)
and Modular Object-Oriented Dynamic Learning
Environments such as Moodle. This section
discusses how the VLEs are used in educational
institutions in addition to the challenges.
Corsatea and Walker (2015) has stated that most
of the VLEs in the higher educational institutions are
used as a data container to upload the study
materials. The teacher does not utilize all the tools in
the VLEs such as blogs, chat forms, and tracking of
student’s engagement in the VLEs. Students loose
motivation due to the absence of one to one
interaction in the VLEs and difficulty in finding
course materials. This affects the students’
performance. Hussain et al., (2018) has used the
VLEs log to overcome the challenges of motivation
and engagement faced by the learners. Educational
logs of the individual students can be used to analyse
the student’s engagement behaviour in the VLEs.
The instructor can monitor the students using the
logs stored in the VLE. However, it is not possible
to analyse individual student logs for all courses due
to the limited number of instructors in higher
educational institutions. Furthermore, (Hussain et
al., 2018) suggests that an automated intelligent
system is required to process or extract information
from student’s logs. This information can be used by
the instructor to profile the students and understand
the student’s engagement in the VLEs in a
meaningful way. Agnihotri et al., (2015) analysed
student’s login data from an online assessment
platform tool called “connect”. Connect contains the
number of times the students logged in to the course
for the entire course duration. The student logs were
used for student profiling and monitoring, however a
limitation in this research is the choice limited
factors when profiling the students.
From the current research it is clear that the
student’s log in the VLEs can be used to predict
their behaviour by monitoring and profiling the
student’s engagements in the VLEs courses. In the
next section the reason for student drop out in the
VLEs will be explored.
2.2 Study of Student Drop out in
Virtual Learning Environment
One of the major challenges faced by higher
educational institutions is students drop out and
failure rates. Low-engagement students who are
enrolled on the course may not complete the course.
Dalipi, Imran and Kastrati, (2018) have reviewed
the student dropout prediction and their challenges.
Their recommendations are to tackle student related
factors such as the lack of motivation, lack of time
and insufficient knowledge for the courses. In
addition they recommend to address VLE related
factors such as course design, hidden cost and lack
of interactivity or monitoring in VLEs. In order to
build the effective prediction model, students’
clickstreams data, academic performance and social
engagement features or variables have to be
considered.
Yi et al., (2018) have used non-cognitive skills
such as sleep hour, usage of smart phones,
Clustering Techniques to Identify Low-engagement Student Levels
249

consumption of energy drinks, and the number of
visits to doctor in order to predict the drop out
students. The main limitation of this research is that
the data collected is course specific and not
generalized to other courses. In addition the data
used to train the model is small.
Liang et al., (2016) used data from the edX
platform to build the predictive model. Data is
extracted from the edX platform which contains the
enrolment, user and course feature data. The
classification model was built to classify the
students. For the user feature, this research has used
the data from the student interaction with the video
and the clicks the students has made for each course
in order to build the model. This approach has not
been carried out in VLEs and the students
interacting with the video are not properly recorded.
Therefore, in this research the trained model has data
loss which is a major drawback.
Overall to predict the students drop out in VLEs
feature selection from the VLEs log and the size of
the dataset are the important factors that have to be
considered in building the model. In addition, the
growing educational data in the institution provides
opportunities to improve the student performance
and optimise the learning environment (Hassan et
al., 2019).
2.3 Understanding of Student
Engagement in VLEs
Student engagement in the VLE is the effort that the
student spends on interacting with the VLE. The
student engagement metric in the prediction of
student drop out is an important factor because lack
of interaction in the VLEs will usually affect student
engagement. Due to the absence of face to face
meetings in web-based systems it is difficult to
measure student engagement in VLEs such as
attendance, interaction of the students in the courses
and grades. There are no standard approaches to
understand student behaviour in VLEs due to the
challenges in measuring student engagement.
Waheed et al., (2020) uses student’s engagement
as a key factor to predict the student academic
performance in the VLEs and develops a deep
learning prediction model using a binary
classification dataset that describes whether a
student will pass or fail at the end of the course. The
VLEs log clickstream is taken as an important factor
in predicting the student performance. However, the
model was built on the assumption that the student’s
behaviour during the course is treated as equal. The
absence of individual student’s behaviour pattern is
not considered in this research. Boroujeni and
Dillenbourg, (2019) have tried different approaches
to analyse the individual learning processes from the
VLEs. In their research video, assessment details are
extracted from the student’s interaction logs on a
weekly basis in order to analyse the individual
student behaviour. A limitation in this research is the
fixed-study pattern which was used to train the
model and the students who change their study
pattern are given less importance.
Understating the individual students learning
behaviour in the VLEs is an important metric that
has to be included while training the model so that
the accuracy of predicting the low engagement
students in the VLEs can be increased (Corrigan and
Smeaton, 2017). In the next subsection different
machine learning (ML) and clustering techniques
that are used to build the student drop out prediction
model in the VLEs is discussed.
2.4 Machine Learning Techniques
Used in Predicting
Low-engagement Students
Chui et al., (2020) used support vector machine
(RTV-SVM) to predict low-engagement students
and marginal students in the VLEs. However, in this
work the students who are dropping out of the
course cannot be identified in real time. They can
only be identified after the completion of the course
when the drop out students are identified. Macarini
et al., (2019) has tried to predict the at-risk students
during the early stages of the course cycle using a
Moodle dataset. Four classification models were
built namely AdaBoost, Decision Tree, Random
Forest and Naive Bayes. The dataset which was
transformed on a weekly basis and the “Area Under
Curve” (AUC) was used to evaluate the model. A
limitation of this research was that the dataset used
to train the model is small and oversampling
techniques such as SMOTE are used to balance the
data. The performance of the model changes every
time the model is trained. A drop out predicting
system developed by (Hassan et al., 2019) used
Deep learning models such as Long Short-Term
Memory (LSTM) and Artificial Neural Network to
build the model using smart data which was
transformed into week-wise clickstream data. The
authors (Hassan et al., 2019) mention that deep
learning models perform better than the traditional
machine learning models with better accuracy in
predicting the at-risk students. They also suggest
that sequence to sequence approach on student’s
interaction pattern can be built into the model for
CSEDU 2021 - 13th International Conference on Computer Supported Education
250

better accuracy. However, a limitation of research
(Hassan et al., 2019) is that students engagement
pattern in their courses is not considered. Corrigan
and Smeaton (2017) have used Recurrent Neural
Networks (RNN) with student interaction pattern to
predict how well the students will perform in their
VLEs courses. However, a limitation is that 2,879
students are used to train the model, and to include
any new courses, one year of data has to be
collected, and after that the model has to be trained.
2.5 An Understanding of Clustering in
VLEs
Agnihotri et al., (2015) used data-driven clustering
methods to identify the high and low achiever in
online courses. The K-means clustering algorithm is
used to group students based on the login behaviour
of the students and the number of attempts to clear
the course. Data aggregations used in this research
are not properly processed. There are lot of null
values in training the model and less factors are used
to build the model. Preidys and Sakalauskas, (2010)
extracted huge data from the BlackBoard Vista
distance learning platform to analyse the learners
study pattern. Three clusters were identified from
the dataset namely Important, Unimportant and
Average importance using K-means clustering.
There are several outliers in the dataset and the same
is used to build the model. The above mentioned
challenges have been resolved in (Navarro &
Moreno-Ger, 2018). In this research a huge dataset
with no outliers has been used on an education
dataset to determine which clustering algorithm
performs better in predicting the low learners in the
VLEs. Seven clustering models have been used in
this work and to benchmark the performance
different evaluation metrics like Dunn Index,
Silhouette score and Davies-Bouldin score have
been compared to identify which algorithm performs
better. However, a specific limitation in this research
is that missing data in instances in the factors are
removed, which may contain useful information and
provide additional insights. 44% of the data is
cleaned from the original data.
2.6 Research Gaps
Current research studies indicate that there is no
standard way to predict low-engagement students in
the VLEs. The size of the dataset is a major
limitation where most of the studies have used the
student’s data which is less than 1000 in order to
train the model.
Therefore, the aim of this research is to
implement the clustering model on the OULA
dataset and to identify low-engagement students in
the VLEs. All interaction patterns of the individual
students in the VLEs such as academic performance
and student information will be used and converted
into smart data to predict the low-engagement
students in the early stages of the course cycle.
Clustering models like Gaussian mixture, K-
prototype and Hierarchical clustering are used with
different parameters and compared with the
evaluation metric (Navarro Moreno-Ger, 2018) to
evaluate which model performs better. Overall, this
research will be helpful to both the instructor and the
students in the online learning environments for
profiling and tracking of students. The teaching
content can be altered in VLEs by knowing the
students behaviour.
3 RESEARCH METHODOLOGY
To extract meaningful insights from the complex
data, the Knowledge Discovery in Database (KDD)
methodology is used in this research. The steps
followed are the data selection and understanding,
data pre-processing and transformation, modelling
and evaluation.
3.1 Data Selection and Understanding
The dataset has been extracted from the Open
University Learning Analytics (OULA) Dataset
which is one of the distance learning universities in
the United Kingdom (UK). This dataset is unique
from the other educational data because it contains
the student’s demographic data along with the
student’s interactions in the VLEs which is
clickstream. There are 32,593 students in this dataset
for 22 different courses for the period 2013 and
2014. The dataset is publicly available and contains
the student’s anonymized information. The dataset
follows ethical and privacy requirements of the
Open University. There are 7 different CSV files
which contain different information related to
student’s demographic, assessment scores and the
student’s interaction with the VLEs.
Raw data is transformed to aggregated data with
newly created attributes from different files of the
data. Three different type of category are extracted
from the dataset namely learning behaviour, student
course performance and the demographic details of
students.
Clustering Techniques to Identify Low-engagement Student Levels
251

3.2 Data Pre-processing and
Transformation
The raw data is transformed into actionable
aggregated data because it cannot be directly used as
input into the clustering model. All the pre-
processing and transformation steps are performed
in Python Jupyter Notebook using pandas library.
First, data exploration is carried out to check the
distribution of the data, finding missing values and
checking outliers in the data. Both univariate and
bivariate analysis has been carried out and outlier
and missing values are filtered from the dataset. In
the second step data transformation like encoding
the categorical variables and standardization of the
data is performed. In the third step new variables are
created for each student namely the overall studied
credits, total score, average clicks week wise, and
attempted weight for each course. To improve the
clustering model performance one hot-encoding is
done on the categorical column before giving as an
input to train the model. In the last step, columns
that are not contributing to the low student
engagement prediction are dropped before
implementing the model. A detailed description of
aggregated data preparation and processing is
explained is section 4.1.
3.3 Modelling
The aggregated and transformed data is given as an
input to the clustering model. Three clustering
models are implemented on the above transformed
smart dataset namely K-Prototype, Gaussian
Mixture and Hierarchical. Identifying the optimal
number of clusters in the dataset is done using the
Gap Statistics (MacEdo et al., 2019). The dataset is
used to train the K-Prototype model. The K-
Prototype is the combination of K-means and K-
mode clustering technique. The aggregated dataset
contains both numeric and categorical variables
therefore this specific type of clustering model is
chosen (Wang et al., 2016). Hierarchical clustering
is used as this analysis is based on finding similar
student’s interaction behaviour in VLEs.
Hierarchical clustering merges the clusters based on
the similarity and also both top down and bottom up
approaches can be tested (De Morais, Araújo &
Costa, 2015). The Gaussian Mixture clustering
model is chosen because it is a probabilistic model
and the approach will not complete until all the data
points are converged in different clusters and also it
uses a soft clustering approach.
3.4 Evaluation
The clustering evaluation Metrics, Silhouette
Coefficient, Davies-Bouldin index and Calinski-
Harabasz will be used to evaluate the model
performance. These metrics can show if the clusters
are well separated and are not overlapping. The
Silhouette coefficient metric calculates the mean
distance between the data points to find the better-
defined clusters, the clustering configuration is
appropriate if it has a high value (range -1 to 1).
The higher the Calinski-Harabasz index the better
the clusters are defined in the model. Finally, the
Davies-Bouldin index is used to check the similarity
between the clusters and the lower the index value
the better is the clustering.
4 IMPLEMENTATION
In this section implementation of the Fuzzy C-means
model (MacEdo et al., 2019), proposed clustering
models and preparation of aggregated data is
discussed along with the technical specifications.
4.1 Aggregated Data Preparation and
Pre-processing
In order to predict the low-engagement students, the
raw OULA dataset is transformed to aggregated data
by processing all the data from the files into a single
table. The aim of this research is to use the three
important attributes – Learning Behaviour,
Performance and Demographic details of the
students as an input to the clustering models.
Therefore, data transformation has been conducted
in the cleaned dataset to derive the above-mentioned
attributes. Firstly, to derive the learning behaviour
student’s clickstream data has been processed to
week wise for 20 different activity from the VLEs
namely URLs, Homepage, Forums, Quiz,
Questionnaires, Folders, etc. Each week wise
aggregation of clicks has been added to the previous
week student click stream behaviour. Secondly, for
student’s performance, the average score the
students has attained in all the assignments before
the final exam has been added into a new column in
the dataset. Also, adjusted mark and attempted
weights are calculated based on the assessments
score and total credits. Finally, for Demographic
attributes, one-hot encoding is done on the
categorical columns. Prior to running the model,
data was normalized and scaled down to fixed range
(0 to 1). This normalization of the data improves the
CSEDU 2021 - 13th International Conference on Computer Supported Education
252

performance of the model, due to the fact that all the
clustering models use Euclidean distance to find the
distance between the closest points to the near
clusters. Overall, after performing the above steps
actionable aggregated data has been prepared and
the same is given as an input to train the clustering
models.
4.2 Implementation of Clustering
Models
All the clustering models are implemented in Python
3.7 using Jupyter Notebook and Scikit-learn
libraries. The number of clusters for the clustering
models is identified by using Gap Statistics
(MacEdo et al., 2019) on the aggregated data. Gap-
stat library has been imported from python and used
by the range of values from 0 to 11 for K by fitting
the model and including all the indexes. The point of
reflection of the curve was found at 3 which means
for the dataset the number of clusters can be used is
3, to run the clustering models. Therefore, all the
models were executed with 3 clusters to group the
students based on the individual behaviours in the
VLE.
4.2.1 Fuzzy C-means Clustering
The Fuzzy C-means clustering model has been
implemented by defining three clusters. MAX_ITER
parameter has been set to 20 to limit the model from
running an infinite loop. Also, m parameter value is
given greater than 1 to avoid the model to run as K-
nearest neighbours. After, passing the parameters,
the model is fitted and cluster labels are stored in a
separate variable. A scatter plot was used to
visualize the clusters in order to find the dispersion
of the data and the clusters.
4.2.2 Hierarchical Clustering Model
Agglomerative clustering has been imported from
the “sklearn.cluster” library in python in order to
perform hierarchical clustering on the normalized
data. The output result of the clusters labels are used
to identify the students who have low-engagement
by plotting the scatter plot using matplotlib library in
python and setting the parameter of x-axis to the
score attribute and the y-axis to the sum of clicks
attribute in the dataset. Additionally, to check the
performance of the model the clusters labels, metric
and normalized data are used to find how well the
clusters are separated between the datapoints using
the evaluation metric.
4.2.3 Gaussian Mixture Clustering
The Gaussian mixture clustering model is imported
from the sklearn.mixture library in python and the
created function runs the model using the defined
parameters. After setting the parameters, the model
is built using the fit method and the output of the
methods is the cluster labels. Using the clusters
labels both the scatter plot and evaluation metrics
are performed to find the performance of the model.
4.2.4 K-prototype Clustering
In this clustering model both categorical and
numerical data have been given as input to the
model as the K-prototype algorithm works well with
mixed data. For numerical data this model uses the
Euclidean distance to cluster the data points and for
categorical data it uses the similarity between the
data points to group into clusters. Ten iterations are
carried out and for each iteration centroids and
clusters are redefined and the best iteration is chosen
based on the less variance between the clusters.
After setting the parameters the model was fitted
into the fit method by defining the categorical
variable separately. The output of the method
showed that in the eighth iteration less variance has
been achieved and the clusters labels are plotted in
the seaborn library in python to find whether the
clusters are well separated.
5 EVALUATION
This section discusses the results and performance of
the clustering models. In experiment 1, choosing the
number of clusters for the aggregated data is
discussed and experiment 2, 3, 4 compares the
clustering models in order to identify the best model
which has less overlap of data points between the
clusters.
5.1 Experiment 1: Gap Statistics
Statistical testing methods are used to find the
optimal numbers of clusters in a dataset. Gap
statistics is used as the metric to find the clusters as
used in MacEdo et al., (2019). The gap statistics
identifies the elbow point at 3. Therefore, 3 optimal
clusters are used in the clustering models to cluster
the students using the aggregated dataset.
Clustering Techniques to Identify Low-engagement Student Levels
253
5.2 Experiment 2: Fuzzy C-Means vs
Gaussian Mixture
In this experiment Fuzzy C-means and the Gaussian
Mixture models were built and their results are
compared. Model performance is compared using
evaluation metrics. Table 1 shows the metric result
of the Fuzzy C-means and Gaussian Mixture
clustering model.
Table 1: Fuzzy c-means vs Gaussian Mixture.
Model
Silhouette
Coefficient
Calinski-
Harabasz Index
Davies-
Bouldin
Index
Fuzzy c-
means
0.38 4731 0.94
Gaussian
Mixture
0.51 3152 0.67
Results demonstrate that the proposed Gaussian
mixture model outperformed the fuzzy c-means
model. The Silhouette score of the Gaussian model
shows a 13% increase and the Davis score is 27% less
when compared to the fuzzy c-means model.
However, Calinski index metric which explains how
well the data points are separated from other clusters
shows a less result for the gaussian model. The scatter
plot of Gaussian mixture model showed that the data
are overlapped in cluster 1 and 2. Therefore, to reduce
the overlapping of the data points in the cluster, the
model that outperformed in this experiment, namely
Gaussian Mixture is compared with the Hierarchical
Clustering model in experiment 3.
5.3 Experiment 3: Gaussian Mixture vs
Hierarchical
The hierarchical clustering model was compared
with the gaussian mixture model. The results show
that hierarchical model performed better than the
gaussian in the calinski-harbaz and the davis-bouldin
index.
Table 2: Gaussian Mixture vs Hierarchical.
Model
Silhouette
Coefficient
Calinski-
Harabasz Index
Davies-
Bouldin
Index
Gaussian
Mixture
0.51 3152 0.67
Hierarchical 0.52 4552 0.52
Table 2 shows the performance comparison of
the model. From the hierarchical scatter plot, it was
evident that the hierarchical clustering model has an
overlapping of datapoints between clusters 1 and
cluster 2. Therefore, to reduce the overlapping of
datapoints between the clusters, the K-Prototype
clustering model is used in the next experiment and
compared with the hierarchical model.
5.4 Experiment 4: Hierarchical vs
K-prototype
The K-Prototype clustering model was implemented
in this experiment and used a different notion of
distance in order to calculate the distance between
the clusters. 10 iterations were used to find the best
separation of clusters and centroids. The K-
Prototype model produced the best result in iteration
2. Table 3 shows the performance of the models.
Table 3: Hierarchical vs K-Prototype.
Model
Silhouette
Coefficient
Calinski -
Harabasz Index
Davies-
Bouldin
Index
Hierarchical 0.52 4552 0.52
K-Prototype 0.75 17847 0.28
The K-Prototype clustering algorithm shows
better results when compared to all the experiments
and the Davies-Bouldin index is lower (closer to 0)
which indicates that the groupings of the students is
better partitioned. The Silhouette and Calinski-
Harabasz value is higher when compared to the
Hierarchical clustering model which shows that the
clusters are better defined in the k-prototype model.
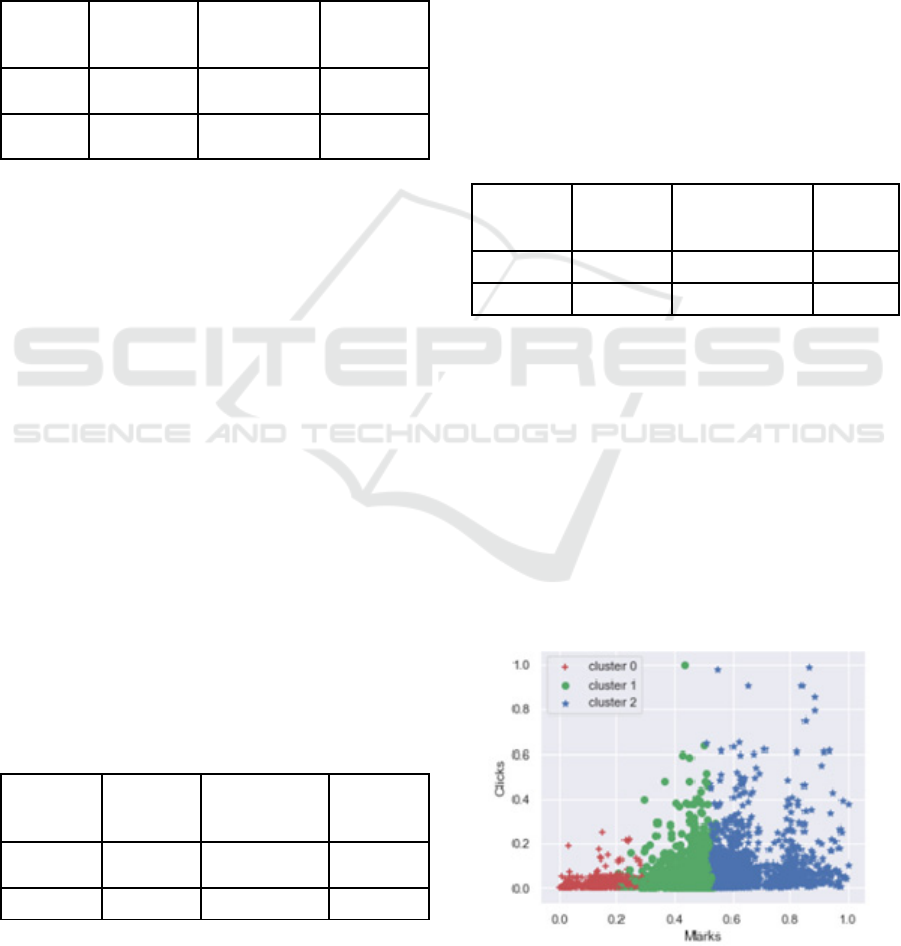
The scatter plot in Figure 1 shows that the clusters 1
and 2 are well partitioned and separated between the
data points and the overlapping of clusters is
reduced in this model compared to the models
implemented in experiments 2 and 3.
Figure 1: K-Prototype model scatter plot.
CSEDU 2021 - 13th International Conference on Computer Supported Education
254
5.5 Discussion
Results show that the k- prototype clustering model
produced a better partition of clusters compared to
the other models. The reason behind the
performance improvement of k-prototype is that this
model is designed to work on both categorical and
numerical attributes in the dataset. In addition, the
distance between the data points to group the
clusters is measured using two metrics. For numeric
values Euclidean distance is used and for categorical
values the similarity between the points is used. In
the other models categorical data is converted into
numeric data using one-hot encoding which reduces
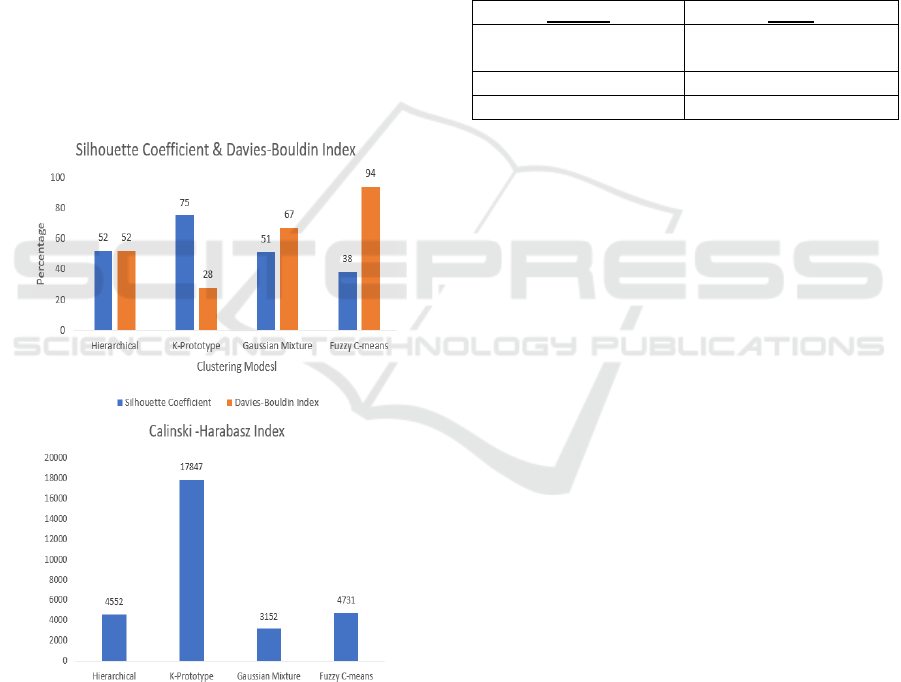
the model’s performance. Figure 2 shows that, the
silhouette coefficient score for the k-prototype
model is 0.75 and for fuzzy c-means which is 38.
There is significant increase in the separation of the
data points between the clusters in the k-prototype
model. The hierarchical and gaussian mixture
models also performed less compared to k-prototype.
Figure 2: Comparison of Evaluation Metric for all models.
The Calinski -Harabasz score is used to find the
variance of the data points between the clusters. If
the value of the score is higher then the cluster is
dense and well separated. The Calinski-Harabasz
score for the k-prototype is 17847 which is higher
when compared to the other models. The Davies-
Bouldin score is calculated for the scaled data. The
lesser the value of the Davies-Bouldin score the
better the separation of the clusters. For k-prototype
model the score is 0.28. Table 4 shows the cluster
labels that is observed in the clustering result for the
k-prototype model. It shows that cluster 0, represent
the class of low-engaging at-risk students with low
interaction in the VLE and low scores in the
modules. Cluster 1 contains the marginal students
who are also at risk with medium engagement in the
VLE and where they attained low scores. Finally,
cluster 2 represent the distinction students who have
attained high scores in assignments with high
interaction in the VLEs.
Table 4: K-prototype clustering result.
Cluster Class
Cluster 0
Low-engagement
students
Cluste
r
1Mar
g
inal students
Cluste
r
2 Distinction students
In summary, the k-prototype model shows less
overlapping of clusters compared to other model and
identifies the at-risk students with high performance.
The generalisability of this research is limited as it is
only using one dataset, though it is a large dataset
from a very established open university. Further
research studies are needed to establish the
generalisation of this model.
6 CONCLUSION AND FUTURE
WORK
Identifying low-engagement students in an online
learning environment is important because it allows
the instructor to monitor the student’s behaviour.
The OULA dataset from one of the largest distance
learning university in the UK is collected and
formatted to actionable aggregated data in a form
suitable for input to the clustering model. Then
fuzzy c-means model and multiple clustering models
have been applied on the data to identify the optimal
model at identifying low-engagement students.
The results of the experiment showed that K-
Prototype clustering algorithm is the most appropriate
algorithm in identifying low-engagement students in
the VLEs compared to Fuzzy C-means, Gaussian
Mixture and Hierarchical models showing the
Silhouette score of 0.75 which indicates the clusters
are better partitioned and Davies-Bouldin score of
0.28 which indicates less variance between the
cluster. The results show that the clickstream
Clustering Techniques to Identify Low-engagement Student Levels
255

behaviour of the students in VLE and academic
success are the key factors that have an impact in
identifying the low-engagement students.
Future work will extend this research further by
exploring individual student’s day to day activity to
get detailed understanding of student’s behaviours in
VLEs. Also, behavioural change of the students
between the courses may be analysed for examining
student’s behaviour. Mining the student’s textual
data from the feedback forms using Natural
Language processing from the VLEs can also be an
important factor in identifying the student
performance. Additionally, use of date attributes like
assignments submission date and student’s week
wise interactivity in VLE can be used to build the
model using time series which can result in
monitoring the students daily or in weekly
frequency. Future work is also needed to test the
model in other online teaching contexts.
Finally, this research work will be helpful for
educational institutions, learning analytics and future
researchers in choosing the important attribute to
identifying the low-engagement students in the online
learning environment and to figure-out how to pick
the best performing clustering algorithm based on the
clustering analysis in educational dataset.
REFERENCES
Agnihotri, L. et al. (2015). ‘Mining Login Data For
Actionable Student Insight’, Proceedings of the 8th
International Conference on Educational Data Mining
(EDM), pp. 472–475.
Aljohani, N. R. et al. (2019) ‘Predicting at-risk students
using clickstream data in the virtual learning
environment’, Sustainability (Switzerland), 11(24), pp.
1–12.
Boroujeni, M. S. and Dillenbourg, P. (2019) ‘Discovery
and temporal analysis of MOOC study patterns’,
Journal of Learning Analytics, 6(1), pp. 16–33. doi:
10.18608/jla.2019.61.2.
Chui, K. T. et al. (2020) ‘Predicting at-risk university
students in a virtual learning environment via a
machine learning algorithm’, Computers in Human
Behavior. Elsevier, 107(December 2017), p. 105584.
doi: 10.1016/j.chb.2018.06.032.
Corrigan, O. and Smeaton, A. F. (2017) ‘A course
agnostic approach to predicting student success from
vle log data using recurrent neural networks’, Lecture
Notes in Computer Science (including subseries
Lecture Notes in Artificial Intelligence and Lecture
Notes in Bioinformatics), 10474 LNCS, pp. 545–548.
doi: 10.1007/978-3-319-66610-5_59.
Corsatea, B. M. and Walker, S. (2015) Opportunities for
Moodle data and learning intelligence in Virtual
Environments, 2015 IEEE International Conference on
Evolving and Adaptive Intelligent Systems, EAIS
2015. IEEE. doi: 10.1109/EAIS.2015.7368776.
Dalipi, F., Imran, A. S. and Kastrati, Z. (2018) ‘MOOC
dropout prediction using machine learning techniques:
Review and research challenges’, IEEE Global
Engineering Education Conference, EDUCON. IEEE,
2018-April, pp. 1007–1014. doi:
10.1109/EDUCON.2018.8363340.
Hassan, S. U. et al. (2019) ‘Virtual learning environment
to predict withdrawal by leveraging deep learning’,
International Journal of Intelligent Systems, 34(8), pp.
1935–1952. doi: 10.1002/int.22129.
Hussain, M. et al. (2018) ‘Student Engagement Predictions
in an e-Learning System and Their Impact on Student
Course Assessment Scores’, Computational
Intelligence and Neuroscience, 2018. doi:
10.1155/2018/6347186.
Kuzilek, J., Hlosta, M. and Zdrahal, Z. (2017) ‘Data
Descriptor: Open University Learning Analytics
dataset’, Scientific Data, 4, pp. 1–8. doi:
10.1038/sdata.2017.171.
Liang, J. et al. (2016) ‘Big data application in education:
Dropout prediction in edx MOOCs’, Proceedings -
2016 IEEE 2nd International Conference on
Multimedia Big Data, BigMM 2016. IEEE, pp. 440–
443. doi: 10.1109/BigMM.2016.70.
Macarini, L. A. B. et al. (2019) ‘Predicting students
success in blended learning-Evaluating different
interactions inside learning management systems’,
Applied Sciences (Switzerland), 9(24). doi:
10.3390/app9245523.
MacEdo, M. et al. (2019) ‘Investigation of college dropout
with the fuzzy c-means algorithm’, Proceedings -
IEEE 19th International Conference on Advanced
Learning Technologies, ICALT 2019. IEEE, pp. 187–
189. doi: 10.1109/ICALT.2019.00055.
De Morais, A. M., Araújo, J. M. F. R. and Costa, E. B.
(2015) ‘Monitoring student performance using data
clustering and predictive modelling’, Proceedings -
Frontiers in Education Conference, FIE, 2015-
Febru(February). doi: 10.1109/FIE.2014.7044401.
Navarro, Á. M. and Moreno-Ger, P. (2018) ‘Comparison
of Clustering Algorithms for Learning Analytics with
Educational Datasets’, International Journal of
Interactive Multimedia and Artificial Intelligence,
5(2), p. 9. doi: 10.9781/ijimai.2018.02.003.
Preidys, S. and Sakalauskas, L. (2010) ‘Analysis of
students’ study activities in virtual learning
environments using data mining methods’,
Technological and Economic Development of
Economy, 16(1), pp. 94–108. doi:
10.3846/tede.2010.06.
Waheed, H. et al. (2020) ‘Predicting academic
performance of students from VLE big data using deep
learning models’, Computers in Human Behavior.
Elsevier Ltd, 104(November 2018), p. 106189. doi:
10.1016/j.chb.2019.106189.
Wang, F. et al. (2016) ‘Empirical comparative analysis of
1-of-K coding and K-prototypes in categorical
CSEDU 2021 - 13th International Conference on Computer Supported Education
256

clustering’, CEUR Workshop Proceedings, 1751(c),
pp. 248–259.
Yi, J. C. et al. (2018) ‘Predictive analytics approach to
improve and sustain college students’ non-cognitive
skills and their educational outcome’, Sustainability
(Switzerland), 10(11). doi: 10.3390/su10114012.
Clustering Techniques to Identify Low-engagement Student Levels
257
