
Mapping Personality Traits through Keystroke Analysis
Felipe Valad
˜
ao Goulart
a
and Daniel Oliveira Dantas
b
Departamento de Computac¸
˜
ao, Universidade Federal de Sergipe, Brazil
Keywords:
Personality Traits Extraction, Big Five, Neural Networks.
Abstract:
Personality can be defined as a set of psychological features that may determine how to think, act, and feel,
as well as may directly influence an individual’s interests. The Big Five model is widely used to describe the
main traits of the personality of an individual. This study aims to develop an approach to identify personality
traits from keystroke dynamics data using neural networks. We developed a non-intrusive approach to collect
keystroke dynamics data from the users and used a self-assessment questionnaire of personality to identify
Big Five personality traits. Experiments showed no evidence that the exclusive use of keystroke dynamics
characteristics can provide enough information to identify an individual’s personality traits.
1 INTRODUCTION
Affective computing is a branch of intelligent com-
puting that deals with the properties of users’ per-
sonality and emotion in computational systems. Its
goal is to identify, model, and implement human emo-
tion in a computational format, giving the system the
ability to react based on the user’s personality. The
personality can be defined as a set of psychologi-
cal properties capable of determining the individual-
ity of someone based on the way he thinks, acts, and
feels (Pervin et al., 2004), influencing the behavior
(Carver, 2000), being public knowledge, although no-
body knows how to describe in a precise way (All-
port, 1961). The personality is known as a relatively
stable characteristic in an individual that can be mod-
ified, but is relatively stable for about 45 years, start-
ing on the adult phase (Nunes et al., 2010) and is a
determining factor on the human behavior. The per-
sonality is capable of directly influencing the interests
of an individual, making the computational identifica-
tion and modeling of personality a prerequisite for the
creation of new applications, system models, and cus-
tomizable virtual environments (Stathopoulou et al.,
2010).
Computational systems are developed to perform
a uniform behavior, independently of the user inter-
acting with it, using just the the input data. We may
enable computer systems to analyze the user’s input
a
https://orcid.org/0000-0001-6030-7651
b
https://orcid.org/0000-0002-0142-891X
data not just as a source of raw information but also
as a source of metadata capable of identifying individ-
uals and a group of users with similar behaviors and
interests. Doing so opens the doors to the construction
of a new class of computer systems, aimed at person-
alizing the user experience, adapting itself according
to each individual’s particular characteristics.
Keystroke dynamics is the process of extracting an
individual’s biometric pattern using the manner and
rhythm at which he types characters on a keyboard
(Shepherd, 1995). The data extracted from keystroke
dynamics can be used for authentication, identifica-
tion, and analysis of the user’s particular character-
istics. This biometric pattern is available from any
conventional computer keyboard and can be easily ex-
tracted when looking for the data from a key holding
time and up time. Hold time, which is often found
in the literature as dwell time or down time, repre-
sents the time interval between pressing and releasing
the same key on a keyboard. Up time, also described
as flight time or up-down time, represents the time
elapsed between releasing the current key and press-
ing the next one. From a dataset containing these two
characteristics, it is possible to determine the pattern
of typing of an individual, and from this pattern seek
the correlation with the characteristics of his person-
ality.
The demand for giving the computer the ability to
identify, interpret, and respond appropriately to a user
depending on his characteristics is an important step
in the evolution of human-computer interaction. Pre-
vious studies (Khan et al., 2008; Nahin et al., 2014;
474
Goulart, F. and Dantas, D.
Mapping Personality Traits through Keystroke Analysis.
DOI: 10.5220/0010456304740482
In Proceedings of the 23rd International Conference on Enterprise Information Systems (ICEIS 2021) - Volume 2, pages 474-482
ISBN: 978-989-758-509-8
Copyright
c
2021 by SCITEPRESS – Science and Technology Publications, Lda. All rights reserved

Solanki and Shukla, 2014) state that emotions have a
significant role in this process.
Khan (Khan et al., 2008) developed a tool to ex-
tract individuals’ personality traits through the typing
rhythm and mouse usage, basing their experiments on
studies that identified that extroverts interact with the
interface of computer systems more quickly than an
introvert. As a result of his studies, Khan (Khan et al.,
2008) concluded that it is possible to measure a user’s
personality through his way of using the keyboard and
mouse. In this study, Khan (Khan et al., 2008) used
a reduced version of the NEO-IPIP (Neuroticism-
Extraversion-Openness International Inventory Item
Pool) as a form of self-assessment by the participants.
The NEO-IPIP questionnaire is composed of 120
questions and requires between 15 and 25 minutes to
be answered. The results obtained by Khan (Khan
et al., 2008) for the five personality traits mapped var-
ied between -0.4 and -0.56, which according to the
Pearson scale represent ”weak” and ”moderate” cor-
relations, respectively.
Khanna and Sasikumar (Khanna and Sasikumar,
2010) proposed an approach to detect the emotions
of computer users from data obtained from the use
of a conventional keyboard. The approach is based
on the study of more specific characteristics, such
as typing speed, mode, standard deviation, amount
of backspaces, and others, obtained from the analy-
sis of the hold time and up time of each individual.
This study included 300 participants (45% women
and 55% men), aged between 21 and 41 years, and
obtained up to 88.88% and 89.02% success rates in
the identification of positive and negative emotions,
respectively.
The use of keystroke dynamics data as a source
of information for detecting emotional state was also
the subject of a study carried out by Epp, Lippold and
Mandryk (Epp et al., 2011), which, with only 12 par-
ticipants (10 men and 2 women), mapped 15 distinct
emotional states with success rates ranging between
77.40% and 87.80%. Zimmermann (Zimmermann
et al., 2003) present an approach similar to Khan
(Khan et al., 2008) when simultaneously using data
extracted from the keyboard and mouse, although the
studies of Zimmermann (Zimmermann et al., 2003)
do not focus directly on personality extraction but
on the measurement of mood. His aim is to im-
prove human-computer interaction without worrying
if the current mood comes from permanent personal-
ity characteristics or something temporary related to
the individual’s emotional state.
Supporting the usage of keystroke dynamics as a
method of extracting user data, Nahin (Nahin et al.,
2014) justify that the computer keyboard, even though
it is a cheap equipment, still allows communication
between humans and computers. In their work, seven
classes of predefined emotions were used (joy, fear,
anger, sadness, guilt, shame, and disgust) to detect
the variation in the behavior of computer users dur-
ing the process of transition from one emotional state
to another. The work developed by them was done
so that no additional hardware other than a conven-
tional computer keyboard was needed. To carry out
their study, Nahin (Nahin et al., 2014) defined two
different approaches: use of predefined text, and; use
of free text. Not only was the user’s typing rate an-
alyzed, but also an analysis of the text he produced.
The data acquisition phase was carried out with only
25 volunteers, whose ages varied between 15 and 40
years, with approximately 45% of the participants be-
ing women and 55% men. As a result of their work,
Nahin (Nahin et al., 2014) achieved between 60% and
87% accuracy in identifying those emotions.
Solanki and Shukla (Solanki and Shukla, 2014)
also developed an approach to extract the emotional
state of individuals using data from the typing rhythm
and its correlation with self-assessment question-
naires. In their work, Solanki and Shukla (Solanki
and Shukla, 2014) aimed to identify the emotional
state based on the use of a conventional computer key-
board, focusing on identifying emotions: confidence,
sadness, happiness, tiredness, nervousness, and anger.
As well as done by Nahin (Nahin et al., 2014), their
work involves two approaches: use of predefined text,
and; use of free text. Both experiments obtained good
results in identifying the selected emotion classes, and
the use of predefined fixed text was more accurate in
identifying most emotions. In another of his studies,
Khan (Khan et al., 2015) analyzed 47 individuals to
identify programmers’ personality through the inter-
action with keyboard and mouse and the application
of self-assessment questionnaires. At the end of his
study, Khan (Khan et al., 2015) stated that it is pos-
sible to differentiate good programmers from not so
good programmers in an objective way by correlating
the data produced by them.
To identify characteristics such as gender and
age of individuals through the typing rhythm, Plank
(Plank, 2018) presented in her work evidence about
the strong relationship between the individual’s iden-
tity and the way he types. Buker (Buker et al., 2019)
also shows a similar approach to identify the typist
gender through keystroke dynamics, with accuracy
higher than 95%. Although these studies can iden-
tify characteristics such as age and gender with a high
accuracy, no details about the possibility of extract-
ing other characteristics, such as personality traits,
through the typing rhythm are presented.
Mapping Personality Traits through Keystroke Analysis
475

In this work, we aim to classify individual’s per-
sonality traits based on his keystroke dynamics. A
dataset was acquired containing subjects’ data from
a self-assessment personality questionnaire and their
keystroke dynamics. To do that, we used convolu-
tional neural networks with the keystroke dynamics
data as input and as output the level of each personal-
ity trait of the Big Five model.
2 METHODOLOGY
This study is focused on the analysis of the keystroke
dynamics of computer users to identify personality
traits. Keystroke dynamics is an automatic, non-
intrusive approach with a reduced cost of applica-
tion. A self-assessment questionnaire, based on the
Big Five model for describing personality traits, was
used. The objective of this study is to answer two
questions:
• Q1: Is it possible to measure how much a certain
personality trait is present in the personality of an
individual through the typing rhythm?
• Q2: Is it possible to determine which personal-
ity traits stand out in the individual’s personality
through the typing rhythm?
A dataset was acquired, pre-processed, and used
to train different neural networks to reach the objec-
tives of identifying an individual’s personality traits
from keystroke analysis. This section describes the
methodology used, divided in three steps:
1. Data acquisition
2. Pre-processing
3. Analysis
The data acquisition step was responsible for ac-
quiring the basic information for the accomplish-
ment of this study. It was done by capturing the
subjects’ keystroke data and the application of a
self-assessment personality questionnaire. In pre-
processing step, equalizations and conversions of the
obtained data were done to adapt them to each experi-
ment. In the analysis step, we trained different neural
networks to classify the individual’s keystroke data.
2.1 Data Acquisition
The data acquisition process was completely online,
aiming to be accessed by the largest possible number
of participants. It was implemented as a web page
built to extract the raw data of the participants’ typing
rhythm from a conventional computer keyboard and
then apply the Ten Item Personality Inventory (TIPI)
self-assessment questionnaire.
The web page was available for collecting data for
56 days. Of the 177 participants, 56 were female,
and 121 were male. Ages ranged between 12 and 46
years, with 24.83 years as the average age of the par-
ticipants.
The data acquisition process was divided into
three steps: contextualization; extraction of the
keystroke dynamics, and; extraction of personality
traits. Each stage is described in the sections below.
The average session length of a participant on
the data acquisition page, including contextualization,
was 11.27 minutes. Extraction of the keystroke dy-
namics and extraction of personality traits steps had
an average duration of 1.97 minutes and 1.61 min-
utes, respectively, which gives us an average duration
of 3.58 minutes to perform the two main steps of the
data acquisition process.
2.1.1 Contextualization
The first step of the data acquisition process started
with presenting the data acquisition objective, a brief
contextualization about what the next steps would be
and what should be done by the participant in the next
steps. A free consent form was presented to guarantee
that the participant understood the details about the
confidentiality of his information and that he agrees
with the purposes for which the data provided by him
in the next steps would be used. The text makes it
clear the possibility to give up at any time during the
data acquisition process.
2.1.2 Keystroke Data Extraction
After the contextualization step, the data acquisition
step effectively starts with presenting the predefined
text. Participants are instructed to type the text exactly
as shown, in a text field, twice in a row.
The text selected for data acquisition was designed
in the native language of the participants, so it was
not necessary to capitalize letters or add accents. The
text contains only a single punctuation symbol, with
a simple vocabulary composed of words common in
casual speech, with 194 characters.
All care in the text elaboration came from the
concern to reduce the discrepancies between different
users, which can be caused by the use of uncommon
words or a difficult text.
From this process, it is possible to identify a typ-
ing rhythm for each participant, composed of a set of
characteristics extracted from the keypresses during
the data acquisition process. Such characteristics are
known as hold time (H), up time (U) and down-down
ICEIS 2021 - 23rd International Conference on Enterprise Information Systems
476

time (DD). The hold time represents the duration of a
keypress; the up time represents the time elapsed be-
tween releasing the current key and pressing the next
one, and; the down-down time represents the inter-
val between pressing the current key and pressing the
next one.
2.1.3 Personality Traits Extraction
The Big Five model is a model designed to represent
an individual’s personality, having been created in
psychology, and is currently an accepted and widely
studied model. This personality representation model
classifies the personality as composed of five major
traits that determine each of the characteristics of be-
ing, thinking, and acting of an individual.
The Big Five traits are openness, agreeable-
ness, extraversion, conscientiousness, and neuroti-
cism. These five traits can be divided into six subsets
of characteristics, known as facets, to allow a more
precise and detailed personality analysis.
A standard way of extracting an individual’s per-
sonality traits is by applying a questionnaire con-
taining a series of questions to map each personal-
ity’s specific characteristics. There are different ques-
tionnaires based on The Big Five model. One of
them is the Neo-International Personality Item Pool
(NEO-IPIP), consisting of 300 questions distributed
equally among the big five traits. The participant
has to choose the answer that best suits him, among
the five available alternatives, which vary according
to the Likert scale (Likert, 1932), ranging from ”to-
tally agree” to ”strongly disagree”. Due to the num-
ber of questions that compose it, the application of
NEO-IPIP requires a large amount of time, resulting
in inaccurate answers due to the participant’s tired-
ness or even incomplete questionnaires due to partic-
ipants giving up during the process.
To reduce the amount of time required to apply
a self-assessment questionnaire, Gosling, Rentfrow,
and Sawnn (Gosling et al., 2003) developed the TIPI,
a self-assessment questionnaire derived from NEO-
IPIP and composed of only ten questions. Due to
its small size, TIPI can not extract Big Five char-
acteristics as accurately as NEO-IPIP does. How-
ever, all Big Five traits are mapped. Its application
is carried out similarly to NEO-IPIP, where the par-
ticipant must choose the answer that best suits him
from the seven available alternatives, following the 7-
point Likert scale, which vary from ”totally agree” to
”totally disagree”.
In this study, the TIPI questionnaire was used as
an approach to extract the participants’ personalities.
It was adapted to be used in the data acquisition web
page. The ten questions from the original question-
naire were presented sequentially, with their respec-
tive alternatives. The interface has just a ”next” button
to take the participant to the next question without al-
lowing him to change the previous question’s answer.
2.2 Pre-processing
The pre-processing step consists of removing irrele-
vant data, such as repeated or non-representative in-
formation, and performing transformations in the data
so that the resulting dataset is better suited for neural
network input than the original. We used the pre-
processing approach described in (Montalv
˜
ao Filho
and Freire, 2006) to equalize the keystroke data. This
approach proved to be advantageous when applied to
keystroke data for biometric identification. The equal-
ization function can be described as follows:
g(x) =
1
1 + exp(−
K(log
e
(x)−µ
y
)
σ
y
)
where K is a constant with value 1.7 and x is a time in-
terval. The normalization function maps the values of
x to a normal distribution with mean µ
y
and standard
deviation σ
y
, assuming that x follows approximately
a distribution log-normal.
2.3 Analysis
With the data obtained in the data acquisition pro-
cess, artificial neural networks were trained using the
keystroke data as input and with information about
the personality traits as output. The neural network
architectures were composed of an input layer, a hid-
den layer, and an output layer.
To classify the keystroke data, neural networks
with two different output types were trained:
• Output of seven Likert scale values, as obtained
with the TIPI questionnaire.
• Output of two values, obtained by the binariza-
tion of the results of the TIPI questionnaire. Re-
sults with values greater than or equal to 5 were
mapped to 1, while results less than 5 were
mapped to 0.
Figure 1 represents the structure of the neural net-
work used in the Likert scale approach. Figure 2, on
the other hand, represents the structure of the neural
network used in the binarized approach.
The two output formats of the neural networks are
closely related to the questions Q1 and Q2 proposed
in the beginning of this section. The neural networks
with output in the Likert scale format aim to identify
exactly how much a specific personality trait repre-
sents the individual’s personality (Q1). It can be di-
rectly compared with the result obtained through the
Mapping Personality Traits through Keystroke Analysis
477
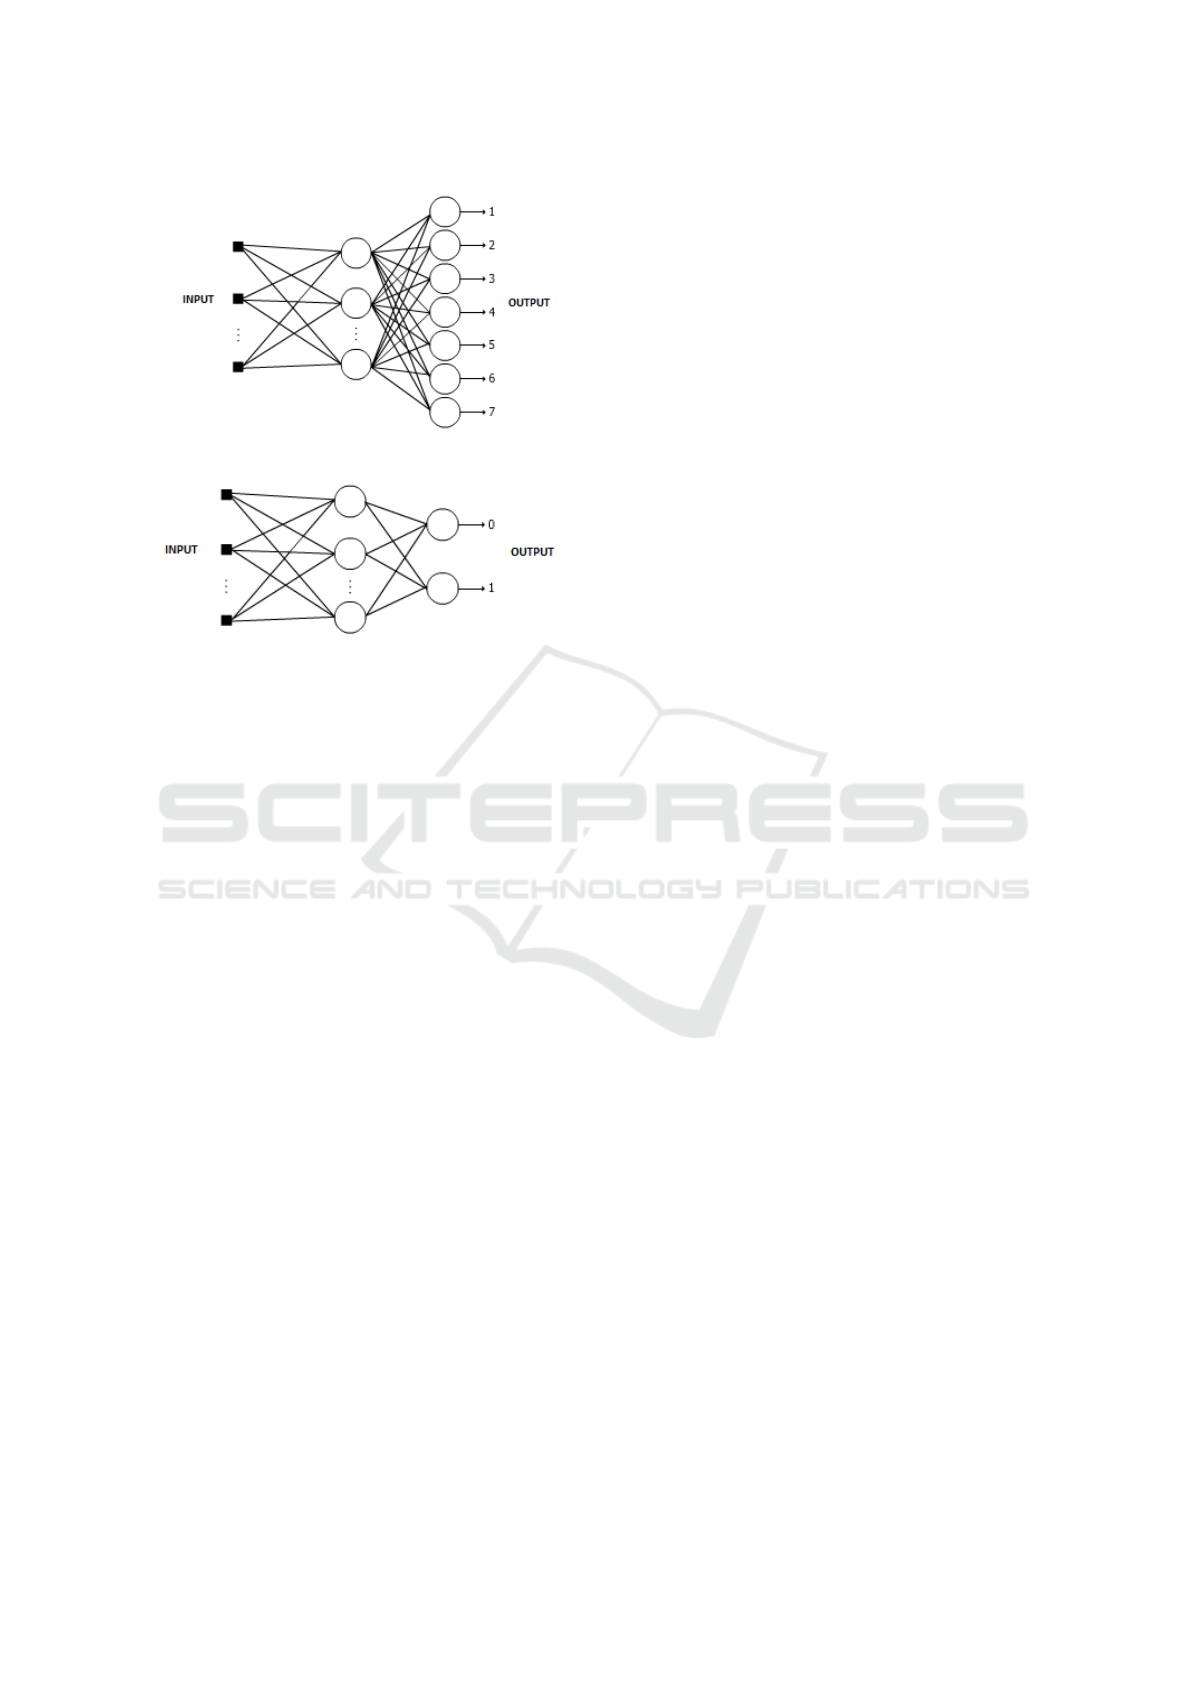
Figure 1: Structure of the neural network used in the Likert
scale approach.
Figure 2: Structure of the neural network used in the bina-
rized approach.
application of the TIPI questionnaire. The neural net-
works with binary outputs aim to identify whether a
personality trait stands out in an individual’s personal-
ity (Q2). The training and evaluation of this approach
were done with the binarized TIPI questionnaire. In
both approaches, the neural network output is consid-
ered correct when its value is equal to the value of the
TIPI questionnaire.
Raw keystroke dynamics data were used as input
to the neural networks due to a lack of a formal defi-
nition in the literature regarding the relationship of a
specific characteristic of the keystroke dynamic, such
as the typing speed, with a specific personality trait.
Raw data were used as input in order to the neural net-
work define by itself which characteristics are most
relevant for each personality trait. As an alternative
to the raw keystroke data, the equalized input data,
pre-processed as described in Subsection 2.2 was also
used.
The acquired keystroke data was used in three dif-
ferent ways as the input of the network: only the hold
time data; only the down-down time, and; the com-
bination of hold time and down-down time data si-
multaneously. During the data acquisition process,
376 time intervals were extracted from the keyboard
events, 188 of them referring to hold time and 188
referring to up time. The down-down time intervals
were calculated from these two vectors, also com-
posed of 188 time intervals.
Twelve different experiments were done. The ex-
periments are defined by all combinations of three in-
put types, two output types, and the use or not of the
equalization method. In each experiment, five neural
networks were trained, one for each personality trait,
i.e. each trait was analyzed individually by its respec-
tive neural network.
The experiments were performed by applying the
data to multilayer neural networks with similar ar-
chitecture but with the number of inputs and outputs
varying according to the data being used. The number
of neurons in the middle layer is the same as the num-
ber of inputs. From the 177 participants in the data
acquisition step, 85 were used in the neural network
training process, 46 were used for the validation step,
and 46 for the testing step.
3 RESULTS
The experiments presented in this work were carried
out using the input data selected in the neural network,
and comparing them with the expected output for each
of the inputs.
3.1 Likert Scale Experiments
The Likert scale (Likert, 1932) is a type of scale
where the interviewees must specify their level of
agreement with a statement, having been developed
specifically for psychometric questionnaires. It can
be presented in the format of three, five, or seven
points. In this study, seven points were used, that is,
each question has seven answer options, as this is the
standard adopted in the development of the TIPI ques-
tionnaire.
Data equalization was performed following the
method described by (Montalv
˜
ao Filho and Freire,
2006), a method used in biometric analyses aimed
at authentication purposes. As it has shown good re-
sults, it was decided to use the same approach in order
to compare the results obtained by the experiments
with and without the application of the equalization
method. However, as stated by (Montalv
˜
ao Filho and
Freire, 2006) in their study, equalization approaches
in conjunction with neural networks can be consid-
ered redundant given that, due to its learning process,
the neural networks equalize the input data. The ap-
plication of the equalization method was carried out
using mean (µ) 128.4094 and standard deviation (σ)
842.9373.
Figure 3 shows a comparison of the results ob-
tained in all the experiments carried out following the
approach with the Likert scale.
In the literature, the down-down time is consid-
ered the characteristic of the typing rhythm that car-
ries the greatest amount of information about the in-
ICEIS 2021 - 23rd International Conference on Enterprise Information Systems
478
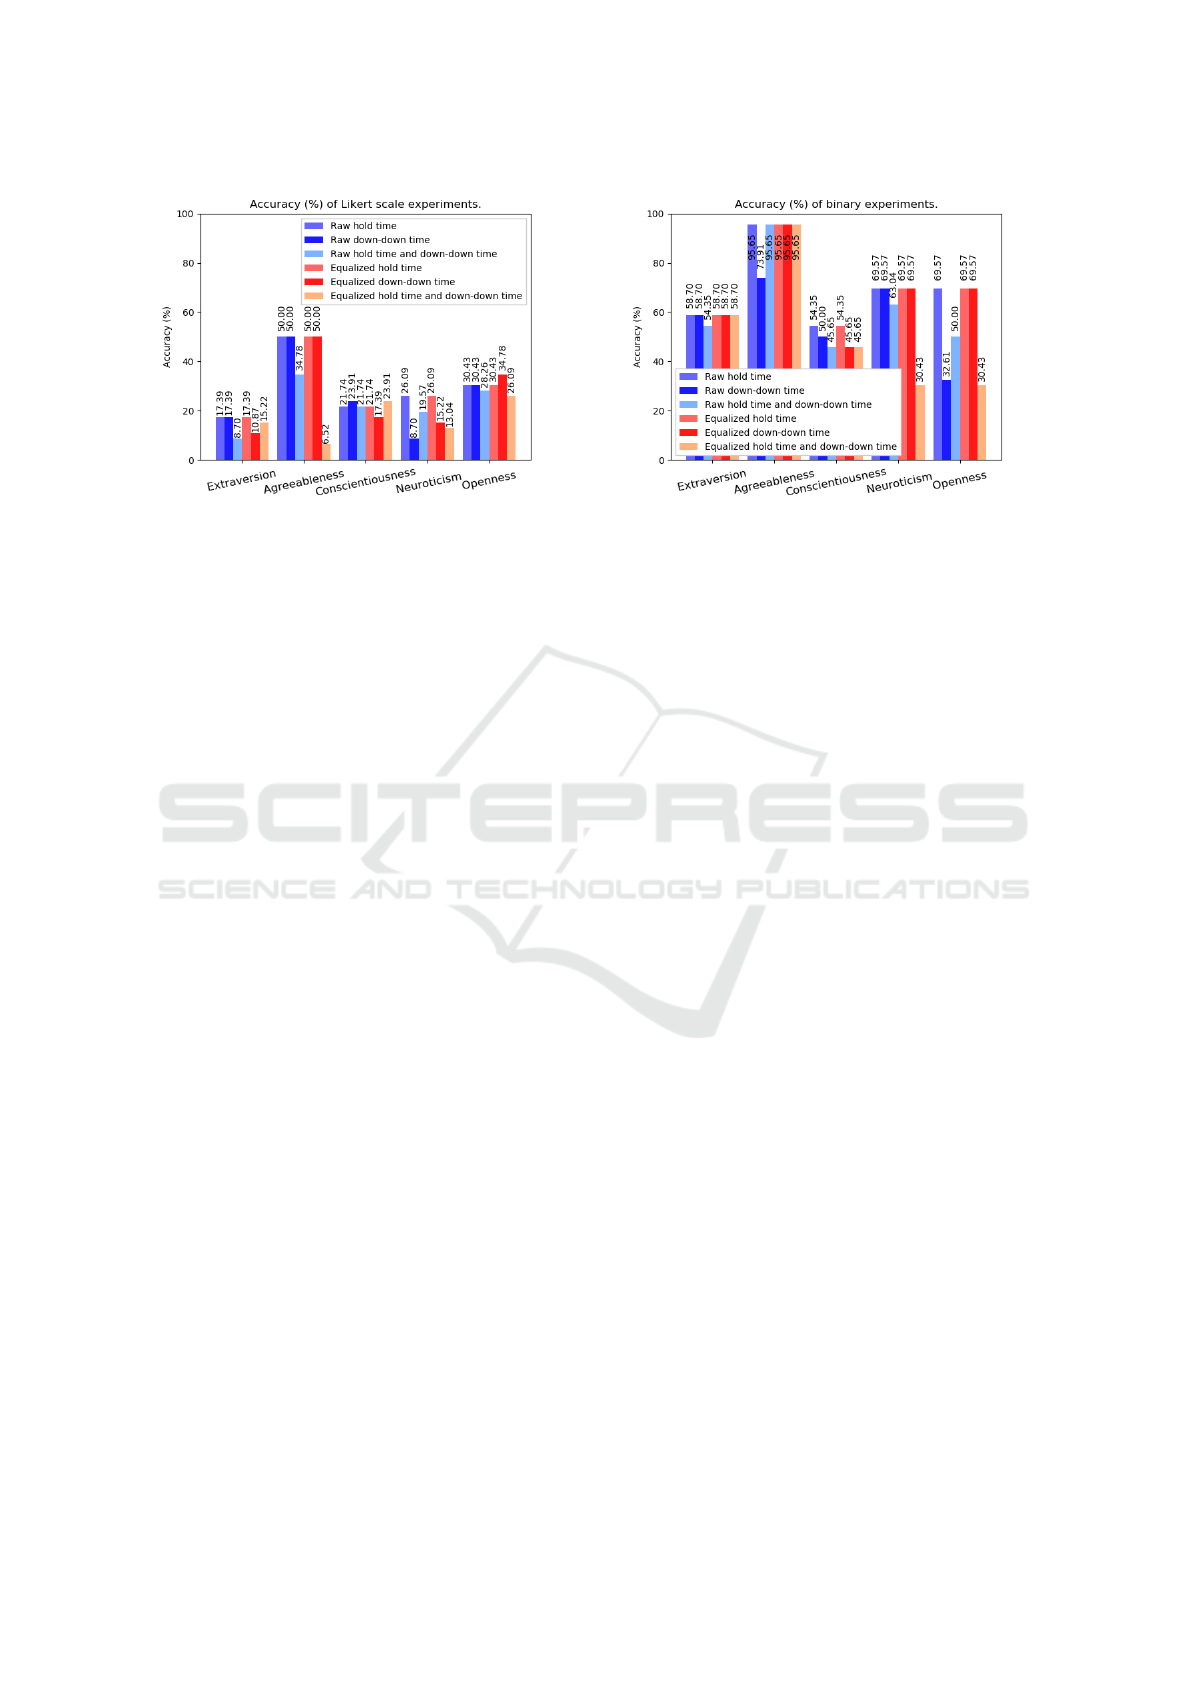
Figure 3: Accuracy (%) of Likert scale experiments.
dividual. For this reason, the down-down time was
extracted together with the other characteristics of the
typing rhythm (hold time and up time), in order to
provide the neural network with as much information
as possible with the minimum necessary characteris-
tics. Figure 3 shows a comparison between the equal-
ized approach and the non-equalized approach, using
data from the down-down time, where the results ob-
tained varied between 8.70% and 50%.
From the analysis of all the results obtained by the
neural network approaches with output on the Likert
scale, presented in the Figure 3, it was observed that
the success rates varied between 6.52% and 50%, with
an average of 24.60% of correct answers, which is un-
satisfactory for the prediction of how much a person-
ality trait is present in an individual’s personality.
3.2 Binary Experiments
Neural networks with binary outputs were developed
to identify which personality traits stand out in an in-
dividual’s personality. The binary approach allows a
clearer identification of which personality traits stand
out in a specific individual’s personality, thus allow-
ing the network to predict which personality traits
are in evidence in a given personality. In this stydy,
traits classified with a value greater than or equal to
5, according to the 7-point Likert scale, are consid-
ered present (1), and traits with values less than 5 are
considered absent (0).
Even with accuracies reaching 95.65%, it cannot
be said with certainty that the hold time input with
binary scale output approach, shown in Figure 4, is
capable of indicating whether the personality traits
studied are likely to be mapped through the binary
approach, that is, to determine whether or not a per-
sonality trait is highlighted in an individual’s person-
ality, without first validating the results obtained in
conjunction with the analysis of the probability distri-
Figure 4: Accuracy (%) of binary experiments.
bution between the classes used in this approach.
Figure 4 shows the accuracies for each of the ex-
periments carried out through the application of the
binary approach, with results between 30.43% and
95.65%. With accuracies above 95%, as shown by
the personality trait agreeableness in the Figures 4,
the binary approaches in general presented accuracies
considered high in a preliminary analysis.
However, when compared with the probability
distribution of the analyzed classes, presented in Sec-
tion 3.3, we can conclude that the results obtained
are unsatisfactory as it is evident that the same result
could be achieved by a classifier guessing the most
frequent class. Thus, to verify how significant the
results obtained are, it was decided to perform addi-
tional tests, presented in Section 3.3.
3.3 Prior Knowledge Analysis
To validate the neural networks’ results, we carried
out an additional experiment to compare them with an
approach using prior knowledge. In the prior knowl-
edge approach, the probability distribution of the an-
alyzed classes is known, as shown in Figure 5 and
Figure 6.
This analysis was performed with each of the out-
put types produced by neural networks (Likert scale
and binary), in order to identify which of the possi-
ble outputs is the most repeated (mode) in the train-
ing set of each approach, and then use that answer as
the only answer to predict the test set data. Thus, the
aim is to prove that the experiments developed using
neural networks do not perform better than a purely
statistical approach, and these results are not relevant
enough to predict an individual’s personality traits.
Figure 7 and Figure 8 illustrate the results ob-
tained when comparing these experiments. Figure 7
and Figure 8 show that, although some of the results
obtained by neural networks are superior to those of
Mapping Personality Traits through Keystroke Analysis
479
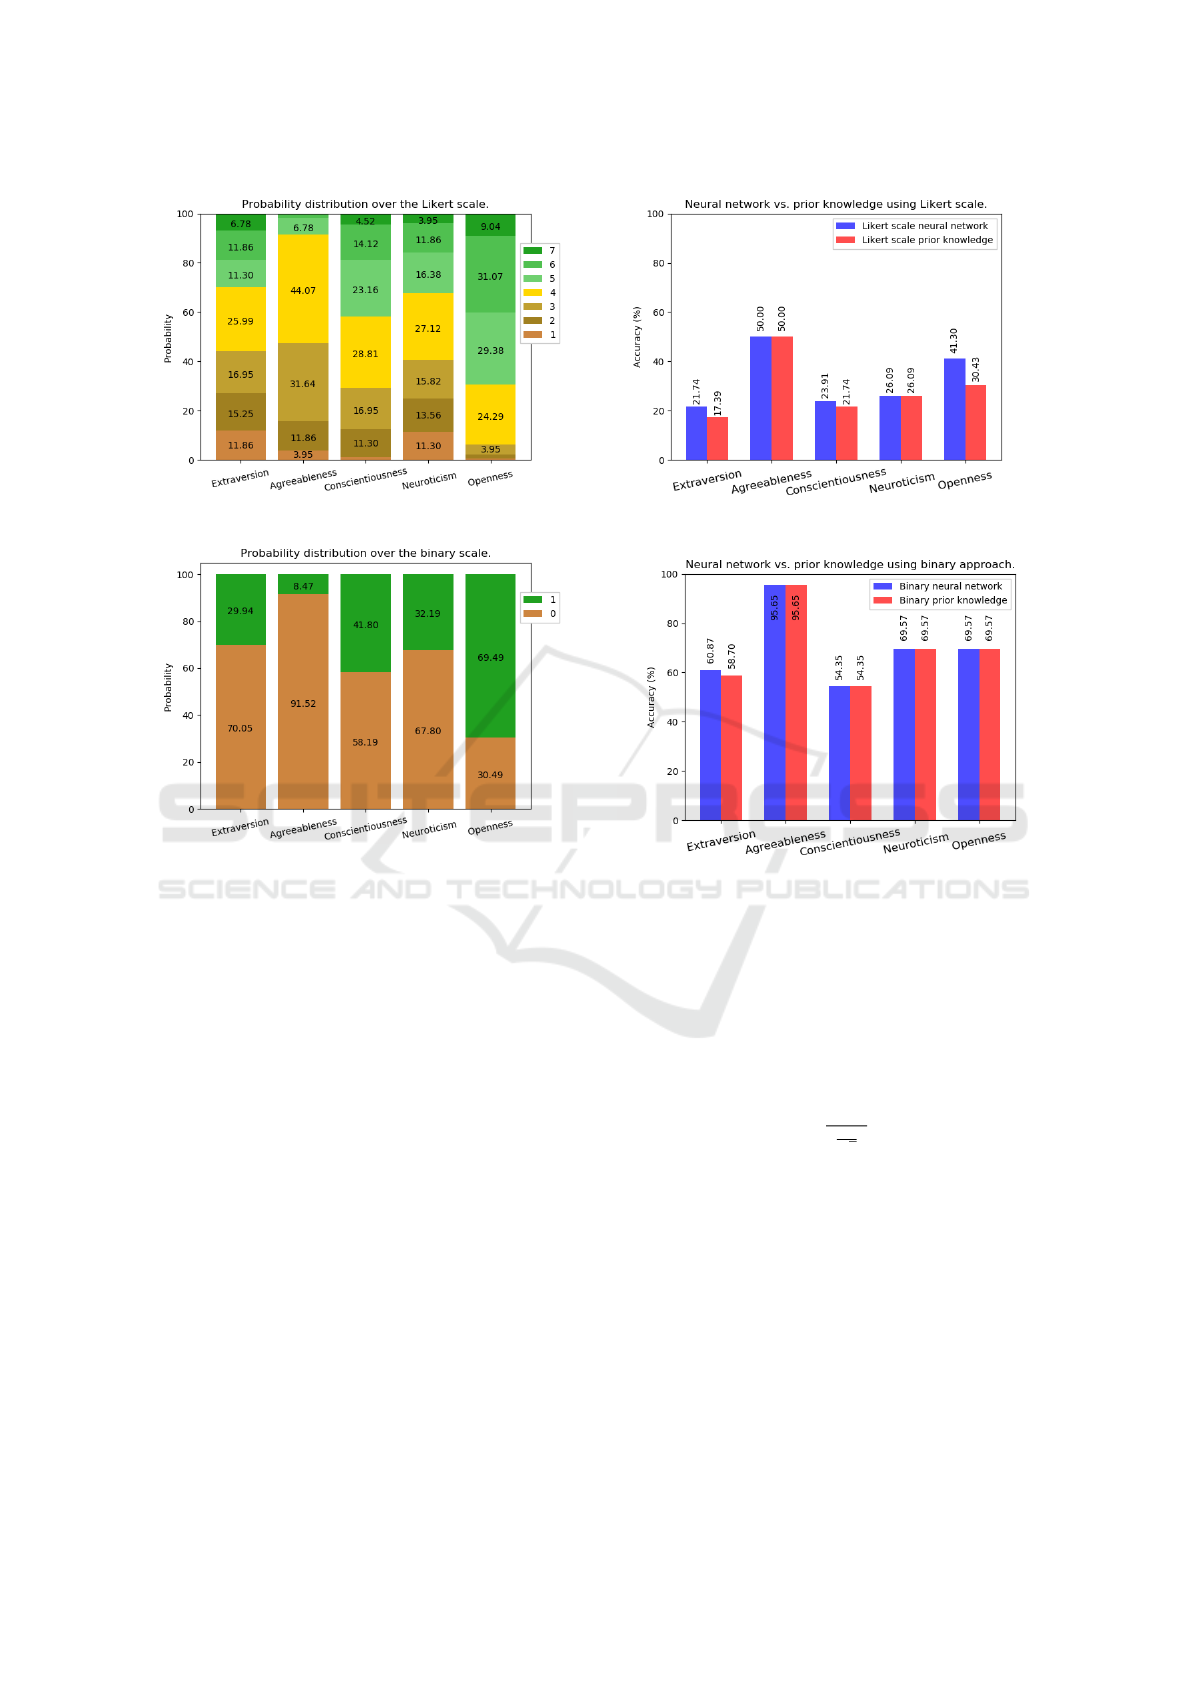
Figure 5: Probability distribution over the Likert scale.
Figure 6: Probability distribution over the binary scale.
analysis with prior knowledge, it is not possible to
safely say that neural networks are capable of infer-
ring the personality of an individual.
3.4 Hypothesis Testing
A series of hypothesis tests were done to verify the
reliability of the results obtained. One test for each
personality trait was done to confirm that the results
are unsatisfactory to predict an individual’s personal-
ity traits through keystroke dynamics characteristics.
Hypothesis testing is a statistical method for an-
alyzing samples through the theory of probabilities.
In order to perform a hypothesis test it is necessary
to have two hypotheses, known as (i) null hypoth-
esis (H
0
); and (ii) alternative hypothesis (H
1
). The
null hypothesis is the hypothesis that we assume to be
true, while the alternative hypothesis is the hypothe-
sis that will be considered true if the null hypothesis
is rejected.
In a hypothesis test, two types of errors can oc-
cur. Type I error is the rejection of the null hypothesis
(H
0
) when it is actually true. On the other hand, Type
II error is the failure to reject a false null hypothe-
Figure 7: Neural network vs. prior knowledge using Likert
scale.
Figure 8: Neural network vs. prior knowledge using binary
approach.
sis (H
0
). Our null hypothesis (H
0
) states that an ap-
proach based on neural networks is as or less effective
than choosing the most likely result, while our alter-
native hypothesis (H
1
) states that an approach based
on neural networks is more effective than choosing
the most likely outcome. The following formula was
used to perform the hypothesis tests:
z =
a −b
σ
√
n
(1)
where a represents correct classifications by the neu-
ral network, b represents the correct classifications by
the approach with prior knowledge, both expressed in
the number of people, n represents the size of the test
population, and σ represents the population standard
deviation.
The hypothesis test was built with a 5% signifi-
cance level, using the Equation 1, which is a unilat-
eral hypothesis test on the right, in order to prove that
the alternative hypothesis (H
1
) is true. For a hypoth-
esis test with these characteristics, the critical region
regarding the level of significance is represented by
ICEIS 2021 - 23rd International Conference on Enterprise Information Systems
480
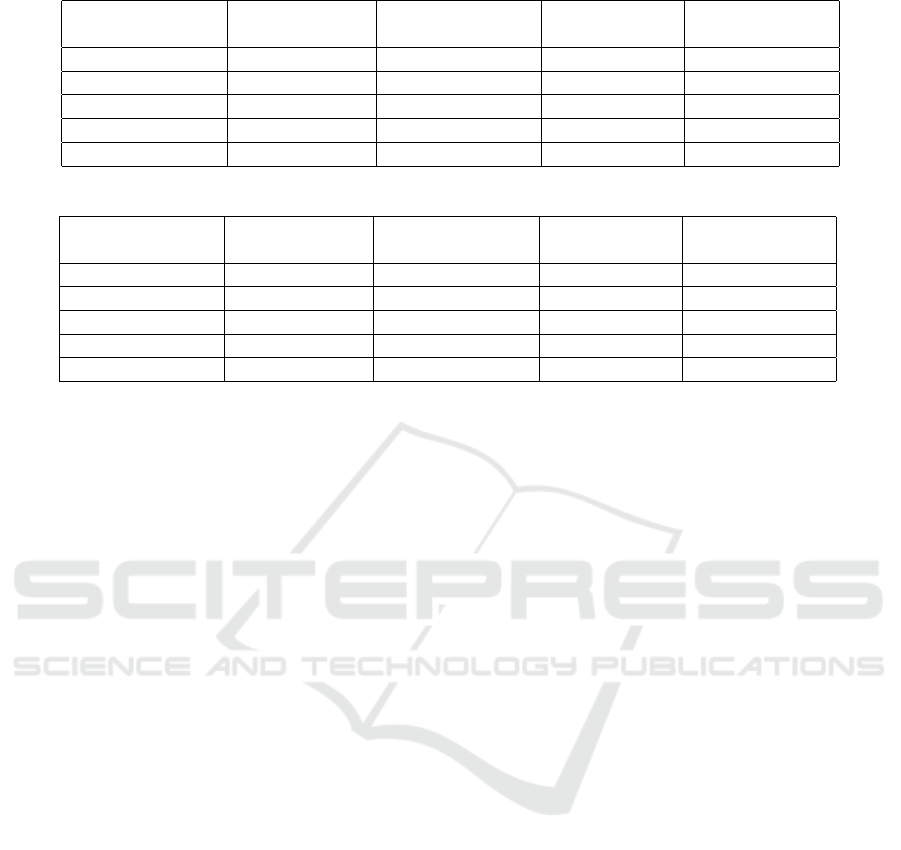
Table 1: hypothesis testing of Likert scale experiments.
Personality trait Neural network
result (a/n)
Average expected
output (b/n)
Standard devi-
ation (σ)
Hypothesis test-
ing result (z)
Extraversion 17.39% 17.39% 2.57 0.00
Agreeableness 50.00% 60.87% 3.39 -10.00
Conscientiousness 23.91% 23.91% 2.80 0.00
Neuroticism 26.09% 21.74% 2.98 4.55
Openness 34.78% 34.78% 3.12 0.00
Table 2: Hypothesis testing of binary approach experiments.
Personality trait Neural network
result (a/n)
Average expected
output (b/n)
Standard devi-
ation (σ)
Hypothesis test-
ing result (z)
Extraversion 58.70% 58.70% 3.34 0.00
Agreeableness 95.65% 82.61% 1.38 29.48
Conscientiousness 54.35% 54.35% 3.38 0.00
Neuroticism 69.57% 60.87% 3.12 8.69
Openness 69.57% 69.57% 3.12 0.00
z > 1.64. Thus, for the alternative hypothesis to be
considered true, that is, to reject the null hypothesis,
the result obtained through the hypothesis test, repre-
sented by z, must be greater than 1.64.
Table 1 shows the hypothesis tests performed with
the Likert scale approach, and Table 2 shows the hy-
pothesis tests performed with the binary approach.
The tables present the resulting z values obtained
through the hypothesis tests performed for each ap-
proach. To perform the hypothesis tests, we used the
same test set used for evaluating the neural networks,
with size n = 46. The results shown in the column
”neural network result” refer to the best results (high-
est accuracy) of the approach in detecting the person-
ality trait in question.
Analyzing the result of the hypothesis tests, repre-
sented by the column z in the tables 1 and 2, we can
see that only three of them obtained a result inside the
critical region, i.e., z > 1.64. In the other seven tests,
the z is outside the critical region, so we do not reject
the null hypothesis, which states that neural networks
are no better than the a priori approach with a confi-
dence of 95%. The characteristics extracted from the
keystroke dynamics probably do not present enough
information to map an individual’s personality traits.
The similarity between the results obtained through
an approach based on the choice of the most likely
personality trait and an approach based on neural net-
works is evidenced by the number of tests with z equal
to zero.
4 CONCLUSIONS
In this study, 12 different experiments were carried
out to search for the relationship between an indi-
vidual’s typing rhythm and his personality traits. A
dataset was acquired with the keystroke dynamics
data extracted from 177 volunteers and the person-
ality traits of each one. A data acquisition tool was
developed specifically for this study and was made
available online. The experiments were designed to
answer two different questions. Q1: Is it possi-
ble to measure how much a given personality trait
is present in an individual’s personality through the
typing rhythm? And Q2: Is it possible to determine
which personality traits stand out in the individual’s
personality through the typing rhythm?
Experiments aimed at answering question Q1
measured the personality traits’ intensity in a 7-point
Likert scale for each participant. The best neural net-
work classifiers resulted in the following accuracies
for each personality trait: extraversion 17.39%; agree-
ableness 50.00%; conscientiousness 23.91%; neuroti-
cism 26.09%, and; openness 34.78%.
In the experiments aimed at answering question
Q2, a binary approach was used. The objective of
the experiments was to identify whether or not a per-
sonality trait is present in an individual’s personality.
So, the results in Likert scale were binarized. Values
greater or equal to 5 were mapped to 1; otherwise,
they were mapped to 0. The binary experiments re-
sulted in higher accuracies than the Likert scale exper-
iments: extraversion 60.87%; agreeableness 95.65%;
conscientiousness 54.35%; neuroticism 69.57%, and;
openness 69.57%. However, the improvement ob-
Mapping Personality Traits through Keystroke Analysis
481

served is due to the reduction in the number of classes
analyzed from seven to two, resulting in higher accu-
racies. Even so, the results obtained by this approach
are equivalent to those from the approach with prior
knowledge.
Finally, when analyzing the results obtained, we
concluded that it was not possible to identify an in-
dividual’s personality traits from the typing rhythm
using the approaches described in this work. The ex-
clusive use of keystroke dynamics characteristics may
not provide enough information to map the personal-
ity traits of an individual.
Even knowing the limitations of a conventional
computer keyboard, as a source of information on
characteristics capable of differentiating individuals
from each other, the usage of the keyboard as an ap-
proach is encouraged by Solanki and Shukla (Solanki
and Shukla, 2014), Nahin (Nahin et al., 2014) and Ko-
lakowska (Kołakowska et al., 2013). They confirm
the benefits of using the typing rhythm from a con-
ventional computer keyboard, which is inexpensive
and already widely used in most computer systems,
in addition to being a non-intrusive approach and eas-
ily adaptable to different computer systems, including
smartphones with touchscreens.
Due to the unsatisfactory results on extracting per-
sonality traits, we believe that it is not possible to
clearly map an individual’s personality traits through
the keystroke dynamics. On the other hand, we be-
lieve in the possibility of success in the development
of studies aimed at new approaches and experiments
focused on mapping information with a greater rela-
tionship with human motor functions, such as emo-
tions and emotional state, as presented by Zimmer-
mann (Zimmermann et al., 2003). Such work can be
performed using an adaptation of the data acquisition
tool already developed, using the same data acquisi-
tion process, adapting only the self-assessment ques-
tionnaire to map emotions and emotional states.
REFERENCES
Allport, G. W. (1961). Pattern and growth in personality.
Buker, A. A., Roffo, G., and Vinciarelli, A. (2019). Type
like a man! inferring gender from keystroke dynamics
in live-chats. IEEE Intelligent Systems, 34(6):53–59.
Carver, C. S. Scheier, M. F. (2000). Personality is a dy-
namic organization, inside the person, of psychophys-
ical systems that create the person’s characteristic pat-
terns of behavior, thoughts and feelings.. (Boston).
Perspectives on personality.
Epp, C., Lippold, M., and Mandryk, R. L. (2011). Identi-
fying emotional states using keystroke dynamics. In
Proceedings of the sigchi conference on human fac-
tors in computing systems, pages 715–724.
Gosling, S. D., Rentfrow, P. J., and Swann Jr, W. B. (2003).
A very brief measure of the big-five personality do-
mains. Journal of Research in personality, 37(6):504–
528.
Khan, I. A., Brinkman, W.-P., Fine, N., and Hierons, R. M.
(2008). Measuring personality from keyboard and
mouse use. pages 1–8.
Khan, I. A., Khalid, O., Jadoon, W., Shan, R. U., and Nasir,
A. N. (2015). Predicting programmers’ personality
via interaction behaviour with keyboard and mouse.
PeerJ PrePrints, 3:e1183v1.
Khanna, P. and Sasikumar, M. (2010). Recognising emo-
tions from keyboard stroke pattern. International jour-
nal of computer applications, 11(9):1–5.
Kołakowska, A., Landowska, A., Szwoch, M., Szwoch, W.,
and Wr
´
obel, M. R. (2013). Emotion recognition and
its application in software engineering. pages 532–
539.
Likert, R. (1932). A technique for the measurement of atti-
tudes. Archives of psychology.
Montalv
˜
ao Filho, J. R. and Freire, E. O. (2006). On the
equalization of keystroke timing histograms. Pattern
Recognition Letters, 27(13):1440–1446.
Nahin, A. N. H., Alam, J. M., Mahmud, H., and Hasan, K.
(2014). Identifying emotion by keystroke dynamics
and text pattern analysis. Behaviour & Information
Technology, 33(9):987–996.
Nunes, M., Bezerra, J. S., Reinert, D., Moraes, D., Silva,
´
E. P., and Pereira, A. J. (2010). Computac¸
˜
ao afetiva
e sua influ
ˆ
encia na personalizac¸
˜
ao de ambientes edu-
cacionais: gerando equipes compat
´
ıveis para uso em
avas na ead. Educac¸
˜
ao E Ciberespac¸o: Estudos, Pro-
postas E Desafios. Aracaju: Virtus Editora, 1:308–
347.
Pervin, L. A., Cervone, D., and John, O. P. (2004). Person-
ality: Theory and Research. Wiley, 9th edition.
Plank, B. (2018). Predicting authorship and author traits
from keystroke dynamics. In Proceedings of the Sec-
ond Workshop on Computational Modeling of Peo-
ple’s Opinions, Personality, and Emotions in Social
Media, pages 98–104.
Shepherd, S. (1995). Continuous authentication by analysis
of keyboard typing characteristics.
Solanki, R. and Shukla, P. (2014). Estimation of the user’s
emotional state by keystroke dynamics. International
Journal of Computer Applications, 94(13).
Stathopoulou, I.-O., Alepis, E., Tsihrintzis, G. A., and
Virvou, M. (2010). On assisting a visual-facial af-
fect recognition system with keyboard-stroke pattern
information. Knowledge-Based Systems, 23(4):350–
356.
Zimmermann, P., Guttormsen, S., Danuser, B., and Gomez,
P. (2003). Affective computing—a rationale for mea-
suring mood with mouse and keyboard. Interna-
tional journal of occupational safety and ergonomics,
9(4):539–551.
ICEIS 2021 - 23rd International Conference on Enterprise Information Systems
482
