
Immersive UX: A UX Evaluation Framework for Digital Immersive
Experiences in the Context of Entertainment
Franciane Alves
a
, Brenda Aguiar
b
, Vinicius Monteiro
c
, Elizamara Almeida
d
,
Leonardo Marques
e
, Bruno Gadelha
f
and Tayana Conte
g
Instituto de Computac¸
˜
ao, Universidade Federal do Amazonas, Manaus, Amazonas, Brazil
Keywords:
UX, Immersive Experience, Entertainment, Flow, Presence, Engagement, Digital Experience.
Abstract:
Digital Immersive Entertainment attracts thousands of people worldwide and can awaken new feelings and
sensations in those who experience it. However, there is no standardized way of evaluating User eXperience
(UX) and which UX measures should be considered in this context to determine whether the immersive ex-
perience was enjoyable and engaging for the audience. After considering how to evaluate the user experience
in the context of immersive entertainment, we developed the Immersive UX, a UX evaluation framework
considering important UX measures related to the evaluation of the immersive experience. In this sense, we
based our framework on evaluating the following UX measures: flow, presence, and engagement. We carried
out a study to investigate our framework’s feasibility by using it in a UX evaluation. This study examines
how users felt when participating in a simulated cinema experience where they interacted with other people
using different systems to support the immersive experience. We observed that our framework was able to
capture what users feel when going through a systems-driven experience to support immersion. We were able
to investigate users’ expectations and satisfaction, which allowed us to analyze whether the user’s immersive
experience guided by digital systems was positive or not.
1 INTRODUCTION
User eXperience (UX) has attracted interest in recent
years (Pettersson et al., 2018). This interest may be
related to the fact that usability limitations have be-
come more visible as interest and investigations re-
garding UX have become more evident (Law et al.,
2009). According to Russo et al. (2015), in the past,
the systems were intended to provide useful and us-
able functionality, and today, they try to involve users
in positive and engaging experiences. In this sense,
UX evaluation has become an important activity to
assess the quality of the products, aiming to identify
improvement opportunities and meet consumers’ ex-
pectations (Nakamura. et al., 2020). This change in
focus has caused a growth in studies involving the UX
a
https://orcid.org/0000-0001-7304-2779
b
https://orcid.org/0000-0002-4794-4557
c
https://orcid.org/0000-0002-4983-3260
d
https://orcid.org/0000-0002-9344-940X
e
https://orcid.org/0000-0002-3645-7606
f
https://orcid.org/0000-0001-7007-5209
g
https://orcid.org/0000-0001-6436-3773
evaluation (M
¨
uller et al., 2016).
The change in the systems’ goals has also caused
changes in the paradigms of interaction, allowing the
emergence of applications focused on immersive en-
tertainment (Marques et al., 2020; Lee et al., 2020).
This type of entertainment can be made possible by
immersive technologies or interactive applications,
which reduce the boundaries between the physical,
virtual, and simulated worlds, which allow users to
experience a sense of immersion (Suh and Prophet,
2018).
However, the emergence of interactive applica-
tions has brought new challenges. For example, the
understanding of how interactions with this kind of
applications occur in practice is still limited (Halskov
et al., 2014). Marques et al. (2020) argue that it is
necessary to investigate how to evaluate the quality of
the interaction provided by this type of applications.
In order to investigate how to evaluate the UX
of digital immersive entertainment, we conducted an
empirical study where users were immersed in an ex-
perience that simulated a cinema. To assess each
user’s experience, we developed a method based on
the Expectation-Confirmation Theory (ECT) (Oliver,
Alves, F., Aguiar, B., Monteiro, V., Almeida, E., Marques, L., Gadelha, B. and Conte, T.
Immersive UX: A UX Evaluation Framework for Digital Immersive Experiences in the Context of Entertainment.
DOI: 10.5220/0010455305410548
In Proceedings of the 23rd Inter national Conference on Enter prise Information Systems (ICEIS 2021) - Volume 2, pages 541-548
ISBN: 978-989-758-509-8
Copyright
c
2021 by SCITEPRESS – Science and Technology Publications, Lda. All rights reserved
541

1980). Following the ECT model, we developed ob-
servation metrics based on Flow, Presence, and En-
gagement, which are important UX attributes and are
described in the next section.
Furthermore, we developed two questionnaires,
one for expectation and the other for satisfaction. Our
results showed that the observation metrics allowed
us to collect valuable data about the users’ digital im-
mersion experience. Through the questionnaires, we
were able to understand the reasons that explain the
users’ behavior observed during the empirical study.
In this sense, our framework can be considered an ap-
proach to evaluate UX in an innovative context, as in
immersive experiences guided by digital systems.
2 BACKGROUND
UX includes various elements of what a user expe-
riences before, during, and after interacting with a
product (Oyedele et al., 2018). Moreover, UX is asso-
ciated with a broad range of fuzzy and dynamic con-
cepts (Law et al., 2009). In this sense, there are sev-
eral and different definitions of UX in the literature.
However, many researchers agree with the ISO 9241-
210 definition: “The user’s perception and responses
resulting from the use of a system or a service.”
According to Tcha-Tokey et al. (2016), there are
differents UX measures to evaluate immersive expe-
riences. In this paper, we focus on the flow, presence,
and engagement as UX measures since these mea-
sures are related to the digital immersive experience
context (Suh and Prophet, 2018; Tcha-Tokey et al.,
2016).
Csikszentmihalyi (1991) introduced the concept
of flow and defined it as “the holistic sensation that
people feel when they act with total involvement.
During the state of flow, people are immersed in an
activity, fully control their actions, center their focus
of awareness, as well as lose their self-consciousness
and the sense of time passing (Huang et al., 2011).
Presence is defined as “the user’s sense of being
there” (Tcha-Tokey et al., 2016), and its concept can
be grouped into two categories: physical presence and
social presence (Pallot et al., 2013). In this study, due
to our research context, we adopted the concept of so-
cial presence as our concept of presence. The social
presence theory is related to the users’ feeling of hav-
ing another person involved in the same interaction
(Pallot et al., 2013).
Engagement is “the state of consciousness where
a user is completely immersed in and involved in the
activity at hand” (Ren, 2016). Engagement is nec-
essary to maintain the meaningfulness and efficiency
of the interaction occurring between computers and
users (Goethe et al., 2019). According to Shin (2019),
the three main measures widely used to describe en-
gaging experiences are immersion, flow, and pres-
ence. In this sense, the Shin’s definition of immersion
is strictly related to the definition presented at the be-
ginning of the paragraph (Ren, 2016). Based on the
results of these researches, here, we see engagement
as a result of the level of those three measures.
2.1 The ECT Model
Expectation-Confirmation Theory (ECT) was initially
proposed by Oliver (1980), originally in Marketing
field (Chou et al., 2012). However, the ECT model
has also been used in the context of Information Sys-
tems (IS), to examine cognitive beliefs and the effects
that influence the intention to continue using (contin-
uance) IS (Bhattacherjee, 2001). ECT has five con-
structs: expectation, performance, confirmation, sat-
isfaction, and repurchase intention (Oliver, 1980).
Since we are interested in evaluating immersive
experiences through digital systems, we based our
framework on the ECT Model. We adapted the ECT
Model to fit in our context. Whereas confirmation and
repurchase intention are not objects of assessment in
the context of digital experience, we used only three
constructs of the ECT Model: (i) expectation, which
refers to the condition of those who expect an event,
in our case what the person expects from the immer-
sive experience; (ii) performance, which refers to a
person’s perceptions about the real performance of an
event, that is, what is provided by the product or ser-
vice; (iii) satisfaction, which is the measure of the
pleasure obtained after using a product. Here, satis-
faction is related to the moment after the immersive
experience and is strongly linked to the person’s ex-
pectations before the experience.
2.2 Related Work
Due to the recent technological advancements, im-
mersive experiences are most related to the experi-
ences provided by immersive technologies such as
Virtual Reality (VR) technology (Suh and Prophet,
2018). However, immersive experiences do not refer
only to experiences intermediated by VR technolo-
gies.
For instance, (H
¨
akkil
¨
a et al., 2014) explored how
to enable interaction with content in the context of
3D cinema by employing a mobile phone. They were
particularly interested in the UX of the interactive 3D
cinema concept and how different elements and in-
teraction techniques are perceived. The viewers used
ICEIS 2021 - 23rd International Conference on Enterprise Information Systems
542

their devices to retrieve information about the artist.
The results showed, among other aspects, that the
interactive content must not only be linked to the real
content of the video, but also integrated into contexts
in which it does not cause conflict with the immersive
experience with the movie. In this paper, we propose
a similar cinema immersive experience. However, our
goal is to investigate how to evaluate the overall UX
in the context of immersive entertainment.
This way, we proposed a framework called Im-
mersive UX and carried out a study to verify its feasi-
bility. We present the framework in the next section.
3 IMMERSIVE UX FRAMEWORK
To understand the user’s behavior in relation to the
immersive experiences, we aimed to investigate the
main stages of the experience. In this sense, the ECT
Model helped in the construction of our framework.
We have established three steps based on three con-
structs of the ECT model (see section 2.1). The first
stage we call expectation. The second stage refers to
when the user is experiencing immersion, called per-
formance. The third stage is the assessment of user
satisfaction with the proposed experience.
To obtain data for each stage of the framework,
we have developed different ways of collecting user
data. For the expectation and satisfaction stages, we
developed two different questionnaires. In the perfor-
mance stage, considering that users cannot be inter-
rupted because they are immersed in the experience,
data is collected through observation. In the satisfac-
tion stage, we collect data related to the three UX
measures (flow, presence, and engagement) used to
evaluate the immersive digital experience (see Section
2).
We made a Technical Report (TR) (Alves. et al.,
2021) to complement this paper since we have page
limitations. The TR contains both the questionnaires
of expectation and satisfaction. Besides the question-
naires, the raw data of the study are available in the
TR (Alves. et al., 2021).
In the expectation stage, we developed a question-
naire with eight questions (Alves. et al., 2021). This
stage aims to capture the user profile and their affin-
ity with the digital systems necessary to perform the
immersive experience that is being proposed. The
first seven questions are closed, with predefined an-
swer options. However, in question 8, we use an open
question so that the participant would provide their
expectations.
During the observation stage, we highly recom-
mend using the observation technique that best suits
the evaluation context. The most important aspect of
this stage is to observe the users’ attitudes and interac-
tions that can help understand the UX measures eval-
uated to determine if the immersive digital experience
was pleasant. For example, conversations between
users can indicate the presence, just as concentration
moments can indicate a reasonable flow rate.
Finally, in the satisfaction stage, we have the main
questionnaire aiming at assessing the indicators of the
users’ experience. The questionnaire comprises 13
questions (Alves. et al., 2021). The first 12 questions
are closed and we designed them to extract informa-
tion about each UX measure. Each question has a
score, shown in greater detail in subsection 3.1. The
question 13 is open, so that the participant may leave
a compliment, critic or suggestion related to the im-
mersive experience.
3.1 Scoring
The satisfaction questionnaire (Alves. et al., 2021)
is composed of four questions for each UX measure-
ment used for the evaluation (flow, presence and en-
gagement). The questions have different answer op-
tions. Each option has a related score ranging from
0 to 4 points. Table 1 shows the values for each re-
sponse. According to Table 1, the score of the UX
measurements were constructed as follows:
(i) the alternatives selected by the participants are
added together with the result and assigned to the
measurement of UX that the questionnaire’s question
represents.
(ii) each UX measurement may reach a maximum
score of 16 points. This amount of points is obtained
when one takes the highest score (i.e., 4) and multi-
plies by the amount of questions that represent a mea-
surement of UX (which is also equal to 4).
(iii) the maximum score that a questionnaire can
achieve by being completely answered is equal to 48
points. This total is the result of the 3 measurements
of UX multiplied by the maximum 16 points of each
measurement.
(iv) the number of participants is defined by a vari-
able N. If all participants marked the maximum val-
ues, in all alternatives, the value that a session would
reach can be obtained by multiplying the value of N
by the maximum possible score, i.e., 48.
N ∗ 48 (1)
(v) the maximum score that a measure (PM) can re-
ceive is the multiplication of the number of partici-
pants (N) by the maximum 16 points of each mea-
surement of UX, therefore:
PM = N ∗ 16 (2)
Immersive UX: A UX Evaluation Framework for Digital Immersive Experiences in the Context of Entertainment
543

For visualization of these data, we use radar graphs
to represent the UX measurements, and their respec-
tive values thus forming a triangle. To analyze this
graph, we interpret it as follows. The outermost point
of the triangle represents the maximum score that a
measure can obtain. In contrast, the satisfaction ques-
tionnaire’s participants’ points are the most innermost
in the triangle.
The closer to the outer triangle indicates the par-
ticipants felt more immersed in the experience. An
example of the radar graphs can be found in the Fig-
ure 1.
Table 1: Scoring table.
Ux Measure Q1 Q2 Q3 Q4
Flow
a - 4
b - 3
c - 2
d - 1
e - 0
a - 4
b - 3
c - 2
d - 1
e - 0
a - 4
b - 3
c - 2
d - 1
e - 0
a - 4
b - 2
c - 0
Presence
a - 4
b - 3
c - 2
d - 1
e - 0
a - 4
b - 2
c - 0
a - 4
b - 3
c - 2
d - 1
e - 0
a - 4
b - 3
c - 2
d - 1
e - 0
Engagement
a - 4
c - 0
a - 4
b - 3
c - 2
d - 1
e - 0
a - 4
b - 3
c - 2
d - 1
e - 0
a - 4
b - 3
c - 2
d - 1
e - 0
4 EMPIRICAL STUDY
Due to the context of the pandemic arising from
COVID-19, we planned an immersive experience fol-
lowing the rules of protection and prevention, adopted
to respect the social distancing. For this, we per-
formed a home cinema, which emulated a movie ses-
sion. To do so, the participants met in a video call and
watched a series of terror short films “together”, thus
simulating a movie session in which the participants
could talk freely during the session.
We conducted the study with a total of 30 par-
ticipants, 19 men and 11 women. The participants
were aged between 19 and 28 years (average age
of 22.1), which shows that a young audience was
reached. There were 6 short sessions with 5 partici-
pants in each session. Each session followed the three
stages of the immersive UX framework that we de-
tailed in the next subsections.
4.1 Expectation Stage
For the first stage of the empirical study, we sent the
expectation questionnaire to the users who had agreed
to participate in the empirical study. It contains a brief
explanation of the study, the instructions for the ses-
sion’s day, and the questions to analyze the user’s ex-
pectations.
When the participants receive the expectation
questionnaire, they become aware of the study and
signs the consent form (CF). They also select the day
of the session he/she wishes to attend, and fills out the
expectation questionnaire with his/her answers.
4.2 Performance Stage
In this stage, the evaluator’s team observed the par-
ticipants when experiencing the immersive digital ex-
perience. We presented the short films via a website
called MyCircle
1
, where it is possible to create a room
and show the same video simultaneously for all the
participants.
The sessions had an average duration of 16 min-
utes each and, once it had begun, the evaluators could
not interact with the participants while they simulta-
neously watched the session online. We designed the
experience so that the participants felt being in a real
cinema session, that is, that they felt the presence of
friends, even if each participant was in their home.
To allow observation of participants during the
empirical study, we use the Google meet
2
. The
Google meet tool allowed the use of microphone and
camera, enabling the use of a fly on the wall style
observation technique (Hanington and Martin, 2012).
The fly on the wall technique permits gathering infor-
mation by observing and listening discreetly to users,
without their direct participation, or causing interfer-
ence in the observed behaviors (Hanington and Mar-
tin, 2012). Thus, the technique allowed us to analyse
the behavior of participants in each UX measure anal-
ysed (flow, presence and engagement).
On the day of the session, the participants received
a link to a room on Google Meet, where all partic-
ipants in that session would be present online. The
webcam, as well as the user’s microphone was used
to visualize the reactions and behaviors following the
fly on the wall technique. During the observation, the
data were recorded for further analysis. Participants
could talk freely during the session.
1
www.mycircle.tv
2
https://meet.google.com/
ICEIS 2021 - 23rd International Conference on Enterprise Information Systems
544

4.3 Satisfaction Stage
After the performance stage, where the empirical
study is carried out, and the proposed immersive dig-
ital experience is completed, participants receive a
questionnaire to assess their satisfaction with the ex-
perience. As we stated previously, in this stage, we
collect the main data to evaluate the UX. All the data
gathering in this stage are analyzed and displayed us-
ing radar graphs.
We conducted a pilot study to check the frame-
work’s suitability and some points for improvement
before using it in the empirical study. After mak-
ing some adjustments to the questionnaires, we per-
formed the empirical study, and we present the results
in the next section.
5 RESULTS
In this section, we present the results obtained in the
study we carried out to evaluate the feasibility of our
framework. First, we present the results of the ex-
pectation stage to characterize the participants. Then,
we present the performance and satisfaction results
together, as they are complementary and better under-
stood if analyzed together.
According to item (v) of Section 3.1, we have
value N as being equal to five participants per ses-
sion. Thus, the maximum score that a measure could
obtained in the session is 80. Therefore, all radar
graphs presented in subsection 5.2 will have 80 points
as the default value in the blue triangle (representing
the maximum score) in each UX measurement.
5.1 Results from Expectation
Questionnaire
The first question (Alves. et al., 2021) was asked to
identify whether the participant considers himself a
sociable person. We provide an example of sociable,
which consisted of a person who gets along well with
others, is friendly, and participates in the social en-
vironment in which he/she is inserted. We used this
data to discuss whether the result would imply in the
steps following the expectation. The result was that
86.7% of the participants considered themselves so-
ciable, i.e., they can quickly adapt to the environment
and are friendly to other participants. In contrast,
13.3% of the remaining participants did not consider
themselves sociable.
Following, of the total participants, 56.7% agreed
that participating in group activities without their
friends interferes to a reasonable extent with their ex-
perience. A total of 23.3% pointed out it would not
interfere, and 20% agreed it would definitely inter-
fere. With this result, we expected that perhaps there
would be a certain degree of inconsistency coming
from most of the participants during the session as
their social circle of friends would not always accom-
pany them.
A large part pointed out they like watching
movies, with the difference that 53.3% watch movies
frequently and 43.3% do not usually watch movies
frequently. A small proportion of 3.4% reported that
they do not like to watch movies but may watch
them depending on the occasion. Complementing
this question, for which the participants could mark
both options, 56,7% answered that they like to watch
movies at home and 56,7% answered that they like
to watch in the cinema, and we observed a balanced
preference among the options.
All participants had the habit of using video-call
applications. Even so, there is a difference that 73.3%
usually use these tools in their daily life in general,
while 26.7% use only them for work and/or study.
In regards to the context of the experience, we ob-
tained the following results: only 13.3% of the par-
ticipants have the habit of watching films ”together”
while at the same time separately, and 46.7% had al-
ready had this experience, but do not do it frequently.
Besides, 40% had never participated in anything sim-
ilar.
We also analyzed how the participants considered
their degree of concentration to determine whether the
experience sufficiently kept their attention. The re-
sults showed 60% maintained concentration depend-
ing on what was going on at that moment and 23.3%
reported that they are attentive regardless of the situa-
tion. On the other hand, 16.7% do not consider atten-
tive.
Finally, the data in the last question were collected
so that it was possible to compare the first impressions
of the study subjects with what the experience would
provide. Since this question was open, we used the
method of Underlying Discourse Unveiling Method
(UDUM) (Nicolaci-da Costa, 2007) to categorize the
comments made by the participants. The comments
were analyzed after completing all sessions, and the
satisfaction results sought to understand whether the
public’s expectations had been met. Thus the com-
ments were divided into three groups.
The first group is called “High Expectations”, and
users provided answers in addition to what the experi-
ence might involve, such as the use of advanced sound
equipment. In this category, only five responses were
obtained, being the minority of the results.
Immersive UX: A UX Evaluation Framework for Digital Immersive Experiences in the Context of Entertainment
545
The second group is called “Null Expectations”,
in which are listed responses such as the one that a
participant proffered by stating “I have no expecta-
tions”. In this case, the answer ended up not being
considered when analyzing the fulfillment of public
expectations after the experience. In this group, we
obtained a total of 9 responses.
The third group is called “Realistic Expectations”,
in which the participants’ expectations match what
the experience was able to provide. For example, a
response that says “I think I’m going to watch a video
“together” with other people, I hope it’s going to be
a cool one”. In this group, we obtained 16 comments,
which were the majority of the answers.
5.2 Performance and Satisfaction
Results
The radar graphs analysis is as follows: the maximum
score of each UX measurement is represented by the
outermost triangle in blue. The participants’ answers
in the satisfaction questionnaire are represented by the
innermost orange triangle, with the values represent-
ing the flow, presence, and engagement of a session.
The closer this orange triangle is to the blue triangle,
the more the experience was perceived as engaging
and immersive.
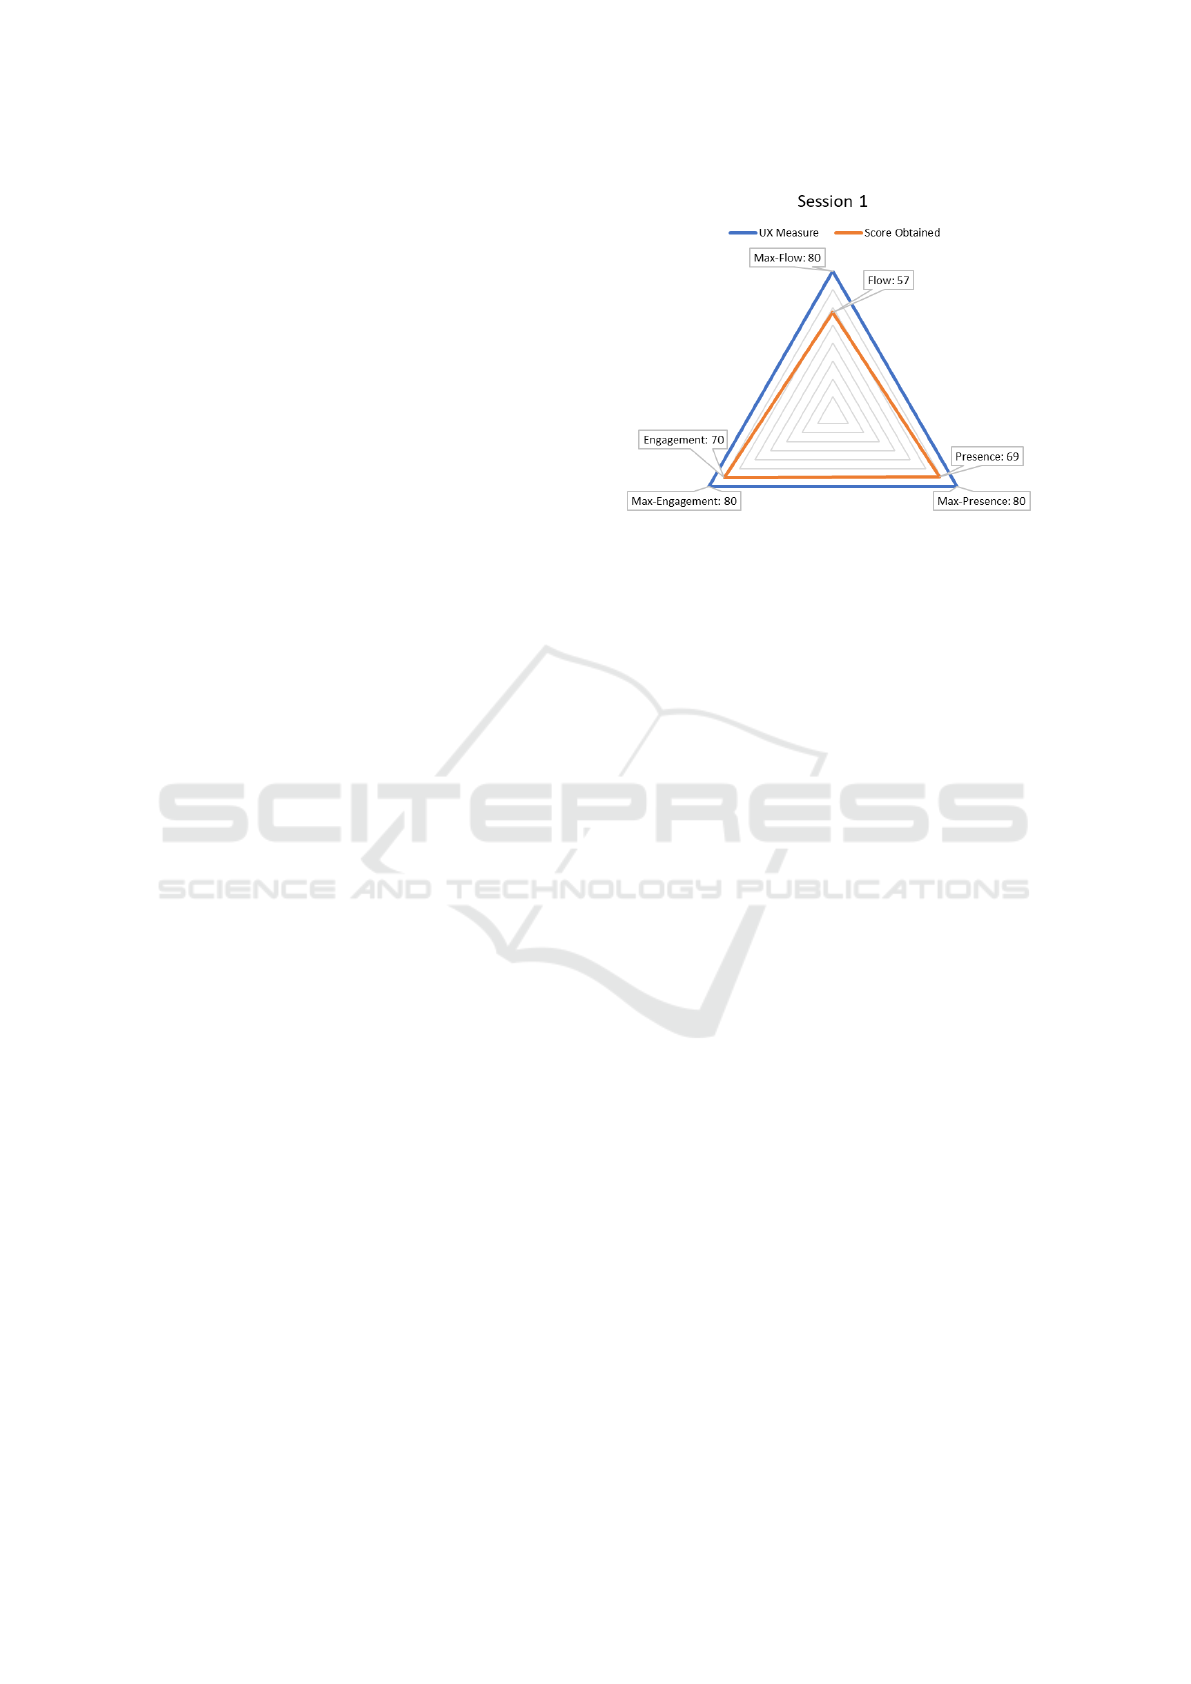
5.2.1 Session 1
In the performance stage of session 1, the partici-
pants had a high degree of interaction, and there was
constant conversation. Furthermore, there were some
problems, such as loud noises of a participant’s audio.
However, it did not hinder the experience.
Despite the problem described above, satisfaction
reflected what was observed during the performance
phase. As can be seen in Figure 1, the flow reached
57 points in this session, showing that the audio noise
hindered the participants’ concentration. However,
the presence reached 69 points, showing that the par-
ticipants noticed the conversation during the session.
Finally, the biggest result was engagement, with 70
points. As engagement resulted from flow and pres-
ence, we noticed that the conversations were a pos-
itive aspect for the participants and made them feel
more engaged in the experience.
5.3 Others Sessions
Due to the limitations of pages allowed for paper sub-
mission, the results of the other short film sessions can
be found in the Technical Report (TR) (Alves. et al.,
2021) where they are more detailed. We recommend
Figure 1: Session 1 values for the measurements of UX.
following the reading of the paper with the TR (Alves.
et al., 2021). In the next section, we will discuss data
from all study sessions.
6 DISCUSSION
Overall, the results showed that the Framework devel-
oped to evaluate the UX of immersive digital experi-
ences allowed understanding the participants’ experi-
ence. Considering the results we collected, the par-
ticipants’ behavior during the sessions (performance
stage) was reflected in the satisfaction questionnaire’s
data (satisfaction stage). We highlight that we pre-
sented the same short film in all sessions.
To demonstrate this result, we highlight the data
obtained from some sessions, such as Sessions 1 and 3
(this data can be found in the technical report (Alves.
et al., 2021)). In these sessions, it is possible to ob-
serve that the presence was greater than the flow (see
the figures 1 and 3 (Alves. et al., 2021)). The re-
sult indicates that the participants’ constant interac-
tion through conversations was confirmed by the an-
swers provided in the satisfaction questionnaire ap-
plied after the experience. It is noteworthy that these
sessions’ participants were not part of the same social
circle, i.e., they did not know each other previously.
Considering that the presence consists of the so-
cialization between the participants, which in the ex-
perience reported here was reflected in the conversa-
tions between them, this may explain the fact that the
result for flow was lower. Considering that the flow
refers to the mental state in which the person is fully
immersed in what he/she is doing, it was expected
that the flow would be lower when the presence was
higher.
This happens because, by interacting through the
conversations, the participants switch their focus from
ICEIS 2021 - 23rd International Conference on Enterprise Information Systems
546

watching the film to devoting more attention to the
other participants’ conversations. In this case, this re-
lationship between the measurements is not harmful.
The experience context should define what is most
important, a greater presence, or a greater flow. The
participants’ interaction is positive in the experience
reported here, so this result can be considered favor-
able for the immersive cinema experience.
In Sessions 1 and 3 (Alves. et al., 2021), conversa-
tions increased the perception of presence (presence
indicator) and decreased immersive cinema experi-
ence flow. However, during Session 5, we observed
that the participants divided their attention between
the conversations and focused on the films more har-
moniously. We noticed that it was reflected in the sat-
isfaction results after the experience (as shown in Fig-
ure 5 (Alves. et al., 2021)), where UX measurements
are closer to each other.
As in Session 5 (Alves. et al., 2021), the partici-
pants’ attention did not stray so much from the focus
on the films, as happened in Sessions 1 and 3, and the
flow was not greatly affected. However, it is still be-
low the score for presence for the same reason as in
Sessions 1 and 3, as previously mentioned. This rela-
tionship remains positive because it is considered that
the interaction between the participants is something
favorable for the experience, and the results of Ses-
sion 5 show that the participants were immersed in the
experience desirably because of the balance achieved.
However, in Session 6, the results of the UX mea-
surements were the lowest among all sessions, as
shown in Figure 6 (Alves. et al., 2021). As mentioned
in the results, there was difficulty identifying whether
some participants’ reaction was caused by concentra-
tion or tedium since the participants did not interact
as much as participants in other sessions during the
performance. However, the final results showed two
participants’ dissatisfaction, causing a low UX score
in the final result. These participants’ discontent was
not evident during the performance stage since Partic-
ipant 1 interacted throughout the session, and Partic-
ipant 2 seemed to be concentrating on the films. In
this sense, the satisfaction questionnaire captured as-
pects that were not captured during the observation.
This result is important to show that the satisfaction
questionnaire allows a better understanding of the ex-
perience.
During the Session 6 (Alves. et al., 2021) results
description, we pointed out the film’s lack of sound
to a participant as a problem. This fact occurred with
Participant 1 and can be a justification for his dissat-
isfaction with the experience. Concerning Participant
2, it was not possible to identify through observation
what may have caused his/her dissatisfaction.
Based on the results and the discussions presented
in this paper, we have indications that the framework
can be used to evaluate flow, presence, and engage-
ment, important UX measures for the context of im-
mersive digital experiences. However, even with the
evaluator’s observation during the performance, the
evaluation is not always effective in identifying possi-
ble reasons for the results obtained in the satisfaction,
as shown during the discussion regarding Session 6.
This result may be an indication that the satisfaction
questionnaire can be more assertive. However, the
Immrsive UX Faamework shows itself as an alterna-
tive to evaluate immersive digital experiences.
7 CONCLUSION AND FUTURE
WORK
In this paper, we described how the measures of flow,
presence, and engagement can be evaluated in con-
texts of immersive digital experiences. To do so, we
proposed a UX evaluation framework, called Immer-
sive UX. As a result, we concluded that for an im-
mersive experience simulating a home cinema, where
people were physically separated (at home) but virtu-
ally together (online), the framework could capture
these people’s perceptions and show the degree of
flow, presence, and engagement experienced by them.
Due to the pandemic context, we plan an expe-
rience for people to feel less distant from others in
the pandemic, creating a digital immersive experience
that reduces social distance, respecting physical dis-
tance. Our results showed that this immersive experi-
ence was positive. Therefore, it is necessary to carry
out more studies to investigate how the framework be-
haves in other immersive entertainment contexts, such
as in crowds and face-to-face groups.
ACKNOWLEDGEMENTS
This research, carried out within the scope of the
Samsung-UFAM Project for Education and Research
(SUPER), according to Article 48 of Decree no
6.008/2006(SUFRAMA), was funded by Samsung
Electronics of Amazonia Ltda., under the terms
of Federal Law no 8.387/1991, through agreement
001/2020, signed with Federal University of Ama-
zonas and FAEPI, Brazil. Also supported by CAPES
- Financing Code 001, CNPq process 311494/2017-
0, and FAPEAM process 062.00150/2020 and POS-
GRAD.
Immersive UX: A UX Evaluation Framework for Digital Immersive Experiences in the Context of Entertainment
547

REFERENCES
Alves., F., Aguiar., B., Monteiro., V., Almeida., E.,
Marques., L. C., Gadelha., B., and Conte., T.
(2021). Support material for immersive ux:
a ux evaluation framework for digital immer-
sive experiences in the context of entertainment,
https://doi.org/10.6084/m9.figshare.14050043.v1.
Bhattacherjee, A. (2001). Understanding information
systems continuance: an expectation-confirmation
model. MIS quarterly, pages 351–370.
Chou, H.-K., Lin, I.-C., Woung, L.-C., and Tsai, M.-T.
(2012). Engagement in e-learning opportunities: An
empirical study on patient education using expecta-
tion confirmation theory. Journal of medical systems,
36(3):1697–1706.
Csikszentmihalyi, M. (1991). Flow: The Psychology of Op-
timal Experience. Harper Perennial, New York, NY.
Goethe, O., Salehzadeh Niksirat, K., Hirskyj-Douglas, I.,
Sun, H., Law, E., and Ren, X. (2019). From ux to en-
gagement: Connecting theory and practice, address-
ing ethics and diversity.
H
¨
akkil
¨
a, J. R., Posti, M., Schneegass, S., Alt, F., Gultekin,
K., and Schmidt, A. (2014). Let me catch this! ex-
periencing interactive 3d cinema through collecting
content with a mobile phone. In Proceedings of the
SIGCHI Conference on Human Factors in Computing
Systems, pages 1011–1020.
Halskov, K., Dalsgaard, P., and Stolze, L. B. (2014).
Analysing engaging experiences with a tangible 3d
tabletop. In Proceedings of the 11th Conference
on Advances in Computer Entertainment Technology,
pages 1–10.
Hanington, B. and Martin, B. (2012). Universal methods of
design: 100 ways to research complex problems, de-
velop innovative ideas, and design effective solutions.
Rockport Publishers.
Huang, L.-T., Chiu, C.-A., Sung, K., and Farn, C.-K.
(2011). A comparative study on the flow experience
in web-based and text-based interaction environments.
Cyberpsychology, Behavior, and Social Networking,
14(1-2):3–11.
Law, E. L.-C., Roto, V., Hassenzahl, M., Vermeeren, A. P.,
and Kort, J. (2009). Understanding, scoping and defin-
ing user experience: a survey approach. In Proceed-
ings of the SIGCHI conference on human factors in
computing systems, pages 719–728.
Lee, H., Jung, T. H., tom Dieck, M. C., and Chung, N.
(2020). Experiencing immersive virtual reality in mu-
seums. Information & Management, 57(5):103229.
Marques, L., Amazonas, M., Castro, T., Assuncao, W.,
Zaina, L., Gadelha, B., and Conte, T. (2020). Ux trek:
A post-interaction journey from immersive experience
logs. In Proceedings of the 19th Brazilian Symposium
on Human Factors in Computing Systems (IHC’20).
M
¨
uller, L. J., Mekler, E. D., and Opwis, K. (2016). He-
donic enjoyment and personal expressiveness in posi-
tive user experiences. In Proceedings of the 2016 CHI
Conference Extended Abstracts on Human Factors in
Computing Systems, pages 3166–3172.
Nakamura., W. T., Marques., L. C., Ferreira., B., Barbosa.,
S. D. J., and Conte., T. (2020). To inspect or to test?
what approach provides better results when it comes
to usability and ux? In Proceedings of the 22nd Inter-
national Conference on Enterprise Information Sys-
tems - Volume 2: ICEIS,, pages 487–498. INSTICC,
SciTePress.
Nicolaci-da Costa, A. M. (2007). O campo da pesquisa
qualitativa e o m
´
etodo de explicitac¸
˜
ao do discurso sub-
jacente (meds). Psicologia: Reflex
˜
ao e Cr
´
ıtica, 20:65
– 73.
Oliver, R. L. (1980). A cognitive model of the antecedents
and consequences of satisfaction decisions. Journal of
Marketing Research, 17(4):460–469.
Oyedele, Y., Greunen, D., and Veldsman, A. (2018). Ux
engagement and interaction. In 2018 7th Interna-
tional Conference on Reliability, Infocom Technolo-
gies and Optimization (Trends and Future Direc-
tions)(ICRITO), pages 792–798. IEEE.
Pallot, M., Eynard, R., Poussard, B., Christmann, O., and
Richir, S. (2013). Augmented sport: exploring collec-
tive user experience. In Proceedings of the Virtual Re-
ality International Conference: Laval Virtual, pages
1–8.
Pettersson, I., Lachner, F., Frison, A.-K., Riener, A., and
Butz, A. (2018). A bermuda triangle? a review of
method application and triangulation in user experi-
ence evaluation. In Proceedings of the 2018 CHI
Conference on Human Factors in Computing Systems,
pages 1–16.
Ren, X. (2016). Rethinking the relationship between hu-
mans and computers. IEEE Computer, 49(8):104–
108.
Russo, P., Costabile, M. F., Lanzilotti, R., and Pettit, C. J.
(2015). Usability of planning support systems: An
evaluation framework. In Planning support systems
and smart cities, pages 337–353. Springer.
Shin, D. (2019). How do users experience the interaction
with an immersive screen? Computers in Human Be-
havior, 98:302–310.
Suh, A. and Prophet, J. (2018). The state of immersive tech-
nology research: A literature analysis. Computers in
Human Behavior, 86:77–90.
Tcha-Tokey, K., Loup-Escande, E., Christmann, O., and
Richir, S. (2016). A questionnaire to measure the user
experience in immersive virtual environments. In Pro-
ceedings of the 2016 virtual reality international con-
ference, pages 1–5.
ICEIS 2021 - 23rd International Conference on Enterprise Information Systems
548
