
Project based on Agile Methodologies by DMAIC
Bianca G. Salvadori, Patricia F. Magnago and Alessandra C. S. Dutra
School of Technology, Pontifícia Universidade Católica do RS (PUCRS), Porto Alegre, Brazil
Keywords: Project Management, Software Development, Bugs Analysis, DMAIC.
Abstract: The demand for the inclusion of Agile Methodologies in technology products and services, particularly in
software development, has become increasingly recurrent. Its application guarantees frequent deliverables,
but not necessarily the desired quality, especially when dealing with the technical challenge of rework and
employee behavior. These are known challenges in the management of this methodology. Based on the
DMAIC method, a customized software development project for a client was analyzed using Agile
Methodologies. The proposed objective fulfilled its role of analyzing the process in the development cycle.
This was achieved by diagnosing gaps in the processes involved in the treatment of 61 identified bugs, data
collection, feedback from the parties involved, and mapping opportunities for improvement, such as the
implementation of FDD, to achieve contour actions.
1 INTRODUCTION
The increased demand for technology systems along
with the speed at which business requirements are
changing has required software development
companies to become more flexible. As decision
making occurs during the project; changes,
adaptability and agility are expected (Soares, 2004).
In addition, the challenges for system development go
beyond technical issues. Variables such as project
management, methodology, organizational culture
and labor are critical in the success or failure of
developing systems, especially when customized
(Ribeiro & Gusmão, 2008).
For technology teams to be dynamic, the use of
Agile Methods has been suggested. This method has
gained importance in several segments of the
software industry where the principle is to build a
system with quality that meets the needs of end users
by promoting sustainable development with a
constant pace of development and effectiveness
(Sbrocco & Macedo, 2012).
The company studied has national operations, of
medium size and develops software for sectors of the
automobile industry and fleet management, making
use of Agile Methods since 2014. Due to increased
current demands, it is difficult for decision makers in
development projects to deal with concomitant
business requirements and provide appropriate
attention to the implementation and management of the
methodology applied by the project teams. In addition,
technical indicators of project quality also have
opportunities for improvement. These generate rework
and impact on customer satisfaction, so this study aims
to propose improvements for greater project efficiency.
The research question was: what opportunities for
improvement exist with the agile project management
practices of the company? This study has as a general
objective of analysing, through a case study, the
development processes of a customized software that
uses Agile Methodologies as a basis. The analysis
tool was the DMAIC method that mapped
management and technical operation gaps.
The specific objectives of the work are: (i) to
perform a focused group dynamic to map and classify
the usability improvements of the site and interface
design with the designer and prototyping area; and (ii)
to identify opportunities for improvements such as
exclusive action plans and not implementing the
mapped processes, structured by 5W2H.
The software project chosen as a case study is of
high complexity as it involves a site and Backoffice
system. The revenue is also considered high if
compared to other projects. In addition, the team
consists of nine employees and is in an intermediate
phase of development. The last phase will be the
analysis of improvement alternatives and control,
which will suggest actions to reduce bottlenecks and
increase team performance, even if it already has
efficient results through agile management.
Salvadori, B., Magnago, P. and Dutra, A.
Project based on Agile Methodologies by DMAIC.
DOI: 10.5220/0010453103370344
In Proceedings of the 23rd International Conference on Enterprise Information Systems (ICEIS 2021) - Volume 2, pages 337-344
ISBN: 978-989-758-509-8
Copyright
c
2021 by SCITEPRESS – Science and Technology Publications, Lda. All rights reserved
337
2 THEORETICAL
BACKGROUND
2.1 DMAIC
The steps Define, Measure, Analyze, Improve and
Control represent the acronym DMAIC. This method
of process improvement is composed of a script that
helps companies solve problems (De Mast &
Lokkerbol, 2012). For each step of DMAIC,
secondary tools have been implemented to help the
development of this study in the technical and
managerial scope.
The first stage of the DMAIC method, called
Define, involves the definition part of the problem:
where the problem occurs, which indicator will be
used, who will be your project team, which schedule
will be established and which database will be used
(De Mast & Lokkerbol, 2012). This first phase is
fundamental for the mapping and can be defined by
the stakeholders involved in the solution - in this case
the team.
The second stage of DMAIC is called Measuring.
In this step the performance of the processes is
evaluated through data collection. The measurement
of this data can be performed in a qualitative and/or
quantitative way. The qualitative one is applied to the
focus of the cause of each problem or process and
seeks to discover its cause. The team maps the most
detailed information to identify the problem while the
quantitative is distinguished by collecting mass data
and uses an indicator to analyze behaviours and
statistics. However, the objective has the same
purpose of identifying the causes of the most
important problems selected by the project (De Mast
& Lokkerbol, 2012).
The third stage of DMAIC, called Analyze,
consists in evaluating the results of the measurements
that will allow us to identify what is missing in the
processes to obtain a better performance. At this
point, it is necessary to analyze the causes of the
problem in question, which can be qualitative or
quantitative, sometimes from a statistical point of
view (Prash, 2014).
The fourth and fifth phases are Improve and
Control and have been dealt with together, as they
propose to evaluate and test possible actions to
implement the necessary changes and/or execute an
action plan to improve the process, starting from the
development of previous phases of DEMAIC
(Prashar, 2014). As the last phase of this work, two
tools were chosen as essential for the suggestion of
improvements in the software development project
that uses Agile Methodologies as a methodology for
managing its processes.
3 RESEARCH METHODOLOGY
This study is characterized as an applied research,
because it aims to solve a specific problem based on
knowledge generated during its development.
Regarding the objectives, the research is considered
exploratory, qualitative and experimental, because
the focus is to propose improvements to the object of
study.
The data collection was carried out in a familiar
environment with the researcher leading an online
focused group held at the end of October (Prodanov
& Freitas, 2013). Additional data was collected
through technical documents related to the recording
systems used by the company.
Table 1: Description of DMAIC application.
Technical Management
D
Through technical documentation it is possible to
characterize the project scope with its forms of
management and technical operation.
Technical Management
M
The Pareto Graph was
used to obtain
quantitative bugs in the
production environment
which is updated every 15
days. These bugs are
caused by test failures and
code break schedule.
The Checklist was made to
evaluate management gaps
involving the profile assigned
to the project leader, for skills
listed on a sheet, which were
verified by the team counting
the frequency of their
adherence.
A
The Focus Group helped
to understand the
problems faced and the
root of the problems in
the user's journey through
the web. It was
established that the
exploration of the insights
would be done by a script
organized in ten attributes
specified to the users.
The Benchmark obtained the
analysis of the causes that
impact the management of the
team of designers compared to
another more efficient team.
The user experience and user
interface guidelines that lead
the user's journey were
analyzed against the American
e-commerce in terms of
usability, communication and
design components.
I e C
Brainstorm allowed the team to build an action plan with
the help of stimulating ideas and creativity. The chosen
participants were the project stakeholders grouped into a
project leader, a product owner, a scrum master, four full
stack software developers, two test analysts and a
designer. To score the characteristics of the actions, the
5W2H tool was used proposing improvements to gain
effectiveness of the Agile Methodology used in the
project.
The procedure used was the cross-sectional case
study on all the processes of a single analyzed project.
ICEIS 2021 - 23rd International Conference on Enterprise Information Systems
338
The deliverables were analyzed fortnightly (in
Sprints) during the second half of the year 2020. This
analysis included the development team.
The main object of this study is the analysis of the
software development project, both in the technical
and managerial scope of the Agile Methodology
using analytical tools organized by the phases of
DMAIC - Table 1.
4 RESULTS
4.1 Define
The project team was composed of ten participants,
two Jr. Full Stack Developers, one Full Stack
Developer (developer members), one Scrum Master,
one Product Owner, one Project Leader (management
members), one UX/UI Designer, two Testing
Analysts and one IT Architect.
The project deliverables took place fortnightly
involving the estimated tasks for each Sprint. New
features were cut from the backlog and prioritized by
the Product Owner, as they are considered
fundamental. These features can range from new
wireframes, such as a button that will direct to a new
page, changing the color of a banner, reducing or
increasing the font size, changing components,
extracting a spreadsheet, including a field to be filled,
placing a QR Code or even developing an online chat
box.
Table 2: Schedule and Effectiveness 2nd Semester 2020.
Sprint Deliveries:
Sprint 22 from 27/07 to 07/08: (15.8/ 20 deliveries: 79% done)
Sprint 23 from 10/08 to 21/08: (17.6/20 deliveries: 88% done)
Sprint 24 from 24/08 to 04/09: (17 / 20 deliveries: 85% done)
Sprint 25 from 07/09 to 18/09: (14/ 15 deliveries: 90% done)
Sprint 26 from 21/09 to 02/10: (21/ 21 deliveries: 100% done)
Sprint 27 from 05/10 to 16/10: (16.4 /18 deliveries: 91% done)
Sprint 28 from 19/10 to 30/10: (20.3/ 26 deliveries: 78% done)
Sprint 29 from 02/11 to 13/11: (18/ 18 deliveries: 100% done)
Sprint 30 from 16/11 to 27/11: Future Sprint
Sprint 31 from 30/11 to 11/12 Future Sprint
Sprint 32 from 14/12 to 25/12: Future Sprint
The Sprints occurred every two weeks, totalling
two per month, and were planned by this product
committee, after the Scrum ceremonies, together with
the Full stack IT Developers that estimate the time for
the development and the Quality area for the test of
each activity. Once this cycle is over, the Product
Owner must validate the business rules of each
activity developed and approved in the testing
environment to later prepare the pull request, known
as the source code that is ready to be copied into the
customer's production environment window. In this
case, the new code was input into the website.
The estimated deliverables had to be 100%
delivered, sometimes this meant the detriment of
some bugs or that other gaps were not completed as
represented in the schedule forsprint most Sprints in
the second half of 2020 – Table 2.
4.2 Measure
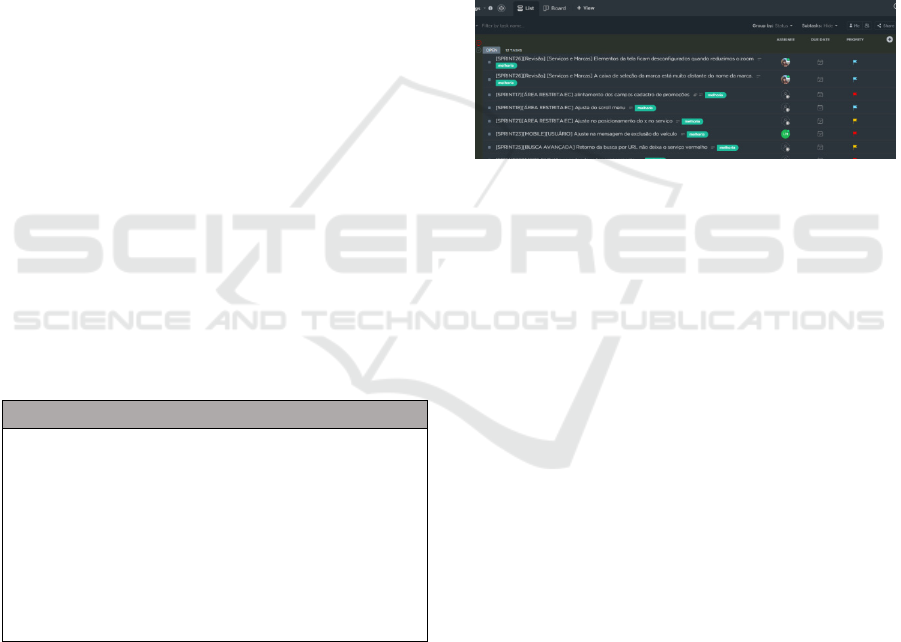
The click up tool was used to extract the competent
data to bugs produced during two weeks of
development (Sprint) reflected in the number of bugs
collected in the customer's environment both on the
site and Backoffice - Figure 1.
Figure 1: Click Up Tool - register of bugs.
System quality tests on both the site and
Backoffice were performed manually by two test
analysts for each Sprint. On the last day of closing
tasks performed during the Sprint, the quality area
conducted a second test, known as unit or regressive
test.
The role of the test analyst was to detect flaws that
do not contemplate the business requirements
documented by the Product Owner, as well as non-
compliances of prototyped components on the
screens performed by the Designers. The test should
compare the visual aspect and check if they conform
with the prototype. However, due to the large number
of bugs remaining in the last two days of the Sprint,
it became unfeasible to manually test all the points of
each task and track their respective bugs. In addition,
the IT full stack developers did not perform unit
testing on the developed code.
As a measurement of the delivery quality, a Pareto
Graph was plotted (Figure 2) which shows the
number of bugs detected per Sprint at the end of the
development cycle and consequently on the client-
side.
Project based on Agile Methodologies by DMAIC
339
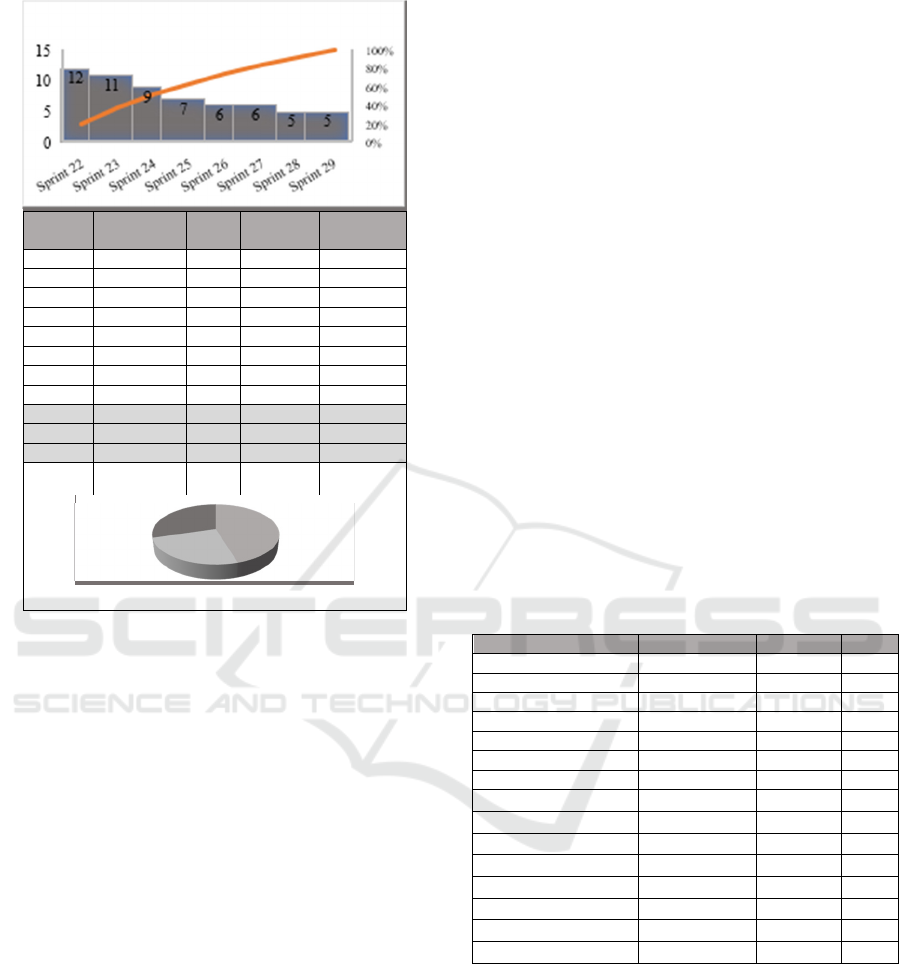
Total
Bugs not
removed
Visual Functional
User
Experience
Sprint 22 12 3 6 3
Sprint 23 11 5 1 5
Sprint 24 9 5 2 4
Sprint 25 7 5 0 2
Sprint 26 6 2 3 1
Sprint 27 6 5 1 0
Sprint 28 5 3 0 2
Sprint 29 5 1 3 2
Sprint 30 Future
Sprint 31 Future
Sprint 32 Future
Total:
61
29
(45%)
16
(25%)
19
(30%)
Figure 2: Pareto Graph.
Besides the Pareto Graph, that represents the total
number of bugs found in the system and on the
website in the customer's production environment for
each Sprint, a secondary data collection was also
performed to register the category assigned to each
bug. In software and technology development, a bug
is interpreted as anything that does not conform or is
outside the standard business requirements
documented in the activity (card), therefore it does
not fulfill its functionality or does not represent the
behavior of the component prototyped by designers.
The questions related to the user experience are
interpreted as improvement, because they meet the
requirements and do not break the flow. However,
they could have a better development, functionality
and form. In general, improvements do not bring new
rules, so they are within the quality cycle.
Applied the Checklist as a measurement tool for
the managerial scope to verify which assignments
would have greater relevance to the current Leader of
agile management, through the employees’ point of
view. Therefore, eight team members were chosen,
including: Full stack Junior, Full Developers, Test
Analysts, designers, Scrum Master and Product
Owner. The most critical attributions were decision
making, responsibility, communication, organization
and transparency as points of extreme importance,
followed by adaptability, empathy, commitment,
engagement, democracy and trust. Finally, the least
critical points identified relate to impulsiveness,
authoritarianism and management of resources and
changes.
The application of this tool aimed to map the
skills needed for the agile project leaders to achieve
effective team management, including changes in
scope and prioritization which require fast delivery of
high performance.
The outcome of the checklist was analyzed
against the management gaps of the project and the
main failure identified was internal communication.
The role of this company's Agile Project Leader is to
manage the employees in a dynamic way, ensuring
that the process remains regular and fluid.
Nevertheless, the relationship with the client is
fundamental for the success of the project, as the
Leader is responsible for the negotiation of deadlines
and deliverables, feedback and management of the
project as a whole. The extra bugs identified are
directly proportional to the management gaps of the
leadership, since they are associated with failed
deliverables in the development cycle, tests and also
in the product area.
Leader´s Profile Score % of Score Check
Communicative 23 95,8% v
Decision Maker 24 100% v
Organizer 23 95,8% v
Empathic 20 83,3%
Committed 20 83,3%
Engaged 18 75%
Resource management 15 62,5%
Adaptative
21 87,5%
Responsible
24 100% v
Democratic
22 91,6% v
Impulsive
14 58,3%
Impatient
17 70,8%
Confident
22 91,6% v
Authoritarian
14 58,3%
Transparent
23 95,8% v
Figure 3: Checklist.
The developers delivered codes without code
reviews and automated testing leading to errors that
testing analysts ended up not identifying. The
delivery of each collaborator is their own
responsibility. The execution of processes agile
management must achieve a degree of maturity for
the team to manage itself. In this study, the Project
Leader was the only one interacting with the client
and managing the fluidity of internal
communications. Depending on the level of maturity
45%
25%
30%
ICEIS 2021 - 23rd International Conference on Enterprise Information Systems
340
of the team, these tasks can be discarded over time.
The Scrum Master in the Agile Methodology also has
the role of leading, encouraging, understanding, and
pointing out improvements to the development team,
although in this project his main role was in technical
support. Figure 3 presents the results of the checklist
reported by the team considered by the author of this
study as above 90% the level of excellence in ability,
which means that they are already well developed by
the leadership.
4.3 Analyze
For the third phase of DMAIC in the technical field,
the Focused Group tool was used to discuss and
analyze the usability and the design irregularities on
the website's screens - Table 3. The analysis time was
three hours and it was conducted by five participants
of the project and another three participants of the
user experience and design area who were not active
in the project.
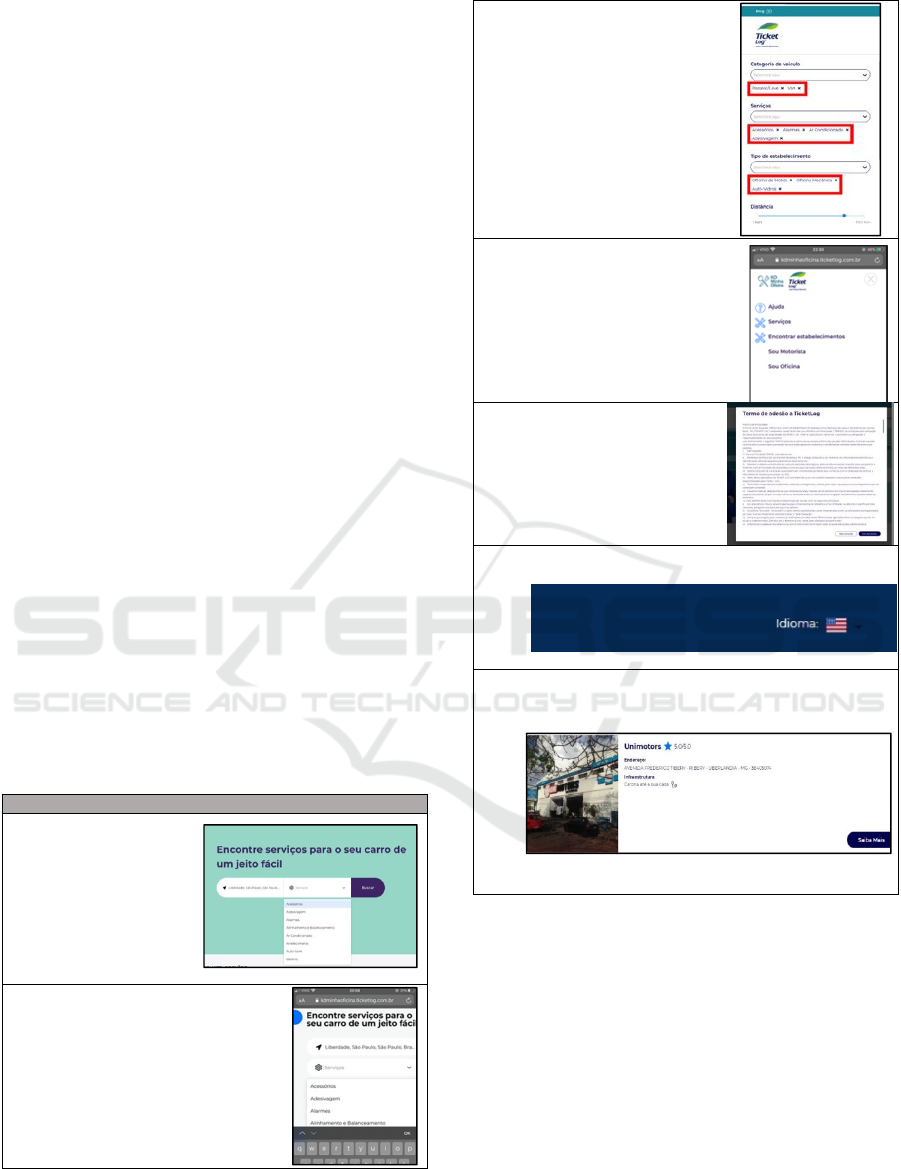
The analysis focused on three major screens of the
website: Homepage – the main page with the start
URL which contains the main information, banners,
a header with the user access area and a dynamic
footer aiming to introduce the user to a menu with the
main information of the platform and FAQ;
Advanced search – a specific page to find and filter
information by geolocation/using a map, to later
obtain the results; Page of each service offered - a
page gathering the main information and services of
the client’s maintenance market partners.
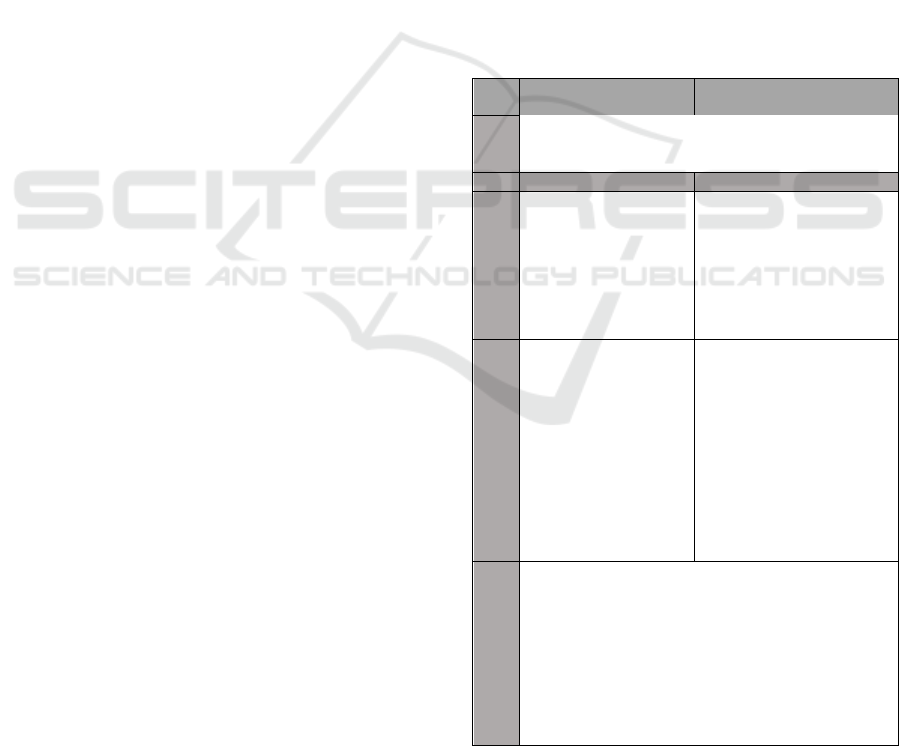
Table 3: Focused Group.
Parts of the system
Search for maintenance
services on the
Homepage’s Desktop
Navigation: there is no
scroll bar specifying that
there are more services in
the list.
Error: Functional
Search for maintenance services on the
Homepage in Mobile navigation: the
dropdown that brings the list of
maintenance services is not aligned, it
has a font larger than the standard and
there is no scrollbar to scroll.
Error: Visual
Advanced Search in Desktop
Navigation:
in the fields with filters, the selected
parameters were below the field
followed by an "x" used for
exclusion. However, it is not intuitive
that such parameter has been selected
since the color is similar to the other
components.
Error: User experience
Menu in Mobile navigation: absence of
the icons representing the restricted
area of the Driver and the Workshop.
In addition, the Services and Find Shop
icons are the same which can confuse
the user.
Error: Visual
Adhesion Term for users who had
their first access in the restricted
area: the "No, I agree" button does
not finish the action as the click
does not work.
Error: Functional
Footer in Desktop and Mobile Navigation: the website has the
option of English translation, but it is not functional.
Error: Functional
Advanced Search Results: only the "Learn More" button directs
to the establishment page. This is not very intuitive, as no
actions occur when the users click on the photo or the body of
the card.
Error: User Experience
The benchmark tool was implemented for the
management of the Analyze stage which objective is
to observe and understand good practices of a
company preferably active in the same field. The
chosen company also works within the vehicle
maintenance industry but in the United States (U.S.).
The website to search and schedule services for
mechanical workshops, tire stores and vehicle
maintenance repair stores is available only in the U.S.
with more than fifty thousand partner establishments.
The platform also well known as vehicle parts
marketplace and auto parts reseller has been
distinguished by its usability and user-friendly
interface to schedule services via the internet.
Project based on Agile Methodologies by DMAIC
341
Therefore, we contacted the company via e-mail
to understand how the product area creates
functionalities, plans the user's journey and new
services for the user driver and how they manage
backlog. The benchmark was carried out via a phone
call of approximately two hours in which the Product
Owner, two UX/UI Designers, the Project Leader and
the project stakeholders talked to the product area of
this maintenance website. The main insight was to
understand that the great backlog generator is the
conduction of interviews with the users and potential
customers of the platform on a recurring basis. The
interviews (surveys) focus on truck drivers,
outsourced freight drivers from large logistics
companies, van drivers, micro van drivers and last but
not least, light and passenger vehicle drivers.
The interviews take place every thirty days. Based
on the users' feedback, the functionalities are created,
such as offering gas filter cleaning for vehicles using
CNG which was requested by drivers from the states
of Wisconsin, Indiana, Ohio and Illinois. The
company focused on hiring partners who made this
service available in the Midwest region of the U.S. by
promoting the establishments that met this demand on
its website.
4.4 Improve and Control
In the last phase of the DMAIC tool, two important
instruments were chosen. They suggest improvements
to increase the performance of the project, improving
the
use of Scrum and consequently reducing the
bottlenecks studied and identified in the processes.
To reduce the gaps in the Measuring and
Analyzing phase at the managerial level, it is
suggested to use the brainstorming tool in the
grooming meeting to refine the rules added in the user
stories. The role of this tool, when applied in a
meeting with all members of the project, is to bring
people together encouraging discussions and
generating ideas to improve behaviors, processes,
internal communication and consequently technical
deviations over time. As an outcome of this study, it
was identified that there is a lack of internal
communication between the team which can be
solved with the adherence of fortnightly team
grooming meetings or even with the inclusion of this
tool in the Sprint Retrospective ceremonies.
As a tool to diminish bugs in the system and
problems related to usability, interface and user
experience, the use of 5W2H tools and also the FDD
(Feature Drive Development) is recommended. Table
4 shows the tasks assigned to each project collaborator
and their monthly working hours capacity. The
calculation of the developers' productivity was based
on eight-hour working days. Although for Full Stack
Junior Developers during delivery speeds, it was
sometimes considered two hours less of productivity
due to the level of delivery. Considering this
information, it becomes more evident the importance
of fulfilling each task in its entirety so that there is no
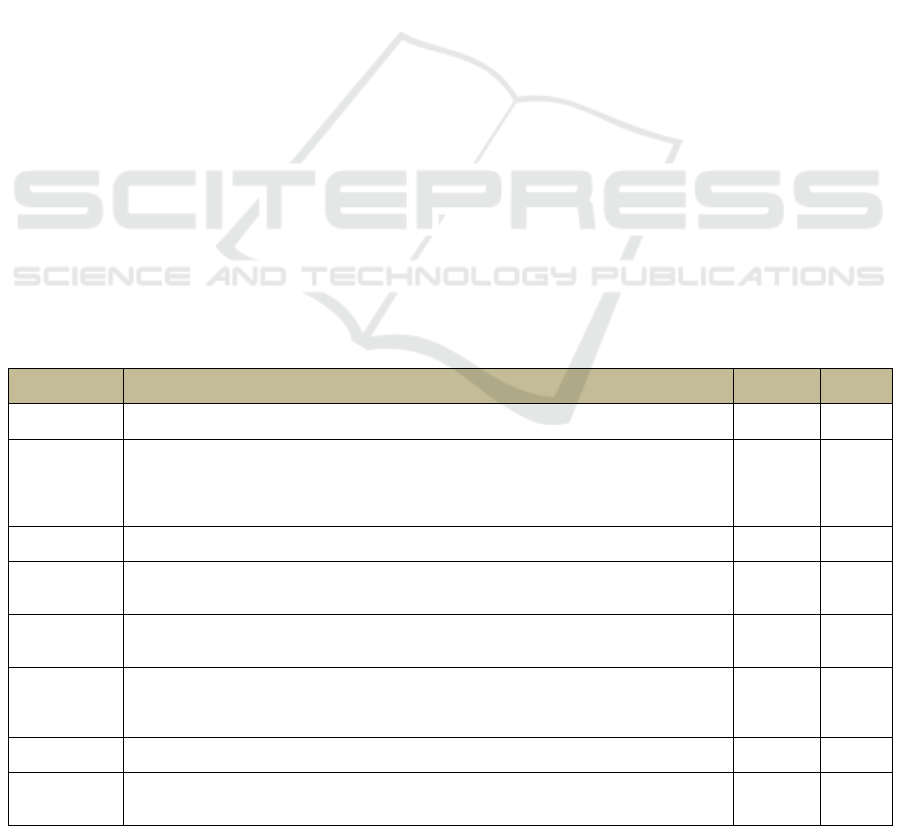
overload. Table 4 presents the number of hours per day
involved in the opening, diagnosis, development and
correction of bugs by the team.
Table 4: Capacity of hours/day x Tasks.
Team Tasks
Capacity of
hours/ day
Rework -
Bug
Leader of Project
Participation in meetings with stakeholders and client; Team management; Presentation of project
status report; Performance monitoring.
8h
-
Product Owner
Elaborate Roadmap, documentation of user stories for each activity (card), meeting with project and
client stakeholders, co-creation of prototypes with UX/UI Designers, interviews with users, creation
of backlog, organization of the Click Up, Gitlab and JIRA tool, prioritization of activities (cards),
participation in all Scrum ceremonies and following-up with the teams in charge of activities, testing
and validation of deliverables.
8h
1h
(12,5%)
Designer UX/UI
Participation in meetings with stakeholders and client, weekly meetings with the Product Owner to
understand the business rules, prototyping with wireframes, creation of components and layouts.
8h
20min
(4,16%)
Full Stack Jr.
Developer
Backend and frontend coding in React and JavaScript, unit test after each activity performed.
Participation in all Scrum ceremonies. On average it receives 5 low and medium complexity activities
per Sprint.
6h
1h
(16,7%)
Full stack Full
Developer
Backend and frontend coding in React and JavaScript, unit test after each activity performed.
Participation in all Scrum ceremonies. On average it receives 6 medium and high complexity activities
per Sprint.
7h
1.5h
(21,4%)
Scrum Master
Participation in all Scrum ceremonies. Daily's protagonist, follow-up of the technical development
team, technical assistance and IT team management. Technically the Scrum Master leads the
technologies approached in the project and makes decisions. To elaborate the pull request with the
source code ready to deploy in the client's production environment.
8h
1.5h
(18,7%)
IT Architect
To project the architecture of the environments developed with its technologies and dedicates only
30% of his time to the project.
3h -
Test Analyst
To test all the activities estimated and delivered by the Sprint, perform manual tests in the test
approval environment and then a unit and regressive test at the end of the Sprint. They are
responsible for opening the bug incidents and for following them up.
7h
6h
(85,7%)
ICEIS 2021 - 23rd International Conference on Enterprise Information Systems
342
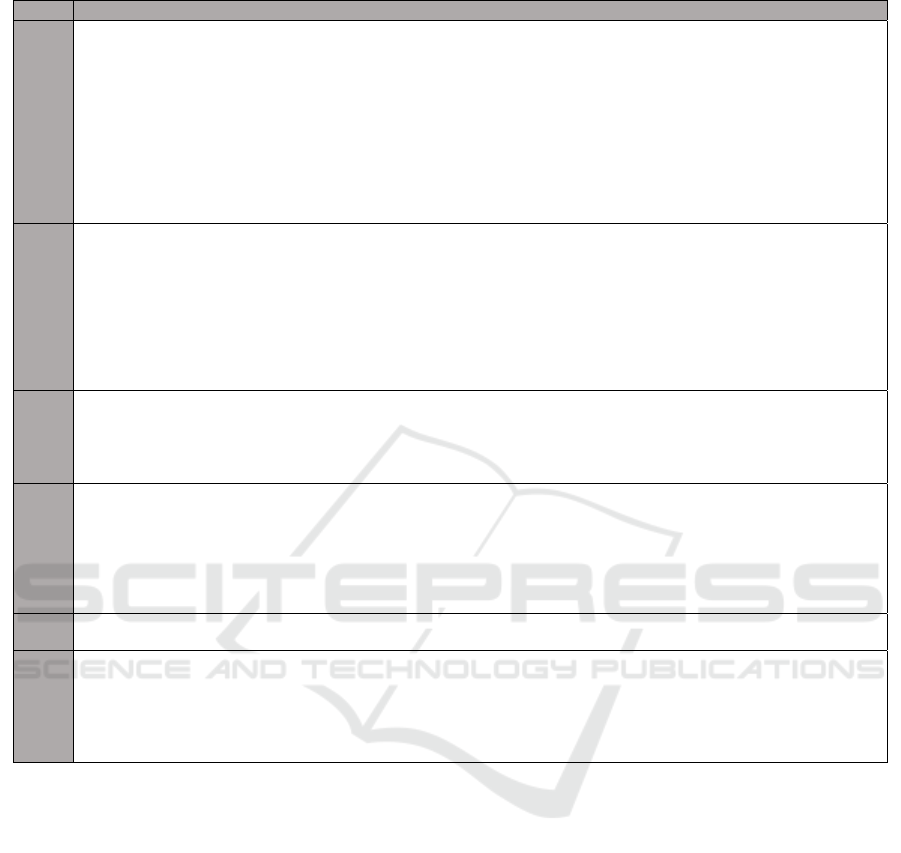
Table 5: 5W2H.
5W2H Suggestions
What?
1.Automated testing before code and code review.
2. Inclusion of the Design Review column to check each component of the screen delivered by the Developer, check font size
and compare parameters and components with the prototype.
3. Time metrics for the correction of each bug which must start in accordance with the degree of criticality, not by the
opening date.
4. Holistic revision of the components of the prototype compared to the developed screen.
5. Include the FDD as a small process within the agile. The development of projects through the application of Feature
Driven Development, created by Jeff de Luca and Peter Coad in Singapore (SBROCCO, 2012, p.99) in the years 1997/1998,
is considered an option for companies that act in an interactive and incremental way. However, it is necessary to maintain a
pre-defined process. The methodology also recommends that a record is kept of every implementation, as follows: organized
by functionality and dates, since the creation.
Why?
1. The developer will have a revised code delivery through automated testing.
2. The Designer will be able to do the revision and point out some faults before the test, making it less overloaded and
preventing more bugs from opening.
3. Greater control of the completion time of each bug, to decrease their accumulation at the end of Sprint.
4. To have a more reliable check of the components that were previously unnoticed, decreasing bugs in the client.
5. The use of FDD in a project recommends the application of a tool that allows the organization to adopt all the implementations
that they want to create, enabling the inclusion and discrimination of all the necessary components for the new features
(BARBOSA; 2008, p.10). Therefore, this will facilitate the understanding of the user stories and the business requirements, the
inclusion of rule comments in the code and quality process improvements.
Where?
1. In localhost and code development platform.
2. Click up system in the current Sprint development - management and activity control tool.
3. Click up in the Bug area - activity management and control tool.
4. In the test approval area.
5. Along the Sprint and management by the Click Up tool.
When?
1. During coding, the Developer uses the FDD before starting the task and after coding, completing the automated test.
2. This column will be included after each task delivered by the developer and before the quality test. After that, the approved
screen will be sent to the test analyst.
3. When a bug is opened, the test analyst should communicate the PO who will determine the degree of priority and estimate
the time of completion.
4. At the time of manual testing.
5. At Scrum ceremonies and Sprint development.
Who?
1. Full stack Jr. and Full Developers 2. UX/UI Designer 3. Test Analyst and Product Owner 4. Test Analyst
5. Every project´s workers
How?
1. Automated testing training for Full stack Junior Developers.
2. Including as a new task for the Project Designer.
3. Assigning as a new process of control and management of the opening and correction of bugs.
4. Including as a manual testing activity.
5. Including as a second agile tool, through the verification of macro features and their user stories and inclusion of rules and
comments in the code.
At the first level of 5W2H (What), it was
suggested the implementation of automated testing
by developers and the FDD during the development
cycle. The business requirements should be tested
and reviewed before starting to code. After the
coding is finished, a new test of what has been
developed should be conducted.
As a second chosen of improvement, it was
suggested the inclusion of a new phase during the
Sprint process by the UX/UI Designer who should
also validate the tasks that involve frontend. This
phase would be initiated after the delivery of the card
by the developer and before the testing column. As a
third definition of improvement, it was suggested the
allocation of time for the solution of each bug,
stipulating a goal of hours according to the degree of
priority. The degree of priority must be defined not
by the opening date of the incident, but by the degree
of urgency defined by the Product Owner.
The control phase involves monitoring the
improvements over time after their implementation:
a review after three months to verify if the
objectives were met. The monitoring can be mainly
performed by the Project Leader who will gather
data on the performance of the team over the eight
Sprints along with the number of bugs. To support
the monitoring process, it is also suggested
fortnightly Specifications meetings. These meetings
bring together the development team and the
Product Owner whose goal is to refine the business
rules of each user stories and understand in depth
what should be codified, thus expanding the
technical/functional understanding and avoiding
rework. In addition, the Discovery Review is to
evaluate and annotate the degree of satisfaction of
the project’s stakeholders including the customers.
Project based on Agile Methodologies by DMAIC
343

5 CONCLUSION
In conclusion, it was possible through the DMAIC
method to analyze the gaps presented by the project.
The project applied part of the Agile Methodologies
as the basis of its processes. To summarize, it can be
concluded that the project fulfilled the role of agility
and effectiveness but it could have achieved even
better results if the performance of each
collaborator's role was accomplished. It can be
affirmed that the proposed objective has been
reached once that the development of the approach
brought insights and suggestions for improvements
to increase the team's performance. Regarding the
specific objectives, it can be understood that they
have been also achieved, since the tools were
applied in the Define, Measure, Analyze, Improve
and Control phases, both in the technical and
managerial spheres. For technical gaps, suggestions
to reduce the number of bugs in the client's
production environment and actions to reduce
usability and design failures on the website as well
as rework. For the managerial area, suggestions for
improvements to strengthen internal
communication and the respective demands have
been proposed.
In this study, the price attributed to the five
points of suggested improvements have not been
analyzed. It was considered not feasible to price
them at this stage, but it would be recommended to
conduct a price analysis in future studies.
Furthermore, as a continuation of this study, it is
proposed to compare its findings with a second
software development project conducted by another
team and client, so that the profile of these
employees, development cycles and products could
be explored.
REFERENCES
Barbosa, A. Azevedo, B.; Pereira, B.; Campos, P.; Santos,
P., 2013. Metodologia Ágil: Feature Driven
Development, Published in: Universidade do Porto/
2008, 2013.
De Mast, Jeroen; Lokkerbol, Joran., 2012. An analysis of
the Six Sigma DMAIC method from the perspective
of problem solving. In: International Journal of
Production Economics, v. 139, n. 2, p. 604-614.
Prashar, Anupama. Adoption of Six Sigma DMAIC to
reduce cost of poor quality. International Journal of
Productivity and Performance Management, 2014.
Prodanov, C. C.; Freitas, E. C de. Metodologia do
Trabalho Científico: Métodos e Técnicas da Pesquisa
e do Trabalho Acadêmico. 2ª ed. Rio Grande do Sul:
Editora Feevale, 2013, 70 p
Ribeiro, L.; Gusmão, C.. Definição de um processo ágil
de gestão de riscos em ambientes de múltiplos
projetos. HÍFEN, v. 32, n. 62, 2008.
Soares, Michel D.S.. Comparação entre metodologias
Ágeis e tradicionais para o desenvolvimento de
software. INFOCOMP Journal of Computer Science,
v. 3, n. 2, p. 8-13, 2004.
Sbrocco, J.H.; Macedo, P. C. Metodologias Ágeis
Engenharia de Software sob Medida, São Paulo, 1ª
Edição, 2012.
ICEIS 2021 - 23rd International Conference on Enterprise Information Systems
344
